I. INTRODUCTION
Quantum dots (QDs), also referred to as semiconductor nanocrystals, exhibit unique size- and shape-dependent optical and electronic properties Reference Huynh, Dittmer and Alivisatos1–Reference Zhou, Gao, Hu and Xu7 and are of great interest in applications such as optoelectronics, Reference Gao, Lesser, Kirstein, Möhwald, Rogach and Weller8 photovoltaic devices, Reference Song and Yang9 and biological labels. Reference Chan and Nie10 However, to realize the successful applications of these fluorescent QDs, these inherently unstable nanoparticles should be stabilized by matrix materials and the aggregation of QDs in this process must be prevented. If they are applied in biomedicine, the chemical/biological stability and cytotoxicity of QDs also need to be concerned about.
For QDs stabilized by small molecules such as thiols and TOPO, the surface modification of QDs is required to be compatible with the host environment. Recent efforts centered on tailored ligands to functionalize QDs include the utilization of (i) natural biomolecules such as DNA, Reference Deng, Samanta, Nangreave, Yan and Liu11 protein, Reference Majithia, Patterson, Bondos and Meissner12 peptide, Reference Pinaud, King, Moore and Weiss13 biotin, Reference Lingerfelt, Mattoussi, Goldman, Mauro and Anderson14 albumin, Reference Mamedova, Kotov, Rogach and Studer15 collagen, Reference Sinani, Koktysh, Yun, Matts, Pappas, Motamedi, Thomas and Kotov16 lysine, Reference Jiang, Mardyani, Fischer and Chan17 serotonin, Reference Rosenthal, Tomlinson, Adkins, Schroeter, Adams, Swafford, Mcbride, Wang, DeFelice and Blakely18 dextran, Reference Chen, Ji and Rosenzweig19 chitosan, Reference Constantine, Gattas-Asfura, Sarita, Crespo, Rastogi, Cheng, DeFrank and Leblanc20 and cyclodextrin; Reference Palaniappan, Xue, Arumugam, Hackney and Liu21 (ii) linear polymers including poly(methacrylic acid) Reference Lin, Joseph, Chang and Lee22 and poly(para-phenylene vinylene), Reference Skaff, Sill and Emrick23 dendritic polymers such as poly(amidoamine), Reference Guo, Li, Wang and Peng24–Reference Huang and Tomalia26 poly(ethylenimine), Reference Mao, Yao, Wang and Liu27 etc.; and (iii) inorganic molecules such as silica, Reference Gerion, Pinaud, Williams, Parak, Zanchet, Weiss and Alivisatos28 siloxane Reference Chen and Rosenzweig29 surfactant micelle. After surface modification, the quantum yield (QY) of QDs usually decreases greatly, which limits their applications. Reference Liu, Kim, Wang, Wang and Peng30,Reference Smith, Duan, Rhyner, Ruan and Nie31 Therefore, proper stabilizers and ways still need to be explored to functionalize QDs without decreasing their QY.
In the present work, hyperbranched poly(amidoamine) with amine terminal groups (HP-EDAMA1) was synthesized and used to functionalize CdTe QDs. After functionalization, the photoluminescence of CdTe QDs was greatly enhanced and the QY of the resulting CdTe/HP-EDAMA1 nanocomposites was 2 times that of pure CdTe QDs. This strategy effectively solves the photoluminescence quenching of QDs in the modification process by matrix materials.
II. EXPERIMENTAL SECTION
A. Materials
Ethylenediamine (EDA), CdCl2·2.5H2O (99%), NaBH4 (96%), tellurium powder (99.999%), and methanol were purchased from Shanghai Reagent Company (Shanghai, China). Methylacrylate (MA) was purified under reduced pressure before use. 3-Mercaptopropionic acid (MPA, >99%) was purchased from Fluka (St. Louis, MO). Ultrapure water with 18.2 MΩ cm was used in all experiments.
B. Synthesis
1. Synthesis of CdTe QDs stabilized by MPA
Based on the reaction between CdCl2 and NaHTe solution in the presence of MPA as a stabilizer, water-soluble CdTe QDs were prepared. Reference Li, Qian, Fang and Ren32 , Reference Gao, Kirstein, Möhwald, Rogach, Kornowski, Eychmuller and Weller33 Cd precursor solutions were generated by mixing a solution of CdCl2 and MPA solution, followed by adjusting the pH value to 8.2 with 1 M NaOH. The typical molar ratio of Cd:Te:MPA in our experiments was 2:1:4.8, and the concentration of Cd2+ and MPA were 3.1 and 7.5 mM, respectively. After deaeration with N2 for 30 min, the oxygen-free NaHTe solution was injected under vigorous stirring. Then, the resulting mixture was heated to 100 °C under microwave and refluxed for 40 min.
2. Synthesis of amine-terminated hyperbranched poly(amidoamine)
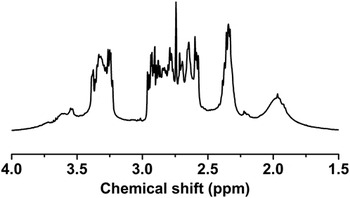
Hyperbranched poly(amidoamine) can be synthesized from commercially available AB and Cn types of monomers (1/1 mol ratio) by one-pot polymerization via the couple-monomer methodology. Reference Shi, Tu, Zhu, Qian, Ren, Liu, Zhu, Yan, Kong and He34 In a one-neck flask, 18.03 g (0.3 mol) ethylenediamine (EDA) and 20 mL methanol were added, and then 25.83 g (0.3 mol) methyl acrylate (MA) mixed with 20 mL methanol was added dropwise into the flask under stirring in an ice-salt bath. The system was allowed to react at room temperature for 48 h. Then, the flask was fixed onto a rotary evaporator to remove methanol under vacuum. After reacting for 1 h at 60 °C, 2 h at 100 °C, 2 h at 120 °C, and 2 h at 140 °C on the rotary evaporator in vacuum, a slightly yellow dope was obtained and was abbreviated as HP-EDAMA1. It is worth mentioning that the water pump was replaced by an oil pump for the reaction at 120 and 140 °C to improve the vacuum degree and the reaction degree subsequently. After end-capping by palmityl chloride, the weight average molecular weight (Mw) measured by gel permeation chromatography (GPC) was about 1.1 × 10⁴ and the Mw polydispersity index (PDI) was 2.7. 1H NMR (400 MHz, CDCl3, 298 K) (see Fig. 1), δ = 1.80–2.30 (NH 2, NH), 2.30–2.50 (COCH 2), 2.50–3.0 (COCH2CH 2NH, NHCH 2CH2NH, NHCH2CH 2NH2), 3.20–3.50 (NCH 2), 3.50–4.0 (OCH 3).
1H NMR spectrum of HP-EDAMA1 (400 MHz, in CDCl3, 298 K).

3. Preparation of CdTe QDs by HP-EDAMA1 functionalization
A typical procedure is as follows: 1.25 mL as-prepared CdTe QDs were added dropwise to 10 mL HP-EDAMA1 aqueous solution (0.89 g/L) under vigorous stirring. After stirring at room temperature for 24 h in the dark, the aqueous solution was centrifugated to remove large particles, and thus, the CdTe/HP-EDAMA1 nanocomposites were obtained. A series of samples were prepared by changing the concentration of HP-EDAMA1.
C. Measurements
1H NMR measurements were carried out on a Varian Mercuryplus 400 NMR spectrometer (Santa Clara, CA) with CDCl3 as solvent. pH values were measured by a Starter 3C digital pH meter. Transmission electron microscopy (TEM) and elemental characterization were done on a JEOL 2010 microscope with an energy-dispersive x-ray spectrometer (EDS; Tokyo, Japan) at an accelerating voltage of 200 kV. X-ray diffraction (XRD) spectrum was taken on a D/max-2550/PC x-ray diffractometer (Tokyo, Japan) operated at 40 kV voltage and 40 mA current with Cu Kα radiation. For the XRD measurement, the CdTe/HP-EDAMA1 nanocomposites were rotary evaporated to remove water and then dried under vacuum. Dynamic light scattering (DLS) measurements were carried out at 25 °C by using Zetasizer Nano-S (Malvern Instruments Ltd., Malvern, Worcestershire, UK). UV-Vis spectra were recorded on a Varian Cary 50 UV/Vis spectrometer (Santa Clara, CA). Emission spectra were collected using a Varian Cary spectrometer. The infrared measurements were performed on a Varian 800 FTIR spectrometer (Santa Clara, CA). Thermogravimetric analysis (TGA) was performed under nitrogen on a STA 409 PC thermal analyzer (Selb, Germany).
The QY of CdTe/HP-EDAMA1 nanocomposites was measured according to the methods described in Ref. Reference Jones, Jackson, Choi and Bergmark35 using rhodamine 6G as a reference standard (QY = 95%). The absorbance for the standard and the CdTe/HP-EDAMA1 samples at the absorption peak and the fluorescence spectra of the same solutions excited at wave lengths of absorption peaks were measured respectively. The area of the fluorescence spectrum from the fully corrected fluorescence spectrum was calculated. Rhodamine 6G (ethanol) and the CdTe/HP-EDAMA1 solutions (0.03 < the absorbance at the excitation wave length < 0.1) were used in the measurements. The QY was calculated according to the following equation:
 $${\varphi _x} = {\varphi _s}\left( {{{{{\rm{F}}_x}} \over {{{\rm{F}}_s}}}} \right)\left( {{{{{\rm{A}}_s}} \over {{{\rm{A}}_x}}}} \right){\left( {{{{{\rm{\eta }}_x}} \over {{{\rm{\eta }}_s}}}} \right)^2}\quad ,$$
where the subscripts s and x denote standard (rhodamine 6G) and test samples, respectively, ϕ is QY, F is the area of integrated fluorescence intensity, A is the absorbance at the absorption peak, and η is the refractive index of the solvent.
III. RESULTS AND DISCUSSION
Scheme 1(a) demonstrates the synthesis of CdTe QDs stabilized by MPA. Based on the reaction between CdCl2 and NaHTe solution in the presence of MPA as stabilizers, water-soluble CdTe QDs were prepared. Scheme 1(b) depicts the synthesis of HP-EDAMA1 hyperbranched polymer based on a two-step reaction. First, an intermediate was obtained by Michael addition of MA to EDA at room temperature. Second, increasing the temperature and vacuum degree drives the intermediate to form HP-EDAMA1 by multistep amidation reactions.
Illustration for the synthesis of CdTe QDs stabilized by MPA (a), HP-EDAMA1 hyperbranched polymers (b), and the functionalization of CdTe QDs by HP-EDAMA1 (c).

The polymer structure of amine-terminated HP-EDAMA1 was analyzed by 1H NMR (Fig. 1). The peaks between 1.80 and 2.30 ppm can be assigned to the amine groups in the molecular chain. The peaks corresponding to the double bond of MA were not found, indicating that all the double bonds of MA reacted with amines while weak signals at about 3.50–4.00 ppm corresponding to methoxyl groups of MA remain, indicating that methoxyl groups had not fully reacted with amines during the stepwise polymerization.
As hyperbranched HP-EDAMA1 have a great quantity of primary amine terminals, they can be used to functionalize CdTe QDs, which are stabilized by 3-mercaptopropionic sodium (MPA-Na). By HP-EDAMA1 functionalization, CdTe QDs are doubly capped by MPA-Na and HP-EDAMA1, as illustrated in Scheme 1(c).
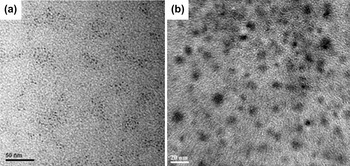
TEM was utilized to characterize the size of CdTe QDs before and after HP-EDAMA1 functionalization. Figure 2(a) illustrates that the initial CdTe QDs are well dispersed and the average diameter of CdTe QDs is about 2.6 nm. Figure 2(b) shows the image of CdTe QDs functionalized by HP-EDAMA1. It can be seen that the CdTe/HP-EDAMA1 assemblies have an average diameter of 10.5 ± 1.7 nm. The corresponding EDS spectrum gives the signals of Cd and Te elements, which can be seen in the Supplementary Material.
TEM images of CdTe QDs before (a) and after HP-EDAMA1 functionalization (b).

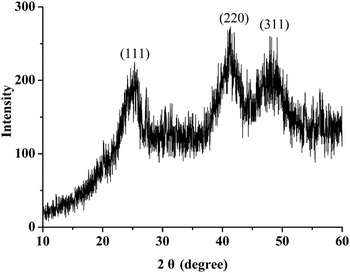
Figure 3 shows XRD patterns of CdTe QDs functionalized by HP-EDAMA1 (the concentration of HP-EDAMA1 is 0.89 g/L). The characteristic peaks at 25.3° (111), 41.3° (220), and 47.9° (311) indicate the formation of cubic (zinc blende) CdTe (JCPDF card no. 75-2086).
XRD pattern of CdTe QDs functionalized by HP-EDAMA1.

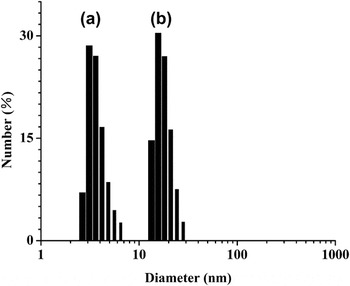
The hydrodynamic diameters of CdTe QDs before and after HP-EDAMA1 functionalization was measured by DLS technique. Figure 4 gives the particle size distributions of CdTe QDs before and after HP-EDAMA1 modification. It can be found that the average diameter of QDs increases from 3.6 ± 1.0 nm to 15.7 ± 4.5 nm after HP-EDAMA1 functionalization. For the HP-EDAMA1 used in our experiments, the hydrodynamic diameter is about 3.2 nm. Considering the size of initial CdTe QDs, there is an increase of the diameter by 12.1 nm, indicating the formation of CdTe/HP-EDAMA1 assemblies. That is, in these nanocomposites, CdTe QDs are surrounded by several HP-EDAMA1 macromolecules.
The hydrodynamic diameters of CdTe QDs before (a) and after (b) HP-EDAMA1 functionalization, measured by DLS.

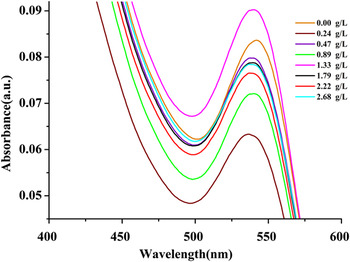
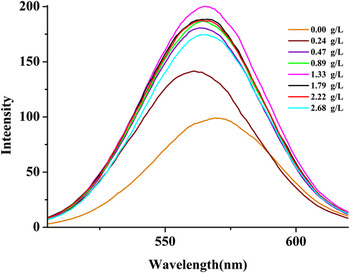
Figure 5 gives the UV-Vis spectra of CdTe QDs functionalized by various concentrations of HP-EDAMA1. To make sure the accuracy of the relative QY calculated, diluted CdTe samples were used to collect UV-Vis spectra so that the absorbance at the absorption peak could be smaller than 0.1 and larger than 0.03. For the pure CdTe QDs, there is an absorption peak at 542 nm, while it has a blue shift after HP-EDAMA1 functionalization. This is due to the coordination interactions between the amines of HP-EDAMA1 and CdTe QDs. The electrostatic interactions between the amines of HP-EDAMA1 and the mercaptopropionic acid anions also play an important role in the blue shift of the absorption peak. The concentrations of HP-EDAMA1 (from 0.24 to 2.68 g/L) have similar effects on the absorbance peak of CdTe QDs. The corresponding photoluminescence spectra of CdTe QDs functionalized by various concentrations of HP-EDAMA1 are shown in Fig. 6. The emission peak of CdTe QDs slightly shifts from 572 to 564 nm.
The UV-Vis spectra of CdTe QDs functionalized by HP-EDAMA1 with various concentrations.

The photoluminescence spectra of CdTe QDs functionalized by HP-EDAMA1 with various concentrations.

The relative QY of CdTe QDs functionalized by HP-EDAMA1 was measured according to the method described in Ref. Reference Jones, Jackson, Choi and Bergmark35, as shown in Fig. 7. Rhodamine 6G in ethanol with a reported QY of 0.95 was used as a QY standard, the absorbance for the standard and the CdTe/HP-EDAMA1 samples at the absorption peak and the fluorescence spectra of the same solutions excited at wave lengths of absorption peak were measured, respectively. The QYs of CdTe QDs functionalized by HP-EDAMA1 with various concentrations are all enhanced greatly. With increasing the concentration of HP-EDAMA1 from 0 to 0.89 g/L, the QY of CdTe QDs increases gradually from 0.31 to 0.64. While further increasing the concentration of HP-EDAMA1, the QY of CdTe QDs no longer increases and remains at a high level. These results show that the QY of CdTe QDs can be greatly enhanced by only adding HP-EDAMA1 hyperbranched polymers. The resulting high QY nanocomposites might be well applied in gene transfection and drug delivery. Importantly, the gene transfection and drug delivery process can be monitored due to the high fluorescence of CdTe QDs prepared. These results are quite different from previous studies that the photoluminescence of QDs can be quenched by further functionalization with tailored ligands, providing a method to effectively solve the photoluminescence quenching of QDs in the process of modification by matrix materials. Reference Liu, Kim, Wang, Wang and Peng30,Reference Smith, Duan, Rhyner, Ruan and Nie31,Reference Pan, Gao, He, Cui and Zhang36
QY of CdTe QDs versus the concentration of HP-EDAMA1. Each value represents the mean ± SD of three determinations.

The QY of CdTe QDs is mainly determined by their surface state. The surface defects of QDs can trap electron or hole and thus prevent its radiative recombination. By proper surface passivation to reduce nonradiative surface recombination of charge carriers, the QY can be enhanced. Here, the HP-EDAMA1 hyperbranched polymers act as surface passivation ligands to get rid of surface traps caused by dangling bonds, resulting in the emission enhancement of CdTe QDs. We think that HP-EDAMA1 hyperbranched polymers do not penetrate the MPA-Na layer and they act as a new layer for capping CdTe QDs. Consequently, CdTe QDs are capped by MPA-Na (first layer) and HP-EDAMA1 (second layer). The HP-EDAMA1 has many amines, so they can coordinate with the dangling bonds and get rid of surface traps caused by dangling bonds.
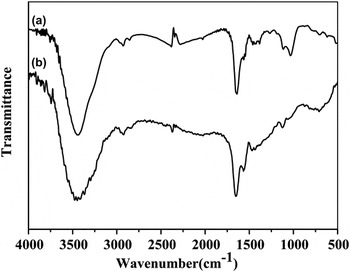
To further investigate the mechanism for the enhancement of CdTe QDs by HP-EDAMA1 functionalization, Fourier transform infrared (FTIR) spectra of CdTe QDs after HP-EDAMA1 functionalization (the concentration of HP-EDAMA1 is 0.89 g/L) and pure HP-EDAMA1 were characterized, as shown in Fig. 8. The bands at 2922 and 2843 cm−1 in both curves correspond to asymmetric –CH2– stretching vibration and symmetric –CH2– stretching vibration, respectively. The characteristic bands assigned to amides I and II in HP-EDAMA1 are at 1639 and 1547 cm−1, respectively, while the band positions of amides I and II slightly shift to 1652 and 1566 cm−1 in the CdTe/HP-EDAMA1 nancomposites. These changes indicate that coordination interactions exist between CdTe QDs and HP-EDAMA1 through their amine groups. Previous report on the synthesis of nanocrystals with dendrimer template also shows that the interactions between dendrimers and nanocrystals lead to frequency shifts in FTIR. Reference Manna, Imae, Aoi, Okada and Yogo37
FTIR spectra of pure HP-EDAMA1 (a) and CdTe QDs functionalized by HP-EDAMA1 (b).

The composition of CdTe QDs functionalized by HP-EDAMA1 (the concentration of HP-EDAMA1 is 0.89 g/L) was measured by TGA, and the results are shown in Fig. 9. The weight loss below 200 °C is due to the removal of absorbed physical and chemical water. TGA thermograms show a great weight loss in the temperature range 200–450 °C, which is the range of decomposition temperature for HP-EDAMA1. At 800 °C, the weight is 10.5 wt%, attributing to the existence of CdTe QDs in the CdTe/HP-EDAMA1 nanocomposites.
TGA weight loss curves of CdTe QDs functionalized by HP-EDAMA1. The heating rate was 20 °C/min.

IV. CONCLUSIONS
Hyperbranched poly(amidoamine)s with amine terminals (HP-EDAMA1) were synthesized by one-pot approach and subsequently used to functionalize preformed CdTe QDs with enhanced QY. Quite different from previous studies in which the photoluminescence of QDs was quenched by further functionalization with tailored ligands, the QY of resulting CdTe/HP-EDAMA1 nanocomposites was 2 times that of pure CdTe QDs without treatment. This strategy effectively solves the photoluminescence quenching of QDs in the process of modification by matrix materials. The resulting high QY nanocomposites might be well applied in gene transfection and drug delivery, which can be monitored by their own fluorescent CdTe QDs.
Supplementary Material
Supplementary materials can be viewed in this issue of the Journal of Materials Research by visiting http://journals.cambridge.org/jmr.
ACKNOWLEDGMENTS
This work is supported by the Joint Fund for Fostering Talents of National Natural Science Foundation of China and Henan Province (Grant No. U1204213), the project of science and technology development of Henan Province (Grant No. 122102310522), the project of science and technology development of Anyang City (Grant No. 2011-41), and the social development projects of Anyang City (Grant No. 2012-218).