Implications
Methane production from enteric fermentation of ruminants is a considerable source responsible for global warming. The present study developed a range of prediction equations for methane production of beef cattle using dietary and animal factors (live weight, feed intake and dietary nutritive values). These equations enable beef farmers and their advisers to estimate methane emission from beef cattle under individual farming conditions. The accurate prediction of methane emission is essential for beef industry to develop appropriate feeding and management strategies in the battle against global warming.
Introduction
Current legislation requires reduction of environmental pollution from agriculture, of which methane (CH4) emission from ruminants is the most important pollutant in the battle against global warming. Atmospheric CH4 is responsible for approximately 20% of global warming, whereas CO2 accounts for up to 60% and the rest is contributed from N2O and other sources (Houghton et al., Reference Houghton, Meira Filho, Callendar, Harris, Kattenbureg and Maskell1996). The livestock sector produces 37% of all human-induced CH4, as suggested in a recent report of the United Nation FAO (Food and Agriculture Organization) (Steinfeld et al., Reference Steinfeld, Gerber, Wassenaar, Castel, Rosales and de Haan2006). The enteric fermentation of ruminants accounts for a major part of total CH4 emission, especially in Europe, where beef, lamb and milk are the major food sources for humans. In the UK and Republic of Ireland, ruminants contribute approximately 20% of all CH4 emission, with most arising from cattle. Therefore, there is increasing interest in research to reduce enteric CH4 emission from ruminant animals. The reduction in enteric CH4 emission can also increase the efficiency of energy use for production in cattle and sheep. Methane energy (CH4-E) output on average, takes account for 6% of total gross energy (GE) intake in lactating dairy cows (Yan et al., Reference Yan, Agnew, Gordon and Porter2000) and 8% in beef cattle (Mc Court et al., Reference Mc Court, Yan, Mayne and Porter2005).
Recent studies undertaken at the Agri-Food and Biosciences Institute have demonstrated that on average, dairy cows produced 519 l/day of CH4 (Yan and Mayne, Reference Yan and Mayne2007) and the value with mature beef cattle (average live weight (LW) 513 kg) was 253 l/day (Mc Court et al., Reference Mc Court, Yan, Mayne and Porter2005). However, CH4 emission varies greatly with different production levels and dietary chemical composition. For example, CH4 production in dairy cows was found to range from 20 to 43 l/kg of dry matter intake (DMI), and in beef cattle from 18 to 48 l/kg of DMI (Yan and Mayne, Reference Yan and Mayne2007; Mc Court et al., Reference Mc Court, Yan, Mayne and Porter2005). These large variations present a great opportunity for livestock industries to reduce CH4 pollution by adjustment of production levels and manipulation of dietary composition. A number of statistical models have been published recently for prediction of CH4 production and mitigation strategies for reducing CH4 emission in dairy cows (Holter and Young, Reference Holter and Young1992; Yan et al., Reference Yan, Agnew, Gordon and Porter2000; Ellis et al., Reference Ellis, Kebreab, Odongo, McBride, Okine and France2007). There is little comparable information in beef cattle. Ellis et al. (Reference Ellis, Kebreab, Odongo, McBride, Okine and France2007) presented a range of prediction equations for CH4 emission in beef cattle, using CH4 data determined from either whole animal calorimetry, hood calorimetry or sulphur hexafluoride tracer gas technique. The latter two methods are unable to measure CH4 production in the hindgut lost through the anus.
At the Agri-Food and Biosciences Institute, a number of studies with beef cattle were recently undertaken to evaluate effects of changes in diet on energy metabolism including CH4 output using whole animal calorimeters. The objective of the present study was to use these data to evaluate the relationship between CH4 output and dietary and animal factors and to use these relationships to develop prediction equations for CH4 emission of beef cattle.
Material and methods
Animals and diets
The dataset used in the present study was obtained from 108 beef steers in five energy metabolism studies (Kirkpatrick, Reference Kirkpatrick1995; Kirkpatrick et al., Reference Kirkpatrick, Steen and Unsworth1997; Lavery, Reference Lavery1998; Gordon et al., Reference Gordon, Dawson, Ferris, Steen and Kilpatrick1999; McIlmoyle et al., Reference McIlmoyle, Patterson and Kilpatrick2000) undertaken at the Agri-Food and Biosciences Institute, formerly the Agricultural Research Institute of Northern Ireland, from 1993 to 1999. The animals used were of various ages (growth to finishing) and LW (364 to 627 kg), and from different breeds (Friesian, Aberdeen Angus, Simmental and Charolais).
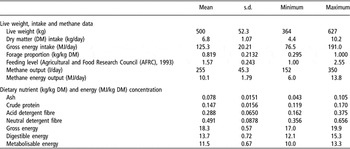
The animals were offered either forage alone as a sole diet (n = 52), or a mixture of forage and concentrates (n = 56) at production feeding levels. In the latter situation, the concentrates were offered either as a complete diet with forage, or separately from forage. The concentrate proportion in mixed diets ranged from (g/kg of DM) 170 to 705 with a mean of 349 (s.d. = 213.2). The forage used included grass silage, fresh grass, dried grass and fodder beet. Forage offered in the study of Kirkpatrick et al. (Reference Kirkpatrick, Steen and Unsworth1997) was either fresh grass, dried grass or grass silage (no mixture of forage given), and in Lavery (Reference Lavery1998), fodder beet was used to replace grass silage at a ratio of either 0 or 40% on a DM basis. The grass silages encompassed primary growth and first and second regrowth material. The grass was either unwilted or wilted before ensiling and ensiled with or without application of silage additives. The concentrates used were based on barley, maize, wheat, soybean meal, citrus pulp and mineral and vitamin supplement. The data on mean, s.d. and range for animal and dietary variables are presented in Table 1.
Animal and dietary data (n = 108)

In each experiment the animals were offered the experimental diets for at least 3 weeks in group-housed pens before measurement of energy metabolism data. In the metabolism unit, each animal was housed for 8 days with total collection of faeces and urine during the final 6 days. Immediately after completion of the balance measurement, each animal was transferred to indirect open-circuit respiration calorimeters. The animals remained in the calorimeters for 3 days with measurement of gaseous exchange over the final 48-h period. All equipment, procedures, analytical methods and calculations used in the calorimetric experiments were as reported by Gordon et al. (Reference Gordon, Porter, Mayne, Unsworth and Kilpatrick1995), and calibration of the chambers by Yan et al. (Reference Yan, Agnew, Gordon and Porter2000).
Statistical analysis
Prediction equations for CH4 emission were developed using LW, DMI or GE intake (GEI) as a single predictor in the linear or quadratic regression, and using LW plus feeding level, DMI or GEI, together with some dietary factors as predictors in multiple regressions. In the latter situation, dietary factors used include some of digestible energy (DE)/GE, metabolisable energy (ME)/GE, forage proportion and dietary concentration of ME, CP, ADF and NDF. Feeding level was calculated from ME intake divided by ME requirement for maintenance (Agricultural and Food Research Council (AFRC), 1993). The stepwise multiple regression technique was used to develop multiple prediction equations and the technique automatically selects the best and significant predictors to fit the prediction equations. Effects of experiment on these relationships were removed by the following model (equation
(1)):

where ai represents the effect of experiment i for i = 1 to 5, x 1, x 2, …, xn are the x-variables and b 1, b 2, …, bn are their regression coefficients.
An internal evaluation was undertaken to validate the prediction equations for CH4 emission by dividing the whole dataset into two subsets, one-third (n = 36) and two-thirds (n = 72) of data. In order to obtain a similar range in CH4 output between two sub-datasets, the whole dataset was divided into groups of three cattle according to CH4 output from the highest to the lowest values; and within each group, one steer’s data were randomly selected for the one-third dataset and remaining two cattle’s data for the two-thirds dataset. Two-thirds of the data were used to develop similar relationships to those developed using the whole dataset. These new equations were then evaluated using the remaining one-third of data and the mean-square prediction error (MSPE; equation
(2)):


where  or
 is the mean of predicted or actual CH4 output; n is the number of pairs of values of predicted or actual CH4 output compared; SP 2 or SA 2 is the variances of predicted or actual CH4 output; b and R are, respectively, of the slope and correlation coefficient of the linear regression of predicted on actual CH4 output. The three components are thus due to mean bias (
 ), line bias (the deviation of the slope) and random variation of the slope. Mean prediction error (MPE; equation (3)), rather than MSPE, was used to describe the prediction accuracy.
The whole dataset (n = 108) was also used to validate prediction equations for beef cattle published elsewhere, using the technique stated previously.
The statistical program used in the present study was Genstat 10.1, 10th edition (Lawes Agricultural Trust, Rothamsted, England, UK, 2007).
Results
Relationships between methane emission and animal and dietary variables
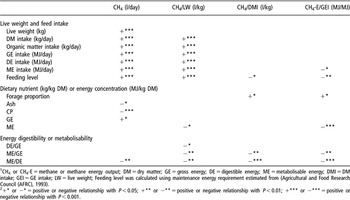
The significant levels for the linear relationship between CH4 emission or CH4-E output and animal and dietary variables are presented in Table 2. Total CH4 output was positively related to LW, feed intake (DM and organic matter), energy intake (GE, DE and ME) and feeding level (P < 0.001). Similar positive relationships were also obtained between CH4/LW and feed intake, energy intake and feeding level (P < 0.001). Increasing feeding level reduced CH4/DMI (P < 0.05) or CH4-E/GEI (P < 0.01). Increasing ME intake also reduced CH4-E/GEI (P < 0.05). Dietary nutrient concentration and energy digestibility also influenced CH4 emission. There were positive relationships (P < 0.05) between GE concentration and total CH4 output, and forage proportion and CH4/DMI or CH4-E/GEI. Total CH4 output was negatively related to ash (P < 0.05) and CP (P < 0.001) concentration, and negative relationships were also obtained between ME concentration and CH4/LW (P < 0.05) or CH4-E/GEI (P < 0.001). Energy digestibility or metabolisability was negatively related to CH4 variables: i.e., DE/GE v. CH4/LW (P < 0.05); ME/GE v. CH4/LW, CH4/DMI or CH4-E/GEI (P < 0.01); ME/DE v. CH4, CH4/LW, CH4/DMI or CH4-E/GEI (P < 0.01).
Significant levels for the linear relationships between methane output and dietary and animal factorsFootnote 1,Footnote 2

1 CH4 or CH4-E = methane or methane energy output; DM = dry matter; GE = gross energy; DE = digestible energy; ME = metabolisable energy; DMI = DM intake; GEI = GE intake; LW = live weight; Feeding level was calculated using maintenance energy requirement estimated from (Agricultural and Food Research Council (AFRC), 1993).
2 +* or −* = positive or negative relationship with P < 0.05; +** or −** = positive or negative relationship with P < 0.01; +*** or −*** = positive or negative relationship with P < 0.001.
Prediction equations for methane output
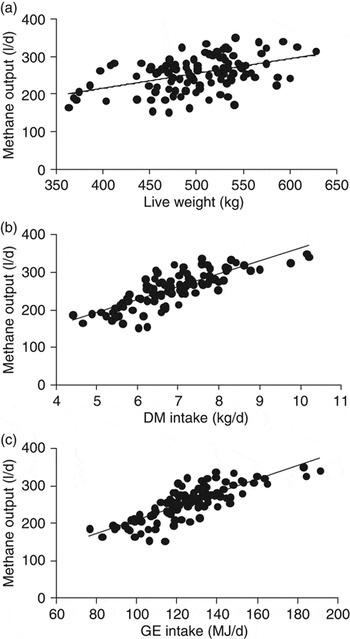
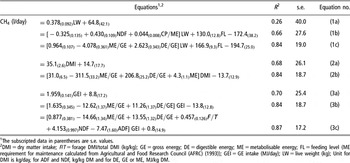
Linear and multiple prediction equations for CH4 output developed in the present study are presented in Table 3 and the relationships between CH4 emission and LW, between CH4 emission and DMI and between CH4 emission and GEI are presented in Figure 1. All relationships were significant (P < 0.001) and each predictor had a significant effect on the relationship (P < 0.05 or less). The relationships between CH4 output and LW, DMI or GEI were examined in a number of linear and non-linear regression models. None of the curve-linear techniques fitted significantly better than the linear regression. The linear relationship between CH4 emission and LW was poor (equation (1a)), with a low R 2 and high s.e. value, whereas the R 2 increased to 0.68 and 0.70 in the relationship between CH4 and DMI (equation (2a)) and between CH4 and GEI (equation (3a)). Adding feeding level together with NDF concentration and CP/ME (equation (1b)), or with ME/GE and DE/GE (equation (1c)) to support LW for prediction of CH4 emission resulted in a higher R 2 (0.66 or 0.84) and a lower s.e. (27.6 or 19.0). Inclusion of energy digestibility and ME/GE as secondary variables to support DMI or GEI also increased R 2 to 0.84 (equation (2b) or (3b)). Further addition of dietary forage proportion and ADF and NDF concentration to equation (3b) marginally increased R 2 to 0.87 (equation (3c)).
The relationship between methane emission and live weight (a), dry matter (DM) intake (b) and gross energy (GE) intake (c).

Linear and multiple prediction equations for methane output weight using live weight or DMI together with other variables

1The subscripted data in parentheses are s.e. values.
2DMI = dry matter intake; F/T = forage DMI/total DMI (kg/kg); GE = gross energy; DE = digestible energy; ME = metabolisable energy; FL = feeding level (ME requirement for maintenance calculated from Agricultural and Food Research Council (AFRC) (1993)); GEI = GE intake (MJ/day); LW = live weight (kg); Unit for DMI is kg/day, for ADF and NDF, kg/kg DM and for DE, GE or ME, MJ/kg DM.
Internal validation of prediction equations developed in the present study
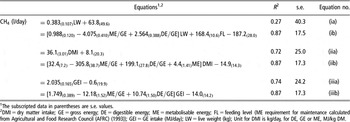
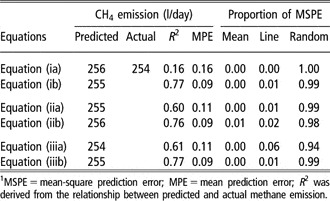
The equations (ia) to (iiib) (Table 4), developed from two-thirds of the present dataset (n = 72), are similar to those presented in Table 3, developed from the whole dataset. These new equations were validated (Table 5) using the remaining one-third of the dataset (n = 36). The mean predicted CH4 output from all six equations ((ia) to (iiib)) were close to actual data. With all six equations, 94% to 100% of prediction error was derived from random variation (error from random variation divided by total MSPE), while a little error was derived from mean bias (mean difference between predicted and actual data) and line bias. However, using LW as the sole predictor (equation (ia)) produced a relatively large MPE and a low R 2 in the relationship between predicted and actual CH4 emission. Using DMI or GEI as the sole predictor (equation (iia)14 or (iiia)) produced a better prediction accuracy than equation (ia), with a lower MPE (0.11 or 0.11 v. 0.16) and higher R 2 (0.60 or 0.61 v. 0.16). Addition of feeding level and energy digestibility and ME/GE to equation (ia) considerably reduced MPE to 0.09 and increased R 2 to 0.77 (equation (ib)). Similarly, inclusion of energy digestibility and ME/GE to equations (iia) and (iiia) decreased MPE to 0.09 and increased R 2 to 0.76 (equation (iib)) and 0.77 (equation (iiib)), respectively.
Internal validation – prediction equations for methane emission developed using two-thirds of the present data (n = 72)

1The subscripted data in parentheses are s.e. values.
2DMI = dry matter intake; GE = gross energy; DE = digestible energy; ME = metabolisable energy; FL = feeding level (ME requirement for maintenance calculated from Agricultural and Food Research Council (AFRC) (1993)); GEI = GE intake (MJ/day); LW = live weight (kg); Unit for DMI is kg/day, for DE, GE or ME, MJ/kg DM.
Internal validation of prediction equations for methane output developed from two-thirds of present data (Table 4) using one-third of the present dataFootnote 1

1 MSPE = mean-square prediction error; MPE = mean prediction error; R 2 was derived from the relationship between predicted and actual methane emission.
Discussion
Relationship between methane production and animal and dietary factors
It is well documented that CH4 emission (l/day) from enteric fermentation in cattle is a function of feed intake. A number of recent studies have published a range of prediction equations for CH4 (or CH4-E) emission using feed intake (DM or energy) as a primary predictor in dairy cows (Holter and Young, Reference Holter and Young1992; Yan et al., Reference Yan, Agnew, Gordon and Porter2000; Mills et al., Reference Mills, Kebreab, Yates, Crompton, Cammell, Dhanoa, Agnew and France2003; Ellis et al., Reference Ellis, Kebreab, Odongo, McBride, Okine and France2007). Yan et al. (Reference Yan, Mayne and Porter2005) also developed a supplementary equation using LW and milk yield as predictors in dairy cows, which enables the prediction in the situations where feed intake is not available, such as on commercial farms. However, there is little comparable information available for beef cattle. Ellis et al. (Reference Ellis, Kebreab, Odongo, McBride, Okine and France2007) published a range of prediction equations for beef cattle using DMI or ME intake as primary predictors, in a review of CH4 studies in beef cattle (n = 83) undertaken in North America from 1986 to 2004. The R 2 value obtained in the relationship between CH4 and DMI or ME intake was very low (0.44 or 0.36). In the present study, the R 2 was 0.68 with DMI or 0.70 with GEI. Ellis et al. (Reference Ellis, Kebreab, Odongo, McBride, Okine and France2007) attributed the poor relationships to the variation in animals used in different studies, such as animal type, physiological status, gender, weight, growth rate, activity level and age. The other limitation in the dataset of Ellis et al. (Reference Ellis, Kebreab, Odongo, McBride, Okine and France2007) could be derived from CH4 measurement techniques. In six of 14 studies, CH4 was estimated from the sulphur hexafluoride tracer gas technique and one study used hood calorimeters. These two techniques do not measure the CH4 production in hindgut lost through the anus. Furthermore, feed intake could only be estimated for grazing cattle when using these techniques.
The present study demonstrated that the relationship between CH4 and LW was poor when compared to DMI or GEI (R 2 = 0.26 v. 0.68 or 0.70). Holter and Young (Reference Holter and Young1992) reported an even poorer relationship between CH4 and LW with pregnant Holstein dry cows, with an R value of −0.15 for various forage diets and 0.22 for maize and wilted grass silage diets. In the present study, addition of feeding level and energy digestibility and ME/GE to support LW considerably increased the R 2 value to 0.84, a value which was similar to that obtained using DMI or GEI together with energy digestibility and ME/GE. Further inclusion of dietary forage proportion and ADF and NDF concentration to the relationship using GEI as the primary predictor only marginally increased the R 2 values and slightly reduced the s.e. values. Ellis et al. (Reference Ellis, Kebreab, Odongo, McBride, Okine and France2007) also developed a range of multiple regression equations for prediction of CH4 production in beef cattle, using either DMI or ME intake as the primary predictor, together with some variables of forage proportion and fibre intake (ADF, NDF and lignin). No accuracy parameters for these relationships (e.g., R 2 values) were presented, so comparison cannot be made with the equations developed in the present study.
The internal validation undertaken in the present study indicated that LW was a poor predictor of CH4 production in beef cattle when compared with DMI and GEI, with MPE being 0.16 v. 0.11 or 0.11, R 2 in the relationship between predicted and actual data being 0.16 v. 0.61 or 0.60. The prediction accuracy when using LW can be substantially improved by adding feeding level and energy digestibility and ME/GE (MPE = 0.09; R 2 = 0.77). These MPE and R 2 values were similar to those obtained using DMI or GEI together with energy digestibility and ME/GE. Further inclusion of dietary forage proportion and ADF and NDF concentration in the relationship, using GEI as the primary predictor, had no effect on prediction accuracy. Therefore, CH4 emission in beef cattle can be accurately predicted from LW with feeding level, DMI or GEI together with energy digestibility and ME/GE.
Effects of dietary and animal factors on CH4 production
The average CH4 production per kg DMI in the present study for beef cattle was 37.5 l/kg, which is higher than that reported for dairy cows. Methane output per kg DMI ranged from 28.5 to 32.0 l/kg DM in dairy cows (Moe and Tyrrell, Reference Moe and Tyrrell1979; Mills et al., Reference Mills, Kebreab, Yates, Crompton, Cammell, Dhanoa, Agnew and France2003; Yan et al., Reference Yan, Mayne and Porter2005; Ellis et al., Reference Ellis, Kebreab, Odongo, McBride, Okine and France2007). The higher value in the present study may be attributed to the lower quality of feed used for beef cattle compared with the diets offered to dairy cows. A more important reason may be attributed to the difference in extent of rumen fermentation between dairy and beef cattle. The proportion of assumed feed for maintenance in beef cattle is much higher than in lactating dairy cows. For example, when using the ME requirements for maintenance of AFRC (1993), feeding level in the present study averaged 1.57, which was much lower than that (3.50) in dairy cows reported by Yan et al. (Reference Yan, Mayne and Porter2005). This would result in longer rumen retention with beef cattle; the longer the digesta remained in the rumen, the greater is rate of CH4 generated by the rumen bacteria.
Methane emission as a proportion of DMI ranged from 18 to 48 l/kg with beef cattle in the present study. This range is comparable to that (20 to 43 l/kg DMI) with dairy cows (Yan et al., Reference Yan, Mayne and Porter2005). This large variation presents a great opportunity for beef and dairy industries to develop mitigation strategies to reduce CH4 emission in the battle against global warming. A number of dietary and animal factors have been found to influence CH4 emission in dairy cows (Moss et al., Reference Moss, Jouany and Newbold2000; Yan et al., Reference Yan, Mayne and Porter2005). The most important single factor is level of animal productivity. For example, Yan et al. (Reference Yan, Mayne and Porter2005) found that CH4 emission per kg milk yield with dairy cows reduced curvilinearly with increase in milk yield. However, growth rates of beef cattle could not be accurately measured during the CH4 emission measurement period (3 days) in the present study. Nevertheless, feeding level may be used as indicator of growth rate of beef cattle. In the present study feeding level ranged from 1.00 to 2.55 when ME requirement for maintenance was calculated from AFRC (1993). There was a negative relationship between feeding level and CH4/DMI (P < 0.05) or CH4-E/GEI (P < 0.01). Therefore, for production of a given amount of product, increasing animal productivity can considerably reduce total amount of CH4 emission.
Manipulation of dietary factors is another effective approach to reduce CH4 emission in beef cattle. In the present study, there was a negative relationship between dietary ME concentration and CH4-E/GEI (P < 0.001) and between ME/GE and CH4/DMI or CH4-E/GEI (P < 0.01), while dietary forage proportion was positively related to CH4/DMI or CH4-E/GEI (P < 0.05). Ellis et al. (Reference Ellis, Kebreab, Odongo, McBride, Okine and France2007) found that increasing dietary forage proportion increased total CH4-E output of beef cattle when using DMI alone or DMI and NDF intake to predict total CH4-E output. The relationship between CH4/DMI and dietary ME concentration with dairy cows was quantified by Yan and Mayne (Reference Yan and Mayne2007). These authors found that the CH4/DMI ratio reduced by 0.829 l/kg with each increment in ME concentration of 1 MJ/kg DM, with a constant of 43.1 (R 2 = 0.46). The CH4/DMI ratio increased by 0.073 l/kg with each increment in dietary forage proportion by 1% on a DM basis (R 2 = 0.46). Increased dietary forage proportion results in greater production of acetic acid on the expense of propionic acid in the rumen and thereby higher CH4 emission. Using rumen fermentation data obtained in in vitro gas production technique, Moss et al. (Reference Moss, Jouany and Newbold2000) reported a negative linear relationship between CH4 production and the ratio of (acetic + butyric acid)/propionic acid. Therefore using concentrate diets is an effective approach to reduce CH4 production in cattle.
Validation of prediction equations published elsewhere
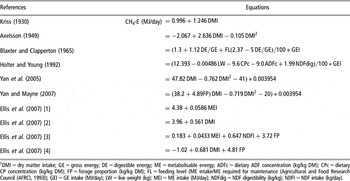
The present dataset (n = 108) was used to validate a range of prediction equations for CH4 production of non-lactating cattle, which are presented in Table 6. These equations were developed using CH4 production data based on beef cattle (Kriss, Reference Kriss1930; Axelsson, Reference Axelsson1949; Ellis et al., Reference Ellis, Kebreab, Odongo, McBride, Okine and France2007), beef cattle and sheep (Blaxter and Clapperton, Reference Blaxter and Clapperton1965), dry dairy cows (Holter and Young, Reference Holter and Young1992) or dry and lactating dairy cows (Yan et al., Reference Yan, Mayne and Porter2005; Yan and Mayne, Reference Yan and Mayne2007). The reason for selecting equations developed from dry cow data is that the majority of data on feed intake and CH4 emission of dry cows in studies of Holter and Young (Reference Holter and Young1992), Yan et al. (Reference Yan, Mayne and Porter2005) and Yan and Mayne (Reference Yan and Mayne2007) was within the range of data of beef cattle in the present study. The minimum DMI in the present study was 4.4 kg/day, which is close to that (4.6 kg/day) of Yan et al. (Reference Yan, Mayne and Porter2005) and Yan and Mayne (Reference Yan and Mayne2007) and only 1 kg/day lower than that of Holter and Young (Reference Holter and Young1992). Equations developed from lactating dairy cows were not selected, as feed intakes of lactating dairy cows are much higher than beef cattle.
Published equations selected for the present validationFootnote 1

1 DMI = dry matter intake; GE = gross energy; DE = digestible energy; ME = metabolisable energy; ADFc = dietary ADF concentration (kg/kg DM); CPc = dietary CP concentration (kg/kg DM); FP = forage proportion (kg/kg DM); FL = feeding level (ME intake/ME required for maintenance (Agricultural and Food Research Council (AFRC), 1993)); GEI = GE intake (MJ/day); LW = live weight (kg); MEI = ME intake (MJ/day); NDFdig = NDF digestibility (kg/kg); NDFI = NDF intake (kg/day).
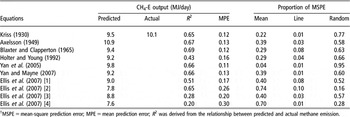
Results of the present validation are presented in Table 7. Methane energy output was over-predicted by Axelsson (Reference Axelsson1949), but otherwise under-predicted by all others. The mean bias (difference between predicted and actual data) was the lowest with Yan et al. (Reference Yan, Mayne and Porter2005) (0.3 MJ/day), followed by Kriss (Reference Kriss1930) (0.6), Blaxter and Clapperton (Reference Blaxter and Clapperton1965) (0.7), Axelsson (Reference Axelsson1949) (0.8), Holter and Young (Reference Holter and Young1992) and Yan and Mayne (Reference Yan and Mayne2007) (0.8), with the largest bias with Ellis et al. (Reference Ellis, Kebreab, Odongo, McBride, Okine and France2007) (1.1 to 2.5 MJ/day). The mean prediction error and R 2 in the relationship between predicted and actual CH4-E output followed a similar trend, i.e., best with Yan et al. (Reference Yan, Mayne and Porter2005) and worst with Ellis et al. (Reference Ellis, Kebreab, Odongo, McBride, Okine and France2007), although the R 2 was relatively high in equation (2) of Ellis et al. (Reference Ellis, Kebreab, Odongo, McBride, Okine and France2007) and relatively low with Holter and Young (Reference Holter and Young1992). Similar results were also found when the total error (MSPE) was separated into errors associated with mean bias, line bias and random variation. With Yan et al. (Reference Yan, Mayne and Porter2005), 95% of the error was derived from random variation, whilst with Ellis et al. (Reference Ellis, Kebreab, Odongo, McBride, Okine and France2007) only 16% to 57% of the error was attributed to random variation, with other equations between these two studies. The poor prediction accuracy of Ellis et al. (Reference Ellis, Kebreab, Odongo, McBride, Okine and France2007) could be attributed to the fact that some of their CH4 emission data were estimated from the sulphur hexafluoride tracer gas technique and hood calorimeters which cannot measure CH4 production in the hindgut lost through the anus. Furthermore, when using the sulphur hexafluoride tracer gas technique for grazing beef cattle, feed intake was estimated.
Validation of prediction equations for methane energy output developed elsewhere (Table 6) using the present dataset (n = 108)Footnote 1

1 MSPE = mean-square prediction error; MPE = mean prediction error; R 2 was derived from the relationship between predicted and actual methane emission.
Conclusion
A range of prediction equations for methane production of beef cattle have been developed in the present study using production data measured from indirect open-circuit respiration calorimeters. There were strong relationships between methane emission and animal and dietary factors when using LW with feeding level, DM intake or GE intake as the primary predictor, together with other dietary variables (e.g., energy digestibility and ME/GE). The internal evaluation of these multiple relationships indicated that they could be used to accurately predict methane output of beef cattle. The accurate prediction of methane emission is essential for beef industry to develop appropriate feeding and management strategies in the battle against global warming.
Acknowledgements
The authors wish to thank their colleagues for access to the data from the calorimetric experiments used in the present study. This study was funded by the Department of Agriculture and Rural Development of Northern Ireland.