Introduction
Agroecosystems are heterogeneous habitats as the result of intermingled crops and non-cultivated areas with their own particular ecosystem services, such as biological pest control (Kruess and Tscharntke, Reference Kruess and Tscharntke1994; Landis et al., Reference Landis, Wratten and Gurr2000; Tscharntke et al., Reference Tscharntke, Steffan-Dewenter, Kruess and Thies2002). The non-cultivated areas offer insects resting, mating, and overwintering sites (Holland and Fahrig, Reference Holland and Fahrig2000; Tscharntke et al., Reference Tscharntke, Steffan-Dewenter, Kruess and Thies2002; Olson et al., Reference Olson, Zeilinger, Prescott, Coffin, Ruberson and Andow2018), providing natural enemies of pest species with alternative resources (Duelli and Obrist, Reference Duelli and Obrist2003; Bianchi et al., Reference Bianchi, Booij and Tscharntke2006; Olson et al., Reference Olson, Zeilinger, Prescott, Coffin, Ruberson and Andow2018), and determining whether, when, and/or how, natural enemies survive and carry out crop pest control functions (Landis et al., Reference Landis, Wratten and Gurr2000; Duelli and Obrist, Reference Duelli and Obrist2003; Bianchi et al., Reference Bianchi, Booij and Tscharntke2006).
Exploitation competition implies an indirect effect between individuals and depends on the presence of individuals of an intermediate species, and if predominantly asymmetric (limited resources are divided up unequally), it can lead to displacement of a formerly established species and even its complete exclusion (Reitz and Trumble, Reference Reitz and Trumble2002; Roberts and Stone, Reference Roberts and Stone2004), thus, being of great importance in structuring ecological communities (Strauss, Reference Strauss1991; Wootton, Reference Wootton1994; Menge, Reference Menge1995). A typical case of exploitation competition is when one parasitoid species attacks a different life stage of the same host species attacked by another parasitoid species, thus diminishing the potential number of hosts available to the latter, and may displace it from the system (Luck and Podoler, Reference Luck and Podoler1985; Murdoch and Briggs, Reference Murdoch and Briggs1996).
By the mid-1970s soybean was an important crop in Argentina, affected by several pest species, including stink bugs (mainly Nezara viridula) that damaged soybean pods (Vicentini and Jiménez, Reference Vicentini and Jiménez1977; Gamundi, Reference Gamundi1985). N. viridula adults and older nymphs were successfully parasitized by the indigenous parasitoid Trichopoda giacomellii (Diptera: Tachinidae), and although the interaction became permanently established, this parasitoid was not able to keep an effective population control of N. viridula (Liljesthröm and Avalos, Reference Liljesthröm and Avalos2015). At the beginning of the 1980s, different Australian strains of Trissolcus basalis (Hymenoptera: Scelionidae) were introduced into Argentina, and spontaneous parasitism of N. viridula eggs by T. basalis was observed in the field (La Porta and Crouzel, Reference La Porta and Crouzel1984). Since then, N. viridula has persisted most of the time at or below the economic damage threshold level determined by Bimboni (Reference Bimboni1985): two adults per lineal meter of soybean (Gamundi, Reference Gamundi1985; Bercellini and Malacalza, Reference Bercellini and Malacalza1993; Liljesthröm and Coviella, Reference Liljesthröm and Coviella1999; Masoni and Frana, Reference Masoni, Frana, Trumper and Edelstein2008). In many areas of Argentina where soybean is cultivated, there are tree plantations (mainly Eucalyptus spp.) and non-cultivated areas mostly covered by natural herbaceous vegetation. N. viridula uses the trees of Eucalyptus plantations only for overwintering, and the non-cultivated areas with natural vegetation as feeding and/or reproducing habitats (Molinari and Gamundi, Reference Molinari and Gamundi1993). There are no studies of the dynamics of these two natural enemies of N. viridula (T. basalis and T. giacomellii) in non-crop habitats, which are crucial for understanding the success of biological control programs.
We developed a simulation model of the system N. viridula–T. basalis–T. giacomellii, based upon field information from Argentina (Liljesthröm and Bernstein, Reference Liljesthröm and Bernstein1990; Liljesthröm and Rabinovich, Reference Liljesthröm and Rabinovich2004; Liljesthröm et al., Reference Liljesthröm, Cingolani and Rabinovich2013) to understand the interaction among the two parasitoids and its effect on biological control of N. viridula in Argentina. Although some classical theoretical models such as the Nicholson and Bailey (Reference Nicholson and Bailey1935) model seem well suited to describe the dynamics at a local scale, and are able to represent patchy populations (Hassell, Reference Hassell2000 and references therein), they do not consider the age- or stage-structure of the species involved. So, we decided to model the N. viridula–T. basalis–T. giacomellii system based upon the age-structure and/or stage-structure of N. viridula and its two parasitoids, thus incorporating a substantial degree of biological realism to better understand the intra- and interspecific interactions (Fagan et al., Reference Fagan, Bewick, Cantrell, Cosner, Varassin and Inouye2014; Bewick et al., Reference Bewick, Cantrell, Cosner and Fagan2016). We also combined those interactions with a degree-day model (Bewick, Reference Bewick2016) affecting development time of T. giacomellii pupae and T. basalis pre-imaginal stages. In the simulation model we represented implicitly patches of unmanaged areas with spontaneous vegetation (no explicit spatial dynamics was modeled), which are of importance by providing resources for feeding and oviposition for all the generations of N. viridula, and of the parasitoids that develop from spring to early autumn (hereafter called ‘activity period’).
We used the simulation model to answer the following questions: (1) if the effects of both parasitoid species acting simultaneously on their host enable the persistence of the system at low stink bug densities, (2) the impact that each parasitoid species by itself (i.e., only T. basalis or only T. giacomellii) has on the dynamics of the three species, and (3) if there is an indirect competition between both parasitoid species. Before explaining our methodology, we summarize below the basic biology of the three species, although more details can be found in Kiritani and Hokyo (Reference Kiritani and Hokyo1962), Todd (Reference Todd1989), Field et al. (Reference Field, Keller and Calbert1997), Liljesthröm and Bernstein (Reference Liljesthröm and Bernstein1990), and Liljesthröm and Rabinovich (Reference Liljesthröm and Rabinovich2004) and references therein.
Biology of N. viridula and its parasitoids
The life cycle of N. viridula includes an egg stage, five nymphal instars, and the adult stage, with a 1:1 sex ratio. Each female lays on average of five egg masses per lifetime, with an average of 75 eggs per egg mass (Liljesthröm and Rabinovich, Reference Liljesthröm and Rabinovich2004). From mid-October to mid-April (spring and summer) the stink bug goes through three non-overlapping generations, and at the end of an activity period healthy and parasitized N. viridula adults from the third generation leave the feeding and reproduction grounds and search for shelter to overwinter. Oviposition by N. viridula is a continuous process, with two oviposition peaks corresponding to each adult population peak, with the first (post-hibernating peak), taking place in weeks 2–3 of the activity period, and the second and dominant peak taking place in weeks 11–14 of the activity period (Liljesthröm et al., Reference Liljesthröm, Cingolani and Rabinovich2013).
The life cycle of T. basalis includes an egg stage, three larval instars, a pupal stage, and an adult stage (with only one adult developing per host egg). The adult is free-living but all pre-imaginal stages develop inside the host's eggs. The development of the pre-imaginal stages of T. basalis lasts about 2 weeks (Corrêa Ferrira, Reference Corrêa- Ferreira1993; La Porta and Crouzel, Reference La Porta and Crouzel1994) and mean adult longevity is around 8 weeks (Powell and Shepard, Reference Powell and Shepard1982; Jones and Westcott, Reference Jones and Westcott2002). Adult females are able to mate and lay eggs the same day of emergence (Jervis and Copland, Reference Jervis, Copland, Jervis and Kidd1996; Field, Reference Field1998), and total lifetime fecundity ranges from 89 (Powell and Shepard, Reference Powell and Shepard1982) to 184 eggs per female (Catalán and Verdú Gallardo, Reference Catalán and Verdú Gallardo2005). Density of T. basalis adults shows two clear peaks: a small one during weeks 5–7 and a dominant one in weeks 14–18, with a clear delay with respect to the adult host's highest peak (Liljesthröm et al., Reference Liljesthröm, Cingolani and Rabinovich2013).
T. giacomellii is a Neotropical Phasiinae, with a life cycle that includes an egg stage (eggs are laid on the surface of the host's body), three larval instars that develop inside the host (with only one larva completing development per host), the mature larva emerges from the host and then pupates (buried into the ground), and a free-living adult stage, with a 1:1 sex ratio (Liljesthröm, Reference Liljesthröm1993). The egg and larval instars last about 2.5 weeks, the pupae complete development in 2 weeks, and adult longevity is 1.5 weeks (Coombs, Reference Coombs1997); 4–6 overlapping generations of T. giacomellii may occur during an activity period.
Winter is a sort of reset mechanism that redistributes all three species populations by altering their age structure and reducing the population densities (Liljesthröm and Coviella, Reference Liljesthröm and Coviella1999). In Argentina N. viridula adults overwinter mainly under the bark of Eucalyptus spp. plantations, inside houses, and field sheds (Antonino et al., Reference Antonino, La Porta and Avalos1996). T. giacomellii spends the winter as larvae inside wintering parasitized adult hosts, although a smaller proportion survives buried as pupae in habitats where N. viridula had been feeding (Liljesthröm, Reference Liljesthröm1997). T. basalis spends the winter only in the adult stage in dry pastures, fallow of summer crops, or in any other protected sites (Clausen, Reference Clausen1978), and adults seem to have a low active dispersal capacity.
In Spring N. viridula adults recolonize feeding and/or reproduction habitats carrying with them the T. giacomellii larvae which will emerge as adults about 2—3 weeks later. A few T. basalis adults survive winter in the same habitats recolonized by the reproducing N. viridula adults. These changes in the population of the three species affect the dynamics of the interaction: in spring, due to low spatial or temporal coincidence between N. viridula and its parasitoids, N. viridula shows a significant lower parasitism and exhibits the highest population rate of increase (Liljesthröm and Bernstein, Reference Liljesthröm and Bernstein1990; Liljesthröm and Rabinovich, Reference Liljesthröm and Rabinovich2004).
Methods
Field data
The study areas were located in Berisso and La Plata counties, Argentina (34°35′S, 57°17′W), and were composed of a weedy area (dominated by Ricinus communis, Brassica sp., Raphanus sp., Bromus unioloides and other grass species), and an adjacent 2 ha experimental soybean plot, planted in mid-November each year.
Sampling was carried out for five consecutive activity periods. In the first three activity periods 30 square sampling units (1 m2 each) were randomly distributed in a 450 m2 plot selected as representative of the spontaneous vegetation area. In each sampling square, the total number of fourth- and fifth-instar nymphs, adults (discriminated by sex), and mating couples of N. viridula was counted, as well as the number of parasitized individuals and the number of T. giacomellii eggs per individual. The proportion of parasitized N. viridula eggs was also estimated at approximately weekly intervals using 20–25 sentinel egg masses (24–48 h old) obtained in the laboratory that were individually glued on pieces of paper (Meats and Castillo Pando, Reference Meats and Castillo Pando2002). They were fixed at random on the underside of leaves of Ipomoea purpurea (Convolvulaceae) and Malva sp. (Malvaceae), where N. viridula natural oviposition was observed to occur. Egg masses were left for 5–6 days (the average hatching time) and taken back to the laboratory where they were kept in test tubes at 25 ± 1°C and 70 ± 10% RH until the hosts or the parasitoids emerged. The number of healthy, parasitized, predated, and infertile eggs per egg mass were recorded, and then the proportion of parasitized eggs was estimated as the number of parasitized eggs/the number of healthy plus parasitized eggs. Additionally, 20 square sampling units (0.5 m2 each) were randomly distributed on the ground at the beginning of the activity period, and surveyed every 2 days to collect dead N. viridula adults, in order to estimate N. viridula generation mortality (Liljesthröm and Bernstein, Reference Liljesthröm and Bernstein1990), development time of T. giacomellii pupae, and time of emergence of adults (Liljesthröm and Rabinovich, Reference Liljesthröm and Rabinovich2004). N. viridula egg density was estimated as the weekly egg production of an average female multiplied by the density of adult females, and the mortality of N. viridula first- to third-instar nymphs was estimated as the difference between the number of emerged first-instar nymphs of N. viridula (i.e., the number of healthy eggs) and the number of fourth-instar nymphs. This mortality of young instar nymphs was identified as the key factor affecting the N. viridula population dynamics (Liljesthröm and Bernstein, Reference Liljesthröm and Bernstein1990).
In the last two activity periods only the density of eggs and adults of N. viridula, egg parasitism by T. basalis as well as the number of T. basalis adults per trap were estimated. The latter was estimated directly using 6–10 yellow cylindrical water traps, with a surface of 0.05 m2 and 10 cm deep, uniformly spaced about 10 m apart along one main diagonal of the spontaneous vegetation area; the traps were checked every 2–3 days and all insects were removed and collected in individual vials and sex ratio was determined. We converted the number of T. basalis adults/trap collected in a given interval to the same units as the N. viridula egg density: number of T. basalis adults m−2 (symbolized P) as P = cP T, with c = [1/n ∑tP Ct]/[1/n∑t P T], where n represents the number of samples in the activity period, P C the calculated number of T. basalis adults m−2 present in each sampling assuming no emigration or immigration (obtained from N. viridula egg density and the estimated proportion parasitized by T. basalis), and P T the number of T. basalis/trap collected in the interval. Additional sampling details can be found in Liljesthröm and Bernstein (Reference Liljesthröm and Bernstein1990) and Liljesthröm et al. (Reference Liljesthröm, Cingolani and Rabinovich2013). Parasitism by T. giacomellii as well as mortality of first- to third-instar nymphs of N. viridula in the last two activity periods were not available, so data from these activity periods were not used in model validation. However, sampling data allowed us to estimate the numerical and functional responses of T. basalis, adult sex ratio and pre-imaginal survivorship (Liljesthröm et al., Reference Liljesthröm, Cingolani and Rabinovich2013) that were used in model construction (see below).
Model
General information
The present model was based upon the simulation model developed by Liljesthröm and Rabinovich (Reference Liljesthröm and Rabinovich2004) which considered three main mortality factors affecting N. viridula: (a) parasitism of eggs by T. basalis, (b) a density-independent mortality factor (composed by predation of young nymphs by generalist predators and heavy rains) (Liljesthröm and Bernstein, Reference Liljesthröm and Bernstein1990), and (c) parasitism of older nymphs and adults by T. giacomellii. In Liljesthröm and Rabinovich (Reference Liljesthröm and Rabinovich2004) only parasitism by T. giacomellii was modeled dynamically, while parasitism of N. viridula eggs by T. basalis as well as predation of young N. viridula nymphs were introduced as simple coefficients affecting the generation survivorship of eggs and of first- to third-instar nymphs of N. viridula, respectively.
The present model extends the Liljesthröm and Rabinovich (Reference Liljesthröm and Rabinovich2004) model to include dynamically the interaction between N. viridula and T. basalis. Structurally the present model has four transition age-structured population matrices: one for T. giacomellii, two matrices (one for each sex) for N. viridula, and one matrix for T. basalis (fig. 1). In the N. viridula–T. giacomellii interaction the weekly per capita number of eggs laid by a T. giacomellii female was based on a regression equation that estimated the density of eggs deposited by T. giacomellii based on the density of older nymphs and adults of N. viridula (Liljesthröm, Reference Liljesthröm1992), which leads to a threshold host density of 0.15 individuals m−2. We used a negative binomial distribution to describe the distribution of eggs by T. giacomellii among hosts which was identified as the main population regulating factor (Liljesthröm and Rabinovich, Reference Liljesthröm and Rabinovich2004).
Schematic representation of the model of the N. viridula–T. giacomellii–T. basalis system. Boxes represent developmental stages/ages of each species. For T. basalis eggs + pupae represent the pre-imaginal stages that develop within the host eggs. For N. viridula the fourth and fifth instars, and 1–24-week-old adults are identified separately, because they are the stages/ages that are parasitized by T. giacomellii. For T. giacomellii eggs + larvae represent the pre-imaginal stages that develop inside N. viridula while pupae represent the parasitoids in the pupal stage buried in the soil. Dashed lines represent the attack rate of both adult parasitoid species; the thick dotted lines represent the parasitoid's pre-imaginal stages that develop inside N. viridula eggs (the parasitoid's eggs, larvae and pupae in the case of T. basalis) and N. viridula fourth- and fifth-instar nymphs and adults (the parasitoid's eggs and larvae in the case of T. giacomellii). Thin dotted lines represent survival S(x) between successive developmental stages or between successive ages of the adult stage, while the two thick arrows represent the effect of temperature on development of T. basalis and T. giacomellii.

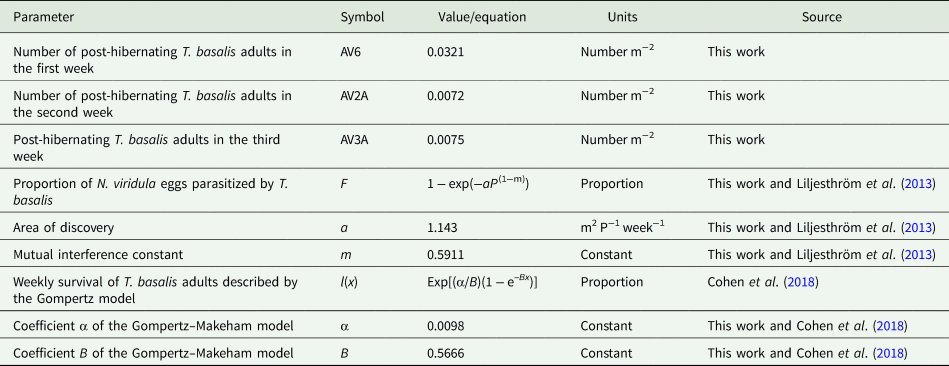
In the N. viridula–T. basalis interaction the proportion of N. viridula eggs parasitized by T. basalis (F) (the functional response) was based on the Hassell and Varley (Reference Hassell and Varley1969) model which has two coefficients: the attack rate and the coefficient of interference (table 1). For values of the coefficient of interference similar to the one estimated in this model, the only value for no parasitism happens either when no T. basalis females or no N. viridula eggs are present. Temperature-dependent pre-imaginal development of T. basalis, D (t), was calculated (using the average weekly temperature values of the same days of sampling), following Liljesthröm et al. (Reference Liljesthröm, Cingolani and Rabinovich2013) and development was accumulated until the pre-adult development time (expressed in weeks) was completed, and the emergence of the new adult (T. basalis of age j = 1) was assigned t weeks later if D (t) = 1, or if 1 − D (t) < D (t+1). The survival of T. basalis adults from age j to age j + 1 (in weekly units) was estimated from data by Jones and Westcott (Reference Jones and Westcott2002) and described by the Gompertz model (Witten and Satzer, Reference Witten and Satzer1992; Cohen et al., Reference Cohen, Bohk-Ewald and Rau2018). This age-specific survival model has two parameters, one representing the age-independent mortality rate, and the other regulating the intensity of the increase in mortality with age (table 1).
Field/laboratory parameter estimates (or their equations) for T. basalis

The parameter values of N. viridula, and of T. giacomellii were the same as those used in the Liljesthröm and Rabinovich (Reference Liljesthröm and Rabinovich2004) model.
We used as a reference density value of N. viridula the economic damage threshold level (ETL) estimated by Bimboni (Reference Bimboni1985) of ETL = 2 N. viridula adults/soybean lineal meter; considering an average separation between furrows for those years in Argentinean soybean crops it represents an ETL of 2.9 N. viridula adults m−2.
The model was programmed in simulation software Glimso (Hasperué and Rabinovich, Reference Hasperué and Rabinovich2014).
The general features of this model can be summarized as follows: the model is a discrete time, deterministic, phenomenological, spatially homogeneous, and age- and stage-structured simulation model, with a 1-week time interval; it assumes complete remixing of the host and parasitoid populations in each generation, making it best suited in describing the dynamics on a local scale, and representing patchy populations (Hassell, Reference Hassell2000). The number of individuals of different ages were grouped into stages when necessary. Male and female N. viridula dynamics were followed separately because of T. giacomellii's parasitism selectivity toward adult males.
The interactions N. viridula–T. giacomellii and N. viridula–T. basalis were described in detail in Liljesthröm and Rabinovich (Reference Liljesthröm and Rabinovich2004) and in Liljesthröm et al. (Reference Liljesthröm, Cingolani and Rabinovich2013), respectively, and a detailed description of both is presented in the Supplementary material 1.
Parameterization
We had three consecutive activity periods (of 26 weeks each) of field data; the first two activity periods of data were used for parameterization (i.e., the estimation of the model's parameter values and initial conditions), while the third activity period was used for validation of the model. The following five parameters of the N. viridula–T. basalis sub-model were selected for parameterization because they were strongly related to the parasitoid–host interaction: (1) the initial density of T. basalis adults (those that immigrated in the first 3 weeks of an activity period), (2) the coefficients α and β of the Gompertz model used to estimate the weekly survivorship of T. basalis adults, and (3) the coefficients of the functional response of T. basalis modeled following Hassell and Varley (Reference Hassell and Varley1969): the per capita attack rate, Q, and the mutual interference constant between adult parasitoids, m (table 1). The values of the other parameters related to the N. viridula–T. giacomellii sub-model were not modified from those used in the Liljesthröm and Rabinovich (Reference Liljesthröm and Rabinovich2004) model.
Parameterization was carried out by applying a search method developed in simulation software Glimso (Hasperué and Rabinovich, Reference Hasperué and Rabinovich2014), based upon the particle swarm optimization (PSO) procedure that uses a cluster of particles (each particle represents a set of values for the model parameters and a possible solution to the model fitting). PSO is moved throughout the search space, always retaining the best solution found, which corresponds to the values of the parameters that produce an output as closest as possible to the ‘field data’; measures of the Fisher information matrix, that provide the amount of information that our variables in the model carry about the parameters being estimated, could not be calculated because no likelihood function was used to parameterize the model. Because of the tenfold difference in scale between the density of hosts and T. basalis adults and that of T. giacomellii adults, we selected as goodness-of-fit the normalized squared residuals x = (x obs − x exp)2 by means of $( x-\bar{x}) /s$ (i.e., we normalized the residual values using their mean and standard deviation, so that all variables have a comparable scale). The normalized sum of squares was applied to the following eight variables (the output of the model): density of N. viridula eggs, density of fourth- and fifth-instar N. viridula nymphs, and density of N. viridula adults (discriminated as healthy and parasitized by T. giacomellii), density of T. giacomellii and of T. basalis adults, and percentage parasitism of N. viridula eggs by T. basalis. Those eight normalized sums of squares were added up, and minimized by the PSO procedure. In order to check the goodness-of-fit of the parameters estimated by the PSO procedure as applied to the validation dataset (the third activity period of field data) we looked for a similar pattern between simulated and field data by means of different measures (see section ‘Validation’). We did not carry out an analysis of autocorrelation of residuals because, being the model a population dynamics model, where some values of the time series undoubtedly are expected to influence the values of the next point in the time series, it would not be surprising to find several adjacent residual values to be significantly correlated.
Validation
For validation we used the 26 weeks of field data of the third activity period, which was not used in the parameterization process. To estimate the goodness-of-fit in the validation process we evaluated ten different goodness-of-fit measures, and after comparing the pros and cons of each measure, we decided to use the root mean squared error (RMSE) as a goodness-of-fit measure between field data and the simulation model. RMSE is one of the commonly used error index statistics (Lin and Myers, Reference Lin and Myers2006; Nayak et al., Reference Nayak, Rao and Sudheer2006) and is defined as:

where Q f are the simulated values, Q 0 are the observed values, n is the number of observations, and i identifies each observation. In R this measure of goodness-of-fit is available in packages ie2misc and Metrics. The RMSE statistic provides information about the short-term performance of a model by allowing a term-by-term comparison of the actual difference between the estimated and the measured value. The smaller the RMSE value, the better the model's performance. We are aware that there are two drawbacks of this test: (i) that a few large errors in the sum may produce a significant increase in RMSE, and (ii) that the test does not differentiate between underestimation and overestimation. There is no probabilistic value associated with RMSE to determine if the similarity between observed and simulated values is statistically significant. As a proxy, we also included in the graphical results the 95% confidence intervals of the field sampled values to help the reader to judge the goodness-of-fit of the model based on the general behavior in time of each simulated species/stage.
Despite the apparent good performance of the model as shown in its graphical form (see fig. 2 in the ‘Results’ section), we carried out a time series analysis using the tseries library in R. The turns function provides a series of tools to identify the peaks and the pits of a time series, together with their position in the time series. In general the coincidence between the observed and modeled peaks is quite good (results not shown), although the modeled peaks tends to slightly lag behind the observed peaks in the last half of the simulated periods. Additionally, we verified that a linear regression between the observed and modeled time series was statistically significant (Pr(>|t|) < 2 × 10⁻¹⁶).
Observed and simulated time series of the N. viridula–T. giacomellii–T. basalis system. Populations represent densities in individuals m−2. N. viridula parasitized eggs are given as percentage. All simulations were carried out for 78 weeks (representing three activity periods of 26 weeks each), using the T. basalis parameter values of table 1. The observed density was estimated from 30 square units (1 m2 each), randomly distributed at approximately weekly intervals, and the vertical dotted line separates the weeks used to parameterize and those used to validate the model.

‘Generic’ version of the model for scenarios of interest
After parameterization and validation were completed, and in order to analyze some particular scenarios of interest, we modified the model in order to represent an ‘average’ year, called hereafter the ‘generic’ model; in this ‘generic’ model the following variables, functions, and parameters were kept fixed at their mean values: temperature (using a mean seasonal temperature), the survivorship parameters of N. viridula nymphs, and the proportion of adults of N. viridula, of T. basalis, and of immature stages of T. giacomellii that resume activity after winter.
Three scenarios were simulated using this ‘generic’ version of the model: (i) only T. giacomellii interacts with N. viridula; (ii) only T. basalis interacts with N. viridula; and (iii) both T. giacomellii and T. basalis interact with N. viridula; in those three scenarios we looked at the dynamics of the three species, which allows the examination of the effects of each parasitoid species on N. viridula individually, as well as the indirect competition between both parasitoid species in the full three-species system.
To detect the possibility of an exploitation competition process between both parasitoids for its host we also simulated with the ‘generic’ model one activity period (26 weeks), for four increasing initial densities of T. giacomellii (0.5; 1; 1.5; and 2 individuals m−2), while leaving fixed the initial density of T. basalis, and similarly for four initial densities of T. basalis (0.025; 0.05; 0.075; and 0.1 individuals m−2), while leaving fixed the initial density of T. giacomellii (i.e., 16 simulation combinations). The initial densities were selected because they are similar to the initial densities usually estimated in the field, and the four initial densities of each parasitoid were allowed to vary randomly in an interval whose limits were 50% of their initial value (supported from field data), and ten replicates were carried out for each one of the 16 combinations. With the results of those simulations, we carried out a correlation analysis of the initial density of one parasitoid species with the 26-week mean density of the other parasitoid species. This procedure makes it possible to explore a possible exploitation competition between the two parasitoid species as the cause of the extinction of one of them; additionally, we checked if the density of N. viridula reached values below which parasitism by T. giacomellii could not occur (i.e., a N. viridula threshold density).
Results
Model parameterization and validation
The estimated values of the parameters of T. basalis that were subjected to parameterization are shown in table 1.
The time series of the observed and simulated values for the three activity periods (the third activity period corresponds to the observed dataset used for validation) are shown in fig. 2 for the eight state variables used in the model: density of eggs, fourth- and fifth-instar nymphs and adults of N. viridula, adults of T. basalis and T. giacomellii, as well as percentage egg parasitism by T. basalis, and N. viridula adult parasitism by T. giacomellii.
The detailed validation results as applied to the third activity period, as well as their bounds or significant scales are available in Supplementary material 2.
Effects of both parasitoid species present
If both parasitoids are present, the simulated density of N. viridula adults during an activity period was consistent with field data (fig. 2); however, if both parasitoids were absent the model shows an exponential increase in density of the N. viridula population, indicating that only predation of young instar nymphs cannot regulate the N. viridula population (figure not shown).
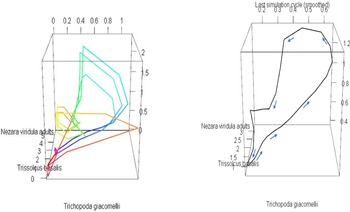
When densities of both parasitoids and of N. viridula host are represented in a phase diagram (fig. 3) a spiral emerges because the peak densities of both parasitoid species are asynchronous, copying approximately the asynchronous peaks of their respective resources: density of N. viridula eggs (for T. basalis), and density of N. viridula adults (for T. giacomellii) approximately 2 weeks later (fig. 3).
Phase diagrams of densities of both parasitoid species and their host along a simulated activity period using the ‘generic’ model. T. basalis is represented on the X axis, T. giacomellii on the Y axis, and N. viridula adults on the Z axis. Left graph: Colors along the lines represent the weekly time succession of an activity period (following approximately the sequence: red → orange → yellow → green → cyan → blue → magenta). Right graph: Same as left graph but for only the last simulated cycle after a simulation of the generic model for 1000 weeks after smoothing, as an estimate of the ‘limit cycle’ of the N. viridula–T. giacomellii–T. basalis system; the arrows indicate the direction of the weekly time sequence.

Impact of a single parasitoid species on the dynamics of the model
If only T. basalis is present the only mortality factors affecting N. viridula population are the predation of young instar nymphs by generalist predators (which was a constant key factor in the simulation model, Liljesthröm and Rabinovich, Reference Liljesthröm and Rabinovich2004) and parasitism of eggs by T. basalis. In this case the mean N. viridula adult density is 5.1 adults m−2 (SD = 3.8; N = 130) significantly higher (t (258 df) = 4.93; P = 0.0000007; one-tail test) than the average N. viridula adult density (1.6 adults m−2) when both parasitoids are present.
When only T. giacomellii is present, the only mortality factor affecting N. viridula population (in addition to the predation of young instar nymphs by generalist predators) is the parasitism of older nymphal instars and adults of N. viridula by T. giacomellii. This two-species system was regulated by means of the aggregated distribution of attacks of T. giacomellii among hosts and its mean N. viridula adult density was 4.4 adults m−2 (SD = 4.02; N = 130), significantly higher than 1.6 N. viridula adults m−2, when both parasitoids were present (t (258 df) = 3.33; P = 0.00049; one-tail test). The difference in mean adult densities of N. viridula when only one parasitoid acted did not differ statistically (t (129 df) = 0.8357; P < 0.1).
Indirect competition between the two parasitoid species
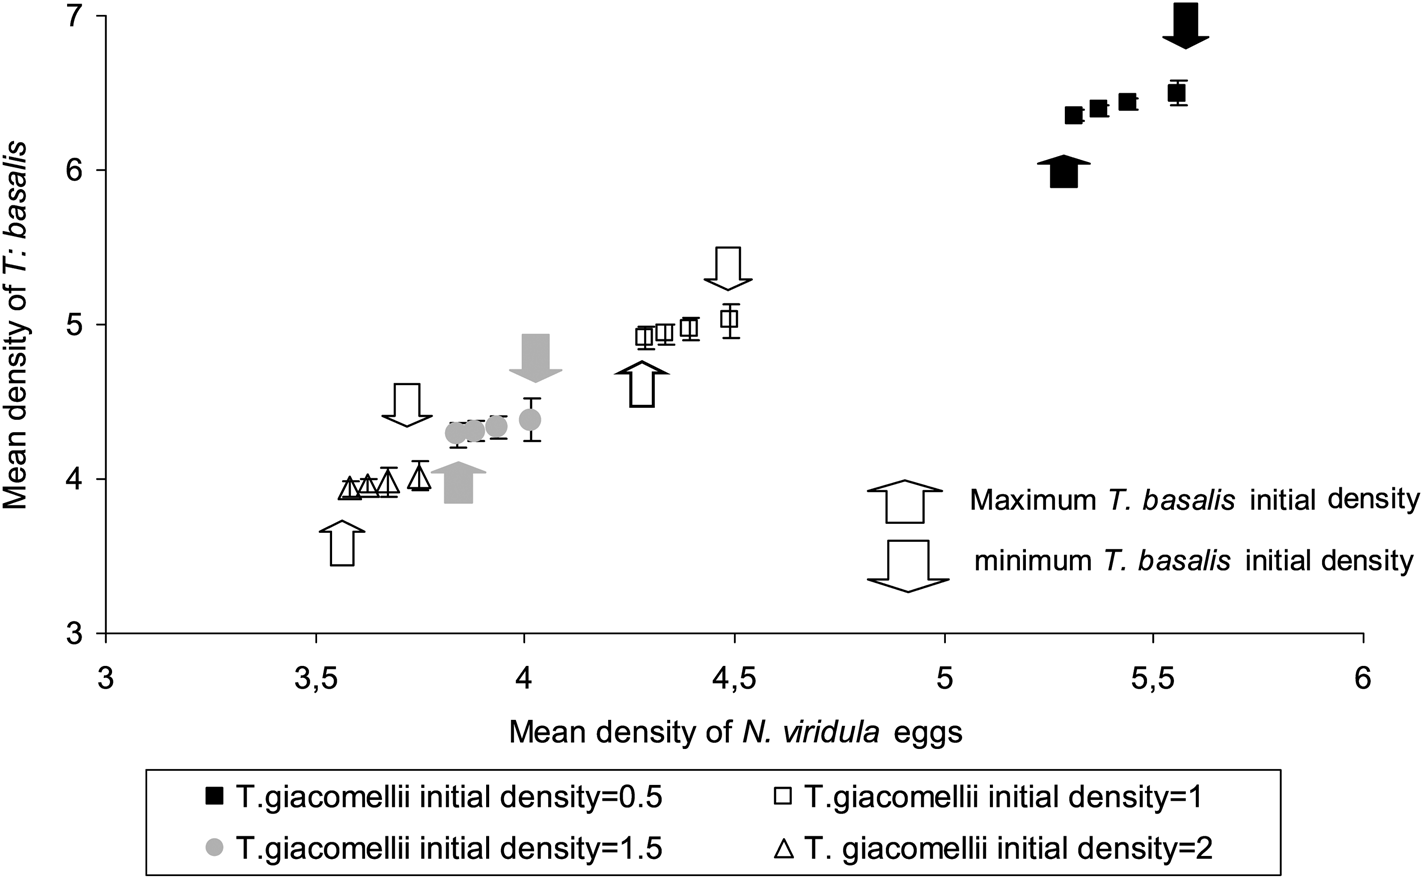
When the initial density of one parasitoid was increased, the mean density of the other parasitoid, as well as the mean density of its resource (N. viridula), decreased. Figure 4 shows the effects of four increasing initial densities of T. giacomellii on the mean density of T. basalis, as well as on the mean density of its resource, the eggs of N. viridula. The set of points representing the mean densities of T. basalis (in the ordinate) are significantly correlated with the mean densities of their resources (in the abscissa) (r = 0.9979, t (14 df) = 57.628, P < 0.0000001) and the functional relationship expressed by the regression equation: y = 1.3786x − 1.0671 (F (1, 14) = 3320.947; P = 4.822×10⁻¹⁸).
Effects of exploitation competition between two parasitoids attacking different stages of the same host: there is a reduction in the average density of T. basalis and of its resource (eggs of N. viridula) as the initial density of T. giacomellii increased from 0.5 m−2 (black squares) to 2 m−2 (open triangles). In turn, the arrows indicate the effect of the initial density of T. basalis: the lower its initial density (descending arrows), the higher the mean density of T. basalis and of its average resource.

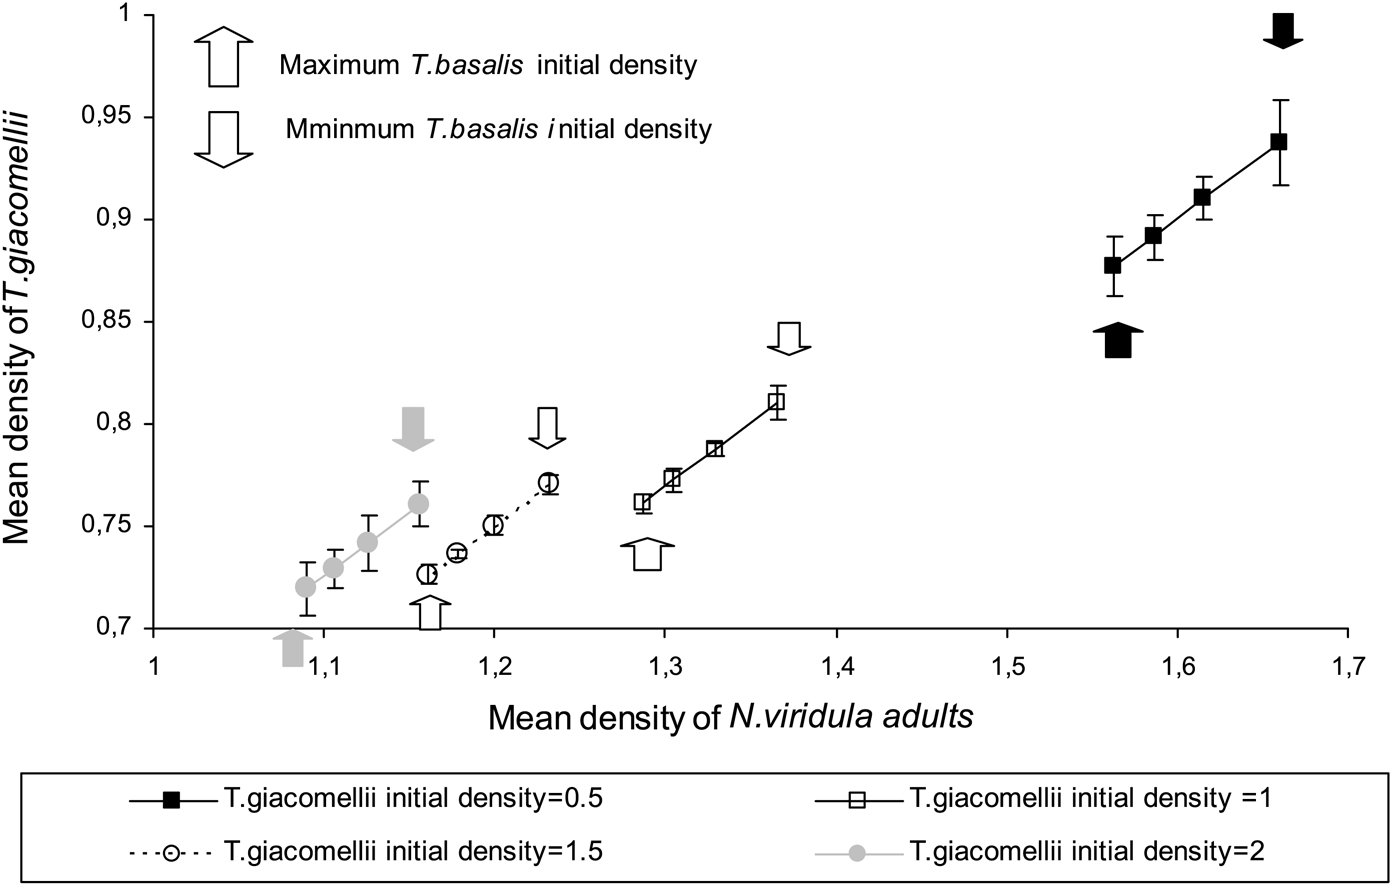
Figure 5 shows the effects of four increasing initial densities of T. basalis on the mean density of T. giacomellii, as well as on the mean density of its resource (adults of N. viridula). As before, the set of points representing the mean densities of T. giacomellii (in the ordinate) are significantly correlated with the mean densities of N. viridula adults (in the abscissa) (r = 0.9822, t (14 df) = 19.583, P < 0.0000001) and the functional relationship expressed by the regression equation: y = 0.3606x − 0.3202 (F (1, 14) = 383.51; P = 1.430 × 10⁻¹¹).
Effects of exploitation competition between two parasitoids attacking different stages of the same host: the reduction in the average density of T. giacomellii and of its resource (adults of N. viridula) as the initial density of T. basalis increased from 0.025 m−2 (black squares) to 0.1 m−2 (gray circles). The arrows indicate the effect of the initial density of T. basalis: the lower its initial density (descending arrows), the higher the mean density of T. giacomellii and of its average resource.

The model never exhibited the extinction of T. giacomellii or T. basalis.
Discussion
Classical biological control refers to the intentional introduction of an exotic biological control agent that has coevolved with a pest species for permanent establishment and long-term pest control to an area that the pest has invaded (Barratt et al., Reference Barratt, Howarth, Withers, Kean and Ridley2010).
N. viridula is an exotic species in the pampas region of Argentina and it was successfully parasitized by the indigenous parasitoid T. giacomellii; however, at the beginning of the 1980s it was necessary to introduce different strains of T. basalis from Australia for N. viridula's biological control. Since then, N. viridula has persisted most of the time at or below the economic damage threshold level (La Porta and Crouzel, Reference La Porta and Crouzel1984; Gamundi, Reference Gamundi1985; Bercellini and Malacalza, Reference Bercellini and Malacalza1993; Liljesthröm and Coviella, Reference Liljesthröm and Coviella1999; Masoni and Frana, Reference Masoni, Frana, Trumper and Edelstein2008).
Despite in our model only the parameters that describe the N. viridula–T. basalis interaction were subjected to parameterization, the simulated density fluctuations mimic satisfactorily the field data, and the parameterized initial T. basalis density as well as those of T. giacomellii and N. viridula were consistent with field data (table 1 and fig. 2). The credibility of our model relies upon three attributes: (1) the independence of the data used for validation, (2) a satisfactory number of data points (52 weeks for parameterization and 26 weeks for validation), and (3) a satisfactory goodness-of-fit between the simulated and field time series that included all stages and species. These attributes suggest that at least all critical interactions between N. viridula and its two parasitoid species were captured by the model. In this sense, the persistence of the interaction at low density of N. viridula can be explained by the two regulation factors included in our model: (i) the functional response of the parasitoids: the aggregate distribution of attacks among hosts by T. giacomellii (see Supplementary material 1), and (ii) the interference between T. basalis adults in the hosts' egg parasitization process (table 1). The aggregative distribution of attacks among hosts was well described by a negative binomial distribution whose coefficient of aggregation was consistent with theoretical models as a mechanism capable of regulating a two-species system (May, Reference May1978; Liljesthröm and Rabinovich, Reference Liljesthröm and Rabinovich2004). Furthermore, our generic model shows that when only T. giacomellii is present the system persists, although the average N. viridula density was much higher than the ETL, i.e., the host population was regulated but not (economically) controlled. These results are consistent with the field density values of N. viridula in soybean crops in Argentina: before the introduction of T. basalis, the density of N. viridula was above the ETL despite parasitism by T. giacomellii (Vicentini and Jiménez, Reference Vicentini and Jiménez1977; Gamundi, Reference Gamundi1985).
The interference between T. basalis adults can be explained by the agonistic encounters between females parasitizing simultaneously on the same host egg (Corrêa- Ferreira, Reference Corrêa- Ferreira1993; Meats and Castillo Pando, Reference Meats and Castillo Pando2002), and a preemptive behavior by solitary parasitoid females in order to prevent conspecific superparasitism (Field, Reference Field1998; Field and Calbert, Reference Field and Calbert1998). The parametrized value of the coefficient of aggregation was also consistent with theoretical models as a mechanism capable of regulating a two-species system (Hassell and Varley, Reference Hassell and Varley1969). Similarly, the generic model showed that, when only T. basalis is present, N. viridula persists although at a higher density than when both parasitoids are present. Efficient control strategies of N. viridula through releases of T. basalis, occurred in open field crops as well as in protected crops. In the latter case more frequent introductions of low number of parasitoids proved to be more efficient than a few introductions of a large population due to interference between adults of T. basalis (Gard et al., Reference Gard, Bout and Prisca2022 and references therein).
When both parasitoids are present our model shows that N. viridula remains at low density, well below ETL. However, if two parasitoids attack different stages of the same host species, and if one of them diminishes sufficiently the potential number of hosts available to the other, the latter may be displaced from the biological system (Luck and Podoler, Reference Luck and Podoler1985; Murdoch et al., Reference Murdoch, Briggs and Nisbet1996). In our model exploitation interspecific competition between T. basalis and T. giacomellii was demonstrated by comparing the mean densities of one of the parasitoid species when the other parasitoid species was present at different initial density. Despite this interaction, our model never exhibited the local extinction of T. giacomellii or T. basalis, and persistence of both parasitoids implies that the density of their resources should not be less than a threshold density below which no parasitism occurs. In the case of T. giacomellii, from the equation representing its functional response (Liljesthröm and Rabinovich, Reference Liljesthröm and Rabinovich2004), it follows that zero parasitism will occur if the density of older nymphs and adults of N. viridula is below a threshold value of 0.15 individuals m−2. If the density of N. viridula is kept below this density for several weeks T. giacomellii disappears, a situation that was not observed neither in the field nor in our simulations. This result can be explained based on two characteristics of T. giacomellii: the adult is a vigorous flier capable of significant displacements and of detecting and orienting itself toward adults of N. viridula by pheromones emitted by the male hosts that act as kairomones (Harris and Todd, Reference Harris and Todd1980; Aldrich et al., Reference Aldrich, Lusby, Marron, Nicolau, Hoffman and Wilson1989). This coincidence in space is reinforced by the displacement of recently parasitized hosts that, when dispersing, carry the parasitoid with them, albeit in pre-imaginary stages (eggs and larvae). Furthermore, field data show that 6–20% of the wintering hosts remain parasitized (Molinari and Gamundi, Reference Molinari and Gamundi1993). There could also be intraguild predation between T. basalis and chewing and piercing-sucking predators of N. viridula eggs (Morrison et al., Reference Morrison, Mathews and Leskey2016; Tillman et al., Reference Tillman, Toewsb, Blaauwc, Sialc, Cottrelld, Talamase, Buntinf, Josephf, Balusug, Fadamirog, Lahirih and Patelc2020). For example, in Hawaii and Australia intra-guild predation between generalist predators and T. basalis would explain the fact that total parasitism is low, despite the fact that the number of egg masses available was high (Seymour and Sands, Reference Seymour, Sands, Corey, Dall and Milne1993; Jones, Reference Jones1995; Jones and Westcott, Reference Jones and Westcott2002).
Regarding T. basalis parasitism, we do not know the existence of thresholds in the density of N. viridula eggs for effective parasitism. Adults of T. basalis exhibit much greater potential longevity than T. giacomellii and on the spatial microscale T. basalis can follow odorous tracks of N. viridula induced by feeding and oviposition activity (Colazza et al., Reference Colazza, Sucarino, Peri, Salerno, Conti and Bin2004). However, T. basalis seems to have a low active dispersal capacity in search of egg masses in a habitat with very low host density, as well as searching in other habitats with higher density of hosts. A study of T. basalis adult female dispersal in the field estimated that maximum wasp dispersal was 75 m in a 2-week interval (Wright and Diez, Reference Wright and Diez2011). Unlike the availability of a given host for T. giacomellii (the longevity of a non-parasitized N. viridula adult is several weeks), Powell and Shepard (Reference Powell and Shepard1982) showed that an egg mass of N. viridula develops in a few days and that T. basalis pre-imaginal survivorship was higher than 90% when N. viridula eggs were less than 48 h old but much lower when older eggs were exposed to parasitism. However, even without eggs of N. viridula in the study area, T. basalis can also parasitize, in much less proportion, the eggs of other pentatomids such as Piezodorus guildinii (Cingolani et al., Reference Cingolani, Greco and Liljesthröm2014) increasing the probability of its persistence in the area.
The reset of the interaction between the modeled species imposed by winter could also prevent a further decrease of N. viridula density for both parasitoids. The effects of winter included in our model are related to the diapause induced in N. viridula by low temperatures, affecting the dynamics of the whole N. viridula–T. giacomellii–T. basalis system. The density and age-structure of the populations at the end of the activity period (before the onset of winter) differ from those that will restart activity in the following spring: N. viridula and T. basalis populations are composed only by adults, while T. giacomellii is composed mainly by larvae and pupae which molt to the adult stage about 3–4 weeks later (Liljesthröm and Rabinovich, Reference Liljesthröm and Rabinovich2004). During these first weeks of spring the ratio N. viridula adults/T. giacomellii adults is much higher than that at the end of the activity period, mainly due to a low temporal coincidence between adults. T. basalis also hibernates in the adult stage but little is known on what happens to this parasitoid species in the field. Despite being capable of surviving several weeks if they do not parasitize a host egg (Powell and Shepard, Reference Powell and Shepard1982), the local populations of T. basalis show a low spatial coincidence with N. viridula, and the ratio N. viridula adults/T. basalis adults is much higher at the beginning than that at the end of the activity period, possibly due to the apparent limited dispersal capability of T. basalis. As a consequence, there is a marked increase in the density of the second generation of adults of N. viridula (Liljesthröm and Bernstein, Reference Liljesthröm and Bernstein1990; Liljesthröm and Rabinovich, Reference Liljesthröm and Rabinovich2004) which may have obscured the exploitation competition that we have demonstrated between both parasitoid species.
Apart from parasitism by T. giacomellii, a successful biological control program of N. viridula in Argentina led to the introduction of T. basalis. Coincidentally, an analysis of the current status of N. viridula in the Americas (Panizzi and Lucini, Reference Panizzi and Lucini2016) indicated that since the 1990s N. viridula has gradually declined in numbers, particularly in southern Brazil, Argentina, and Uruguay, where both T. basalis and T. giacomellii are present. Among five possible reasons proposed by Panizzi and Lucini (Reference Panizzi and Lucini2016) that would explain this decline, is the growing impact of several species of egg parasitoids and of other parasitoids and predators. Despite of differences in weather conditions and plant species composition that may determine abundance and voltinism in N. viridula (Kiritani, Reference Kiritani1964; Jones and Sullivan, Reference Jones and Sullivan1982; Panizzi and Meneguim, Reference Panizzi and Meneguim1989), the persistence of the interactions at low densities of N. viridula exhibits the robustness of the N. viridula–T. basalis–T. giacomellii interaction captured by our model.
Supplementary material
The supplementary material for this article can be found at https://doi.org/10.1017/S0007485322000591.
Conflict of interest
The authors declare none.