1. Introduction
The presence of bubbles is known to dramatically alter transport properties in a variety of natural and industrial flows (Clift, Grace & Weber Reference Clift, Grace and Weber2005; Balachandar & Eaton Reference Balachandar and Eaton2010). Perhaps the simplest, yet not very well understood, realisations of such a phenomenon are complex spatio-temporal flows (often referred to as pseudo-turbulence or bubble-induced agitation) generated by a dilute swarm of bubbles rising through an otherwise quiescent fluid (Lance & Bataille Reference Lance and Bataille1991; Prakash et al. Reference Prakash, Martínez Mercado, van Wijngaarden, Mancilla, Tagawa, Lohse and Sun2016; Risso Reference Risso2018; Mathai, Lohse & Sun Reference Mathai, Lohse and Sun2020; Ni Reference Ni2024). The wake flows, generated by individual bubbles in the swarm, agitate the ambient fluid and interact with each other to generate pseudo-turbulence.
The key dimensionless numbers that characterise pseudo-turbulence are the Galilei number
 ${Ga}=\sqrt {\rho _L (\rho _L-\rho _B)gD^3/\mu ^2}$
(the ratio of buoyancy to viscous forces), the Bond number
 ${Bo}=(\rho _L-\rho _B)g D^2/\sigma$
(the ratio of buoyancy to surface tension forces), where
 $\sigma$
is the surface tension coefficient and the Atwood number
 ${At}=(\rho _L-\rho _B)/(\rho _L+\rho _B)$
, where
 $\rho _L$
is the density of the liquid phase,
 $\rho _B$
is the density of bubble,
 $\mu$
is the viscosity of the liquid phase,
 $g$
is the gravitational acceleration and
 $D$
is the bubble diameter. Experiments on bubbly flows are typically conducted in the dilute regime, characterised by a bubble volume fraction
 $\phi \lt 2\,\%$
, where interactions between bubbles can be ignored. Furthermore, for experimentally relevant
 ${Ga}\lt 1000$
and
 ${Bo}\lt 3$
, the bubbles are roughly ellipsoidal and they do not undergo breakup.
Similar to classical turbulence, it is usual to characterise bubbly flows using the energy spectrum. Experimental and numerical studies at moderate
 ${Ga}\,(\lt 1000)$
and varying
 ${At}$
characterise pseudo-turbulence by a power-law scaling of the energy spectrum
 $E(k)\sim k^{-\beta }$
, where
 $k$
is the wavenumber,
 $E(k)$
is the energy contained in wavenumber
 $k$
, the exponent
 $\beta$
depends on
 ${Ga}$
and
 ${At}$
(Lance & Bataille Reference Lance and Bataille1991; Esmaeeli & Tryggvason Reference Esmaeeli and Tryggvason1998, Reference Esmaeeli and Tryggvason1999; Riboux, Risso & Legendre Reference Riboux, Risso and Legendre2010; Martinez Mercado et al. Reference Martinez Mercado, Chehata Gómez, Van Gils, Sun and Lohse2010; Prakash et al. Reference Prakash, Martínez Mercado, van Wijngaarden, Mancilla, Tagawa, Lohse and Sun2016; Pandey, Ramadugu & Perlekar Reference Pandey, Ramadugu and Perlekar2020; Innocenti et al. Reference Innocenti, Jaccod, Popinet and Chibbaro2021; Ma et al. Reference Ma, Hessenkemper, Lucas and Bragg2022; Pandey, Mitra & Perlekar Reference Pandey, Mitra and Perlekar2022; Ravisankar & Zenit Reference Ravisankar and Zenit2024). In a recent study, using high-resolution numerical simulations at large
 ${Ga}\,(\gt 1000)$
, Pandey, Mitra & Perlekar (Reference Pandey, Mitra and Perlekar2023) showed that Kolmogorov turbulence coexists with pseudo-turbulence. This has been experimentally corroborated by Ma et al. (Reference Ma, Tan, Ni, Hessenkemper and Bragg2025).
There are two salient features of incompressible, single-phase homogeneous and isotropic turbulence (Frisch Reference Frisch1995): power-law scaling of the energy spectrum
 $E(k)\sim k^{-5/3}$
, and the cascade of energy from large to small scales in the inertial range while maintaining constant energy flux. These are now well established by state-of-the-art numerical simulations and experiments (Ishihara et al. Reference Ishihara, Morishita, Yokokawa, Uno and Kaneda2016; Iyer, Sreenivasan & Yeung Reference Iyer, Sreenivasan and Yeung2020; Küchler et al. Reference Küchler, Bewley and Bodenschatz2023).
What are the mechanisms of inter-scale energy transfers in bubbly flows? Different studies have attempted to address this question using a scale-by-scale budget equation (Pandey et al. Reference Pandey, Ramadugu and Perlekar2020, Reference Pandey, Mitra and Perlekar2023; Ramirez et al. Reference Ramirez, Burlot, Zamansky, Bois and Risso2024). However, as is the case for variable-density flows, there is no unique way to define scale-dependent kinetic energy, making the analysis ambiguous (Aluie Reference Aluie2013; Eyink & Drivas Reference Eyink and Drivas2018; Zhao & Aluie Reference Zhao and Aluie2018). Some studies (Prakash et al. Reference Prakash, Martínez Mercado, van Wijngaarden, Mancilla, Tagawa, Lohse and Sun2016; Innocenti et al. Reference Innocenti, Jaccod, Popinet and Chibbaro2021; Ma et al. Reference Ma, Hessenkemper, Lucas and Bragg2022) avoid this ambiguity by focusing only on the liquid phase, where the density is constant. This, of course, misses the correlations between points that are situated either within the bubble phase or across it, both of which are crucial to the energy budget.
The ambiguity in the definition of scale-dependent energy has been addressed mostly in the context of compressible turbulence (Aluie Reference Aluie2013; Wang et al. Reference Wang, Yang, Shi, Xiao, He and Chen2013; Eyink & Drivas Reference Eyink and Drivas2018; Hellinger et al. Reference Hellinger, Verdini, Landi, Franci, Papini and Matteini2020, Reference Hellinger, Papini, Verdini, Landi, Franci, Matteini and Montagud-Camps2021a , Reference Hellinger, Verdini, Landi, Papini, Franci and Matteinib ). Notably, Aluie (Reference Aluie2013) and Eyink & Drivas (Reference Eyink and Drivas2018) argue that, for compressible turbulent flows, the Favre definition (see § 3.3) of the scale-dependent energy is the most appropriate.
In contrast to compressible turbulence, bubbly flows are, to a good approximation, incompressible and the experimentally accessible Reynolds numbers are not too large. Thus, it behoves us to understand and investigate the scale-by-scale energy transfer using different definitions of scale-dependent energy that have been used in the literature. In particular, we follow the procedure outlined in Frisch (Reference Frisch1995), Pope (Reference Pope2000) and Aluie (Reference Aluie2013) and derive the scale-by-scale budget equation for two different definitions of the scale-dependent (or filtered) energy. For one of these definitions, we also derive an equivalent Kármán–Howarth–Monin (KHM) relation to study kinetic energy transfers in terms of spatial correlations (Galtier & Banerjee Reference Galtier and Banerjee2011; Thiesset & Vahé Reference Thiesset and Vahé2025). We show that, although different definitions show a net transfer of energy from large to small scales, the individual contributions to the inter-scale energy transfer do not have identical physical interpretation. However, if we impose the physically intuitive constraints that the buoyancy injection should happen primarily inside the bubble and it should be bounded above by the unfiltered energy injection, then the Favre definition is found to be more appropriate.
The rest of the paper is organised as follows: in § 2 we discuss the equations of motion and numerical details, next, we provide an overview of different methodologies and definitions that can be used to study these flows in § 3. The results are presented in § 4.
2. Model
We study bubbly flows by using the Navier–Stokes equations, combined with surface tension and buoyancy forces (Bunner & Tryggvason Reference Bunner and Tryggvason2002; Pandey et al. Reference Pandey, Ramadugu and Perlekar2020)
 \begin{align} \text{D}_t \rho {\boldsymbol{u}} &= -\boldsymbol{\nabla }\!p + \mu {\nabla} ^{2} {\boldsymbol{u}} + \boldsymbol{F}^g + \boldsymbol{F}^\sigma , \end{align}
 \begin{align} \text{D}_t \rho &= 0, \end{align}
 \begin{align} \boldsymbol{\nabla }\boldsymbol{\cdot }{\boldsymbol{u}} & = 0. \end{align}
Here,
 $\boldsymbol{u}$
,
 $\rho$
and
 $p$
are, respectively, the hydrodynamic velocity field, the density field and the pressure field at position
 $\boldsymbol{x} = (x, y, z)$
and time
 $t$
and
 $\text{D}_t=\partial _t + {\boldsymbol{u}}\boldsymbol{\cdot }\boldsymbol{\nabla}$
is the material derivative. The dynamic viscosity
 $\mu$
is assumed to be identical for both the phases. The surface tension force
 $\boldsymbol{F}^\sigma = \sigma \kappa \boldsymbol{n}$
, where
 $\sigma$
is the surface tension coefficient of the bubble–fluid interface,
 $\kappa$
is the curvature (field) and
 $\boldsymbol{n}$
is the normal to the bubble interface. The buoyancy force
 $\boldsymbol{F}^g = (\rho -\rho _a)\boldsymbol{g}$
, where
 $\boldsymbol{g}$
is the gravitational acceleration (pointing downward),
 $\rho _a=\rho _L+\alpha (\rho _B-\rho _L)$
is the average density and
 $\alpha$
is the volume fraction of the bubble phase. The second term in
 $\boldsymbol{F}^g$
prevents uniform downward acceleration of the velocity field and ensures zero average momentum at all times.
2.1. Direct numerical simulations
We perform a direct numerical simulations (DNS) of (2.1) in a periodic cubic domain of volume
 $V_{ {Box}}$
discretised with
 $N^3$
equi-spaced grid points. A summary of the parameters used in our study is provided in table 1. In the small
 ${At}$
regime (run R1), we use the Boussinesq approximation wherein the density variation is only retained in the buoyancy force term and solve (2.1a
) using a pseudo-spectral method. In the high
 ${At}$
regime (run R2) we numerically integrate (2.1a
) using the finite-volume solver PARIS (Aniszewski et al. Reference Aniszewski2021). Using (2.1a
) and (2.1c
), we get a non-separable elliptic equation
 $\boldsymbol{\nabla }\boldsymbol{\cdot }(\rho ^{-1} \boldsymbol{\nabla }\!p)=S$
for the pressure field, where the source
 $S$
is obtained from (2.1a
). This equation is numerically solved using a multigrid scheme to obtain the pressure field (Aniszewski et al. Reference Aniszewski2021).
Table of parameters used in the DNS. We use a pseudo-spectral flow solver for R1 and PARIS for R2. The bubble evolution is done using front tracking in both the cases. For run R1 we use a pseudo-spectral flow solver, and for run R2 we use the finite-difference-based PARIS flow solver (Aniszewski et al. Reference Aniszewski2021). The bubble evolution is done using front tracking for both the runs. The bubble diameter
 $D=1.08$
for both the runs.

Bubble fronts are evolved using a front-tracking algorithm (Aniszewski et al. Reference Aniszewski2021). Initially, the
 $N_B$
spherical bubbles of diameter
 $D$
are randomly distributed to achieve the volume fraction
 $\alpha \equiv N_BV_B/V_{ {Box}}$
, where
 $V_B=\pi D^3/6$
is the volume of a single bubble. From the bubble front, an indicator field
 $\phi$
is obtained on the grid by numerically solving
 ${\nabla} ^2 \phi =\boldsymbol{\nabla }\boldsymbol{\cdot }\boldsymbol{n}$
. Depending on the numerical approximation used to extrapolate the normal vector on to the grid, we obtain a
 $\phi$
that smoothly varies from
 $1$
(inside the bubble) to
 $0$
(in the liquid) over two to three points on the grid. The density field expressed as
 $\rho =\phi (\rho _B-\rho _L)+\rho _L$
satisfies (2.1b
). We refer the reader to Pandey et al. (Reference Pandey, Ramadugu and Perlekar2020) and Aniszewski et al. (Reference Aniszewski2021) for a more detailed discussion of the numerical implementation.
2.2. Characterisation of the steady state
We evolve (2.1) for approximately
 $5\tau$
, where
 $\tau \equiv {\mathcal L}/u_{z,\textit{rms}}$
is the integral time scale,
 $\mathcal{L}=3\pi /4 (\sum _k E(k)/k)/\sum _kE(k)$
is the integral length scale,
 $u_{z,\textit{rms}}$
is the root-mean-square value of the vertical velocity and
 $E(k)$
is the energy spectrum,
 $E(k)\equiv \sum _{k-1/2\lt |\boldsymbol{q}|\lt k+1/2} |\widehat {{\boldsymbol{u}}}(\boldsymbol{q})|^2$
, with
 $\widehat {\boldsymbol{u}}(\boldsymbol{q})$
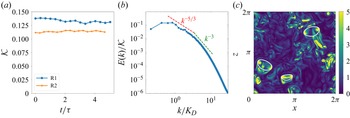
being the Fourier transform of the velocity field. In figures 1 (a) and 1(b), we show the time evolution of the kinetic energy
 ${\mathcal K}=1/V_{ {Box}} \int 1/2\,\rho {\boldsymbol{u}}^2 \textrm {d}V_{ {Box}}$
in the statistically steady state, and the steady-state energy spectrum
 $E(k)$
showing the Kolmogorov (
 $-5/3$
) and pseudo-turbulence (
 $-3$
) scaling regimes (Pandey et al. Reference Pandey, Mitra and Perlekar2023). Figure 1(c) shows a representative pseudo-colour visualisation of a two-dimensional slice of the vorticity magnitude field, superimposed with the bubble interface. Observe the pronounced wake flows produced by bubbles and their interactions with trailing bubbles and the wakes of neighbouring bubbles. In the subsequent sections, for the runs
 $\tt R1$
and
 $\tt R2$
, statistical analysis is performed using fifteen independent realisations of the flow separated by approximately
 $0.3 \tau$
.
(a) Kinetic energy time series in the statistically steady state. (b) Time-averaged energy spectrum
 $E(k)$
(normalised by the unfiltered kinetic energy) in the statistically steady state for run R2. We indicate the Kolmogorov (
 $k^{-5/3}$
) and the pseudo-turbulence (
 $k^{-3}$
) scaling ranges. The
 $k^{-5/3}$
scaling becomes more prominent for large Galilei number (
 ${Ga}\ge 1000)$
(Pandey et al. Reference Pandey, Mitra and Perlekar2023; Ma et al. Reference Ma, Tan, Ni, Hessenkemper and Bragg2025). Here,
 $K_D=2\pi /D$
is the wavenumber corresponding to the bubble diameter
 $D$
and
 $\tau$
is the large eddy turnover time. (c) Pseudo-colour plot of the magnitude of the vorticity field
 $|\boldsymbol{\omega }|$
in a representative two-dimensional slice containing bubbles for run R2 (the bubble–liquid interface is marked in white).

3. Scale-by-scale energy transfers
For any field
 $\psi (\boldsymbol{x})$
, we define the corresponding filtered field as
 \begin{equation} \overline {\psi }_K (\boldsymbol{x}) = G_r * \psi = \int \textrm {d}^3 \boldsymbol{k}\, G_K(\boldsymbol{k})\, \hat {\psi }(\boldsymbol{k})\, e^{i\boldsymbol{k}\boldsymbol{\cdot }\boldsymbol{x}}, \end{equation}
where
 $G_r$
is the real-space filtering kernel,
 $*$
denotes convolution,
 $G_K$
is a smooth low-pass filter in Fourier space that suppresses fluctuations at scales
 $\lt 1/K$
,
 $\widehat {\psi }$
is the Fourier transform of
 $\psi$
and
 $r \sim 1/K$
is the filtering length scale corresponding to the filtering wavenumber
 $K$
(Pope Reference Pope2000; Domaradzki & Carati Reference Domaradzki and Carati2007; Sadek & Aluie Reference Sadek and Aluie2018). In what follows, we will always use an isotropic Gaussian filter,
 $G_K(\boldsymbol{k}) = \textrm {exp}(-\pi ^2k^2/24K^2)$
, which is smooth and positive–definite in both real space and Fourier space.
Some commonly used definitions of the scale-dependent (filtered) kinetic energy used for studying variable density or compressible flows are as follows (
 $\langle \rangle$
denote spatial averaging):
-
F1
 $\mathcal{E}_K \equiv {1}/{2}\langle \overline {\rho {\boldsymbol{u}} }_K \boldsymbol{\cdot }\overline {{\boldsymbol{u}}}_K\rangle$
(Graham et al. Reference Graham, Cameron and Schüssler2010; Salvesen et al. Reference Salvesen, Beckwith, Simon, O’Neill and Begelman2013; Pandey et al. Reference Pandey, Ramadugu and Perlekar2020);
-
F2
$\mathcal{E}_K \equiv {1}/{2} \langle \overline {\rho {\boldsymbol{u}}}_K\boldsymbol{\cdot }\overline {\rho {\boldsymbol{u}}}_K/\overline {\rho }_K\rangle$
(Favre Reference Favre1965; Aluie Reference Aluie2011; Pandey et al. Reference Pandey, Mitra and Perlekar2023); -
F3
$\mathcal{E}_K \equiv {1}/{2}\langle \overline {\rho }_K\,\overline {{\boldsymbol{u}}}_K \boldsymbol{\cdot }\overline {{\boldsymbol{u}}}_K\rangle$
(Chassaing Reference Chassaing1985); and -
F4
$\mathcal{E}_K \equiv {1}/{2} \langle (\overline {\sqrt {\rho }{\boldsymbol{u}}}_K)^2\rangle$
(Kida & Orszag Reference Kida and Orszag1990; Miura & Kida Reference Miura and Kida1995; Praturi & Girimaji Reference Praturi and Girimaji2019; Schmidt & Grete Reference Schmidt and Grete2019).


Note that, with the Gaussian filter, except for F1, the scale-dependent kinetic energy is point-wise positive. All of the above definitions are identical for flows with uniform density
 $\rho =\rho _0$
. Besides filtering, inter-scale energy transfers can also be investigated from the time evolution of appropriate two-point correlators, that is, the KHM relation (Frisch Reference Frisch1995). Two commonly used correlators for variable-density flows are:
-
C1
$\mathcal{R}(\boldsymbol{r}) = {1}/{4}\langle \rho (\boldsymbol{x}) {\boldsymbol{u}}(\boldsymbol{x})\boldsymbol{\cdot }{\boldsymbol{u}}(\boldsymbol{x+r})+\rho (\boldsymbol{x}) {\boldsymbol{u}}(\boldsymbol{x})\boldsymbol{\cdot }{\boldsymbol{u}}(\boldsymbol{x-r})\rangle$
(Galtier & Banerjee Reference Galtier and Banerjee2011; Banerjee & Kritsuk Reference Banerjee and Kritsuk2017; Thiesset & Vahé Reference Thiesset and Vahé2025) and; -
C2
$\mathcal{R}(\boldsymbol{r}) = {1}/{2}\langle \sqrt {\rho {\boldsymbol{u}}}(\boldsymbol{x}) \boldsymbol{\cdot }\sqrt {\rho {\boldsymbol{u}}}(\boldsymbol{x+r})\rangle$
(Wang et al. Reference Wang, Yang, Shi, Xiao, He and Chen2013; Hellinger et al. Reference Hellinger, Papini, Verdini, Landi, Franci, Matteini and Montagud-Camps2021a
);


where
 $\boldsymbol{r}$
is the increment vector. Some studies have previously looked at the correlation tensor,
 $R_{ij}(\boldsymbol{r}) = 1/2\,\langle \rho (\boldsymbol{x}) u_i(\boldsymbol{x})u_j(\boldsymbol{x+r}) \rangle$
(Hill Reference Hill2001; Arun et al. Reference Arun, Sameen, Srinivasan and Girimaji2021; Hamba Reference Hamba2022), and identified the scale-dependent energy as the trace of the shell-averaged correlation tensor.
The filtering and correlation function approaches are connected to each other. Using the Wiener–Khinchin theorem (Kubo, Toda & Hashitsume Reference Kubo, Toda and Hashitsume1991), we obtain the following relation between the filtered energy
 $\textrm {d}\mathcal{E}_K/\textrm {d}K$
(with a sharp spectral filter as in Frisch (Reference Frisch1995)) and the shell-averaged correlator
 $R(r)$
(we sketch out a proof of this relation in Appendix A.1):
 \begin{equation} R(r) = \int \textrm {d}K \frac {{\textrm {d}\mathcal{E}_K}}{\textrm {d}K} \frac {\sin ({\textit{Kr}})}{\textit{Kr}}. \end{equation}
Equation (3.2) connects the C1 and C2 schemes to their filtering analogues F1 and F4, respectively. For F2 and F3 there is no such mapping because the scale-dependent energy is not quadratic in the filtered fields.
We now summarise some choices that have been used in the past to study energy transfers in bubbly flows. Motivated by Galtier & Banerjee (Reference Galtier and Banerjee2011) and Pandey et al. (Reference Pandey, Ramadugu and Perlekar2020), Ramadugu, Pandey & Perlekar (Reference Ramadugu, Pandey and Perlekar2020) defined the filtered energy as per definition F1, corresponding to the velocity–momentum correlator (C1). For bubbly flows, they show that the buoyancy contribution varies non-monotonically with respect to the filter cutoff
 $K$
, and the total energy transfer (via advective nonlinearity, pressure and surface tension) is from large scales to small scales. In a subsequent work, Pandey et al. (Reference Pandey, Mitra and Perlekar2023) used the density-weighted Favre velocity to study the energy transfers, i.e. definition F2. This approach is extensively used to study the scale-by-scale budget in compressible turbulence (Aluie Reference Aluie2013), and leads to a (point-wise) positive–definite-filtered energy. Pandey et al. (Reference Pandey, Mitra and Perlekar2023) found that the buoyancy contribution thus obtained is a monotonically increasing function of the filtering wavenumber
 $K$
. While the pressure contribution here transfers energy from small to large scales, the net transfer is still downscale. Alternatively, Ramirez et al. (Reference Ramirez, Burlot, Zamansky, Bois and Risso2024) circumvented the need to define filtered energy by writing a ‘spectral balance’ equation instead. However, this comes at the cost of containing an additional inertial time-derivative term in the budget, which makes a non-zero contribution in the statistically steady state, and thus has to be interpreted carefully.
In the following, we review the scale-by-scale energy budget equations obtained using definitions F1 and F2. For F1, we derive an equivalent KHM relation for the velocity-momentum correlation using the definition C1.
3.1. Scale-by-scale budget for
$\mathcal{E}_K=(1/2)\langle \overline {\rho {\boldsymbol{u}}}_K \boldsymbol{\cdot }\overline {{\boldsymbol{u}}}_K\rangle$
(F1)

We first derive the scale-by-scale budget using the filtering approach presented in Pandey et al. (Reference Pandey, Ramadugu and Perlekar2020). Starting from the Navier–Stokes equations, we obtain the following equations for the filtered momentum:
 \begin{align} \partial _t \overline {\rho {\boldsymbol{u}}}_K +\boldsymbol{\nabla }\boldsymbol{\cdot }\overline {\rho {\boldsymbol{u}}{\boldsymbol{u}}}_K = -\boldsymbol{\nabla }\, \overline {p}_K + \mu {\nabla} ^{2} \overline {{\boldsymbol{u}}}_K + \overline {\boldsymbol{F}^g}_K+ \overline {\boldsymbol{F}^\sigma }_K, \end{align}
and the filtered velocity
 \begin{align} \partial _t \overline {{\boldsymbol{u}}}_K +\boldsymbol{\nabla }\boldsymbol{\cdot }\overline {{\boldsymbol{u}} {\boldsymbol{u}}}_K = -\overline {\left (\frac {\boldsymbol{\nabla }\!p}{\rho }\right )}_K + \mu \overline {\left (\frac {{\nabla} ^{2} {\boldsymbol{u}}}{\rho }\right )}_K + \overline {\left (\frac {\boldsymbol{F}^g}{\rho }\right )}_K+ \overline {\left (\frac {\boldsymbol{F}^\sigma }{\rho }\right )}_K. \end{align}
Taking the dot product of (3.3) with
 $\overline {{\boldsymbol{u}}}_K$
, (3.4) with
 $\overline {\rho {\boldsymbol{u}}}_K$
and averaging the two we obtain the following equation for the filtered energy
 $\mathcal{E}_K$
:
 \begin{equation} \partial _t \mathcal{E}_K = \mathcal{N}_K + \mathcal{D}_K + \mathcal{P}_K + \mathcal{F}^g_K + \mathcal{F}^\sigma _K, \end{equation}
where
 $\mathcal{N}_K$
is the advective nonlinear contribution,
 $\mathcal{D}_K$
is the viscous dissipation,
 $\mathcal{P}_K$
is the pressure contribution,
 $\mathcal{F}^g_K$
is the buoyancy injection and
 $\mathcal{F}^\sigma _K$
is the surface tension contribution. The explicit expressions for each of these contributions are given as follows:
 \begin{align} \mathcal{N}_K &= -\frac {1}{2} \left \langle \overline {\boldsymbol{u}}_K \boldsymbol{\cdot }\boldsymbol{\nabla }\, \overline {\rho \boldsymbol{u}\boldsymbol{u}}_K + \overline {\rho \boldsymbol{u}}_K \boldsymbol{\cdot }\boldsymbol{\nabla }\, \overline {\boldsymbol{u}\boldsymbol{u}}_K \right \rangle \!,\notag\\ \mathcal{F}^c_K &= \frac {1}{2} \left \langle \overline {\boldsymbol{u}}_K \boldsymbol{\cdot }\overline {\boldsymbol{F}^c}_K + \overline {\rho \boldsymbol{u}}_K \boldsymbol{\cdot }\overline {\left (\frac {\boldsymbol{F}^c}{\rho }\right )}_K \right \rangle \!,\notag\\ \mathcal{D}_K &= \frac {\mu }{2} \left \langle \overline {\boldsymbol{u}}_K \boldsymbol{\cdot }{\nabla} ^2 \overline {\boldsymbol{u}}_K + \overline {\rho \boldsymbol{u}}_K \boldsymbol{\cdot }\overline {\left (\frac {{\nabla} ^2 \boldsymbol{u}}{\rho }\right )}_K \right \rangle \!,\notag\\ \mathcal{P}_K &= -\frac {1}{2} \left \langle \overline {\rho \boldsymbol{u}}_K \boldsymbol{\cdot }\overline {\left (\frac {\boldsymbol{\nabla }\!p}{\rho }\right )}_K \right \rangle \!. \end{align}
The superscript
 $c$
above stands for
 $\sigma$
or
 $g$
. All the quantities above are cumulative functions of the filtering wavenumber
 $K$
. Therefore, energy is injected (dissipated) where their derivatives with respect to
 $K$
are positive (negative).
The inter-scale energy transfer terms (advective nonlinearity, surface tension and pressure) couple different length scales, and are non-monotonic functions of the filtering wavenumber
 $K$
. Further, the above equation reduces to the time evolution equation for the unfiltered kinetic energy
 $\mathcal{K}= 1/2\,\langle \rho u^2\rangle$
in the limit
 $K\to \infty$
. Note that the contributions due to the advective nonlinearity
 $\mathcal{N}_K$
and pressure
 $\mathcal{P}_K$
vanish in this limit.
3.2. Equivalent KHM relation using velocity–momentum correlator C1
We now outline a KHM relation for the two-point momentum velocity correlator. We start by defining the average velocity-momentum correlation function for an increment vector
 $\boldsymbol{r}$
 \begin{equation} R(\boldsymbol{r}) = \frac {1}{2} \langle {\boldsymbol{u}}(\boldsymbol{x}+\boldsymbol{r}) \boldsymbol{\cdot }\rho (\boldsymbol{x}){\boldsymbol{u}}(\boldsymbol{x})\rangle . \end{equation}
The scale-dependent kinetic energy is then defined as the symmetrised version of the above correlator
 \begin{align} {\mathcal{R}}(\boldsymbol{r}) = \frac {1}{2}\left [{R(\boldsymbol{r}) + R(-\boldsymbol{r})}\right ]=\frac {1}{4} \langle \rho {\boldsymbol{u}}\boldsymbol{\cdot }{\boldsymbol{u}}' + \rho '{\boldsymbol{u}}'\boldsymbol{\cdot }{\boldsymbol{u}} \rangle , \end{align}
where the superscript
 $(\boldsymbol{\cdot })^\prime$
indicates the value of function at position
 $\boldsymbol{x}^\prime$
(note that
 $R(-\boldsymbol{r}) = \left \langle { {\boldsymbol{u}}(\boldsymbol{x}-\boldsymbol{r}) \boldsymbol{\cdot }\rho (\boldsymbol{x}){\boldsymbol{u}}(\boldsymbol{x})}\right \rangle /2 = \left \langle { {\boldsymbol{u}}(\boldsymbol{x})\boldsymbol{\cdot }\rho (\boldsymbol{x}+\boldsymbol{r}){\boldsymbol{u}}(\boldsymbol{x}+\boldsymbol{r})}\right \rangle /2$
. For uniform density flows
 $R(\boldsymbol{r})=R(-{\boldsymbol{r}})$
). Starting from the Navier–Stokes equations (2.1) and taking a dot product with the velocity field
 ${\boldsymbol{u}}^\prime$
, we get
 \begin{equation} \boldsymbol{u}'\boldsymbol{\cdot }\partial _t \rho {\boldsymbol{u}} +\boldsymbol{u}'\boldsymbol{\cdot }\boldsymbol{\nabla }\boldsymbol{\cdot }\rho {\boldsymbol{u}}{\boldsymbol{u}}= -\boldsymbol{u}'\boldsymbol{\cdot }\boldsymbol{\nabla }\!p + \boldsymbol{u}'\boldsymbol{\cdot }\mu {\nabla} ^{2} {\boldsymbol{u}} + \boldsymbol{u}'\boldsymbol{\cdot }\boldsymbol{F}^g + \boldsymbol{u}'\boldsymbol{\cdot }\boldsymbol{F}^\sigma . \end{equation}
Likewise, we write equations for
 $\rho \boldsymbol{u}\boldsymbol{\cdot }\partial _t\boldsymbol{u}^\prime$
,
 $\boldsymbol{u}\boldsymbol{\cdot }\partial _t\rho '\boldsymbol{u}'$
and
 $\rho '\boldsymbol{u}'\boldsymbol{\cdot }\partial _t\boldsymbol{u}$
. Using the above equations and after averaging over the entire domain, we get the KHM relation (see Appendix A.2 for details)
 \begin{equation} \partial _t \mathcal{R}(\boldsymbol{r}) = \mathcal{N}(\boldsymbol{r}) + \mathcal{D}(\boldsymbol{r}) + \mathcal{P}(\boldsymbol{r}) + \mathcal{F}^g (\boldsymbol{r})+ \mathcal{F}^\sigma (\boldsymbol{r}). \end{equation}
The expressions for the contributions due to advective nonlinearity
 $\mathcal{N}(\boldsymbol{r})$
, viscous dissipation
 $\mathcal{D}(\boldsymbol{r})$
, pressure
 $\mathcal{P}(\boldsymbol{r})$
, surface tension
 $\mathcal{F}^\sigma (\boldsymbol{r})$
and buoyancy injection
 $\mathcal{F}^g(\boldsymbol{r})$
are
 \begin{align} \mathcal{N}(\boldsymbol{r}) &= \frac {1}{4}\boldsymbol{\nabla} _{\boldsymbol{r}} \boldsymbol{\cdot }\langle \delta (\rho {\boldsymbol{u}})\boldsymbol{\cdot }\delta {\boldsymbol{u}}\,\delta {\boldsymbol{u}}\rangle ,\notag\\ \mathcal{D}(\boldsymbol{r}) &= \frac {\mu }{4}\left \langle {\boldsymbol{u}}' \boldsymbol{\cdot }{\nabla} ^2 {\boldsymbol{u}} + \rho {\boldsymbol{u}} \boldsymbol{\cdot }\frac {\boldsymbol{\nabla }'^2{\boldsymbol{u}}'}{\rho '} + {\boldsymbol{u}} \boldsymbol{\cdot }\boldsymbol{\nabla }'^2{\boldsymbol{u}}' + \rho ' {\boldsymbol{u}}' \boldsymbol{\cdot }\frac {{\nabla} ^2{\boldsymbol{u}}}{\rho } \right \rangle \!,\notag\\ \mathcal{P}(\boldsymbol{r}) &= -\frac {1}{4} \left \langle \rho {\boldsymbol{u}} \boldsymbol{\cdot }\frac {\boldsymbol{\nabla }'p'}{\rho '} + \rho ' {\boldsymbol{u}}' \boldsymbol{\cdot }\frac {\boldsymbol{\nabla }\!p}{\rho } \right \rangle\! , \,\text{} \notag\\ \mathcal{F}^c(\boldsymbol{r})&= \frac {1}{4}\left \langle {\boldsymbol{u}}' \boldsymbol{\cdot }\boldsymbol{F}\,^c + \rho {\boldsymbol{u}} \boldsymbol{\cdot }\frac {\boldsymbol{F}^{c}\,'}{\rho '} + {\boldsymbol{u}} \boldsymbol{\cdot }\boldsymbol{F}^c\,' + \rho ' {\boldsymbol{u}}' \boldsymbol{\cdot }\frac {\boldsymbol{F}^c}{\rho } \right \rangle \!, \end{align}
where
 $c$
stands for either
 $g$
(buoyancy) or
 $\sigma$
(surface tension). We would like to highlight the similarity in the structure of the budget contributions in (3.11) and (3.6). The above correlation functions can be exactly mapped to the quantities in the filtered budget in (3.6) (obtained by sharp spectral filters) using (A4).
The KHM relations derived for compressible flows (Galtier & Banerjee Reference Galtier and Banerjee2011; Lai, Charonko & Prestridge Reference Lai, Charonko and Prestridge2018) are identical to (3.10) in the incompressible limit (
 $\boldsymbol{\nabla }\boldsymbol{\cdot }{\boldsymbol{u}}=0$
). Note that (3.10) is identical to the KHM relation derived in the recent work of Thiesset & Vahé (Reference Thiesset and Vahé2025). Furthermore, for iso-density flows, (3.10) reduces to the standard KHM relation as in Frisch (Reference Frisch1995). To make comparison with the scale-by-scale budget equation, we perform an angular averaging and obtain the contribution from the isotropic sector for different terms.
3.3. Scale-by-scale budget for Favre-filtered energy
$\mathcal{E}_K=(1/2)\langle \overline {\rho {\boldsymbol{u}}}_K \boldsymbol{\cdot }\overline {\rho {\boldsymbol{u}}}_K/\overline {\rho }_K \rangle$
((F2))

The following discussion closely follows Pandey et al. (Reference Pandey, Mitra and Perlekar2023) and the supplemental material within. For a field
 $\psi$
, the corresponding Favre-filtered field is defined as
 \begin{align} \widetilde {\psi }_K= \frac {\overline {\rho \psi }_K}{\overline {\rho }_K}. \end{align}
From the Navier–Stokes equations, we can obtain the following evolution equations for the filtered density, and the filtered momentum field:
 \begin{align} \partial _t \overline {\rho }_K + \boldsymbol{\nabla }\boldsymbol{\cdot }\overline {\rho }_K \widetilde {{\boldsymbol{u}}}_K &=0, \end{align}
 \begin{align} \partial _t \overline {\rho }_K \widetilde {{\boldsymbol{u}}}_K + \boldsymbol{\nabla }\boldsymbol{\cdot }\overline {\rho {\boldsymbol{u}}{\boldsymbol{u}}}_K &= -\boldsymbol{\nabla }\,\overline {p}_K +\mu {\nabla} ^2\overline {{\boldsymbol{u}}}_K + \overline {\boldsymbol{F}^g}_K+\overline {\boldsymbol{F}^\sigma }_K. \end{align}
As evident from the density equation above, the Favre velocity is the advection velocity for the filtered density. From the above equations, we obtain the following scale-by-scale energy budget equation:
 \begin{equation} \partial _t \mathcal{E}_K = \mathcal{N}_K + \mathcal{D}_K + \mathcal{P}_K + \mathcal{F}^g_K + \mathcal{F}^\sigma _K, \end{equation}
with
 \begin{align} \mathcal{E}_K &= \left\langle \overline {\rho }_K |\tilde {{\boldsymbol{u}}}_K|^2 \right\rangle /2, \nonumber \\ \mathcal{N}_K &= \left \langle \overline {\rho }_K \boldsymbol{\nabla }\, \overline {\boldsymbol{u}}_K: \left( \widetilde {\boldsymbol{u}\boldsymbol{u}}_K -\widetilde {\boldsymbol{u}}_K\,\widetilde {\boldsymbol{u}}_K\right)\right \rangle \!, \nonumber \\ \mathcal{D}_K &= \left \langle \mu \widetilde {\boldsymbol{u}}_K\boldsymbol{\cdot }{\nabla} ^2 \overline {\boldsymbol{u}}_K \right \rangle \!, \nonumber \\ \mathcal{P}_K &= - \left \langle \widetilde {\boldsymbol{u}}_K\boldsymbol{\cdot }\boldsymbol{\nabla }\,\overline {p}_K \right \rangle \!,\,\textrm {} \nonumber \\ \mathcal{F}^c_K &= \left \langle \widetilde {\boldsymbol{u}}_K\boldsymbol{\cdot }\overline {\boldsymbol{F}^c}_K \right \rangle \!, \end{align}
with
 $c$
again standing in for either buoyancy (
 $g$
) or surface tension (
 $\sigma$
). There is no pressure dilation contribution (
 $\sim \overline {p}_K\boldsymbol{\nabla }\boldsymbol{\cdot }\overline {{\boldsymbol{u}}}_K$
) since the filtered velocity field is incompressible, and therefore the pressure contribution is entirely baropycnal (Aluie Reference Aluie2011, Reference Aluie2013; Lees & Aluie Reference Lees and Aluie2019).
It was shown in Aluie (Reference Aluie2013) that the injection, here
 $\mathcal{F}^g_K$
, is localised to large scales for large-scale stirring. Aluie (Reference Aluie2013) also mathematically showed that the viscous term in the Favre scheme
 $\mathcal{D}_K$
has negligible effects in the inertial range in the infinite Reynolds number limit. These statements, in general, are not true for the other definitions, as demonstrated in Zhao & Aluie (Reference Zhao and Aluie2018).
4. Results
Using runs R1 and R2, we present below a comparative study of the scale-by-scale energy budget obtained using definitions F1, F2 and C1. We perform this analysis in the statistically steady state, where
 $\partial _t {\mathcal E}_K=0$
and
 $\partial _t {\mathcal R}(\boldsymbol{r})=0$
. In what follows, angular brackets denote averaging over space and fifteen independent realisations of the flow field.
4.1. Equivalence of the filtered budget F1 and the KHM relation C1
We first verify the equivalence of the velocity–momentum-filtered budget F1 and the corresponding KHM relation with correlator C1.
4.1.1. Small Atwood number
${At}=0.04$
(run R1)

In the small Atwood number limit (
 $\rho _B/\rho _L\approx 1$
and
 $\rho _a\approx \rho _L$
), we can use the Boussinesq approximation, wherein the density variations are retained only in the buoyancy term
 $\boldsymbol{F}^g\approx (\rho _B-\rho _L) \phi {\boldsymbol{g}}$
and the density is taken to be a constant everywhere else. With this approximation, equations (2.1) simplify to (Pandey et al. Reference Pandey, Mitra and Perlekar2022)
 \begin{align} \rho _a \text{D}_t {\boldsymbol{u}} &= -\boldsymbol{\nabla }\!p + \mu {\nabla} ^{2} {\boldsymbol{u}} + (\rho _B-\rho _L) \phi {\boldsymbol{g}} + \boldsymbol{F}^\sigma , \end{align}
 \begin{align} &\qquad\text{D}_t \phi = 0,\,\textrm {}\, \boldsymbol{\nabla }\boldsymbol{\cdot }{\boldsymbol{u}} = 0. \end{align}
The scale-by-scale budget is obtained by replacing
 $\rho$
with
 $\rho _a$
in the definitions F1–F4 detailed in § 3. It is evident that the resulting equation for scale-by-scale transfer is identical for all the cases
 \begin{equation} \partial _t \mathcal{E}_K = \mathcal{N}_K + \mathcal{D}_K + \mathcal{P}_K + \mathcal{F}^g_K + \mathcal{F}^\sigma _K, \end{equation}
where
 \begin{align} \mathcal{E}_K &= \rho _a \big\langle |\overline {{\boldsymbol{u}}}_K|^2 \big\rangle /2, \nonumber\\ \mathcal{N}_K &= \rho _a \big \langle \boldsymbol{\nabla }\, \overline {\boldsymbol{u}}_K: ( \overline {\boldsymbol{u}\boldsymbol{u}}_K -\overline {\boldsymbol{u}}_K\,\overline {\boldsymbol{u}}_K)\big \rangle, \nonumber\\ \mathcal{D}_K &= -\mu \big \langle \boldsymbol{\nabla }\overline {\boldsymbol{u}}_K|^2 \big \rangle, \nonumber\\ \mathcal{F}^c_K &= \big \langle \overline {\boldsymbol{u}}_K\boldsymbol{\cdot }\overline {\boldsymbol{F}^c}_K \big \rangle , \end{align}
with
 $c$
again standing for either buoyancy (
 $g$
) or surface tension (
 $\sigma$
).
Due to the incompressibility constraint (
 $\boldsymbol{\nabla }\boldsymbol{\cdot }{\boldsymbol{u}}=0$
and
 $\boldsymbol{\nabla }\boldsymbol{\cdot }\overline {{\boldsymbol{u}}}_K=0$
), the pressure term
 $\mathcal{P}_K = -\langle \overline {{\boldsymbol{u}}}_K\boldsymbol{\cdot }\boldsymbol{\nabla }\, \overline {p}_K \rangle = \langle (\boldsymbol{\nabla }\boldsymbol{\cdot }\overline {{\boldsymbol{u}}}_K) \overline {p}_K \rangle = 0$
and thus does not contribute to the energy transfers across scales (Frisch Reference Frisch1995). Similarly, replacing
 $\rho$
with
 $\rho _a$
in (3.11) gives the KHM relation corresponding to (4.2). Using the incompressibility condition, the pressure contribution
 ${\mathcal P}(r)$
vanishes also for (3.11).
We now compare the energy budget obtained using the scale-by-scale analysis (4.2) and the KHM relation (3.10). To make the comparison clear, we have used the empirical correspondence
 $K\boldsymbol{\cdot }r \sim \sqrt {3}$
suggested by Hellinger et al. (Reference Hellinger, Papini, Verdini, Landi, Franci, Matteini and Montagud-Camps2021a
) in the KHM relation (3.10). In addition, we plot all the quantities as a function of
 $K/K_D$
, where
 $K_D=2\pi /D$
is the wavenumber corresponding to the diameter of the bubble.
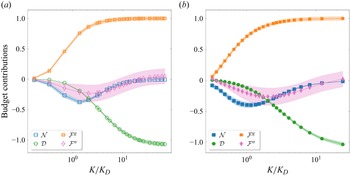
The budget contributions obtained using the two methods show excellent agreement. The buoyancy term
 ${\mathcal F}^g_K$
performs a net injection at scales comparable to the bubble diameter, while the viscous term
 $\mathcal D_K$
dissipates energy at small scales. The energy is transferred from the large scales to small scales through both surface tension
 ${\mathcal F}^\sigma _K$
and nonlinear advection
 ${\mathcal N}_K$
(Pandey et al. Reference Pandey, Ramadugu and Perlekar2020, Reference Pandey, Mitra and Perlekar2023; Ramirez et al. Reference Ramirez, Burlot, Zamansky, Bois and Risso2024). Note that the mechanism for energy transfer due to surface tension is now well established for both bubbly flows (Pandey et al. Reference Pandey, Perlekar and Mitra2019, Reference Pandey, Mitra and Perlekar2022; Thiesset & Vahé Reference Thiesset and Vahé2025) and emulsions (Dodd & Ferrante Reference Dodd and Ferrante2016; Perlekar Reference Perlekar2019; Crialesi-Esposito et al. Reference Crialesi-Esposito, Rosti, Chibbaro and Brandt2022). In particular, bubbles absorb energy due to the buoyancy injection as they stretch and deform, this energy is released at small scales as they relax.
Scale-by-scale budget using F1 filtering (3.6) (a) and the KHM relation C1(3.11) (b, with
 $K=\sqrt {3}/r$
) for small Atwood number (run R1). The pressure contribution is identically zero, hence not shown here. The shading indicates one standard deviation variations. In both the plots, all the budget contributions (vertical axis) have been normalised by the mean energy injection rate
 $\epsilon ^g\equiv \langle {{\boldsymbol{u}}} \boldsymbol{\cdot }{\boldsymbol{F}^g} \rangle$
.

4.1.2. Large Atwood number
${At}=0.8$
(Run R2)

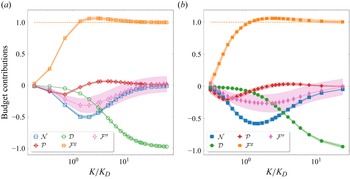
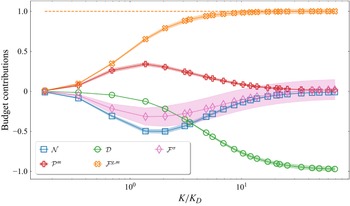
Comparison between different contributions to the filtered budget F1(3.6) and the KHM relation C1(3.11) for run R2 is shown in figure 3. The excellent agreement between different contributions for the two methods is again evident. This is consistent with previous studies on compressible turbulence (Hellinger et al. Reference Hellinger, Verdini, Landi, Papini, Franci and Matteini2021b
). The dependence of nonlinear advection
 ${\mathcal N}_K$
, surface tension
 ${\mathcal F}^\sigma _K$
and viscous dissipation
 ${\mathcal D}_K$
on the filtering wavenumber
 $K$
is similar to the small
 ${At}$
case discussed in the previous section. Their interpretation in the scale-by-scale budget is also identical.
Scale-by-scale budget using F1 filtering (3.6) (a) and the KHM relation C1 (3.11) (b, with
 $K=\sqrt {3}/r$
) for large Atwood number (run R2). The shading indicates one standard deviation variations. The orange dashed line indicates the unfiltered buoyancy injection to convey the non-monotonic behaviour of the buoyant flux. In both the plots, all the budget contributions (vertical axis) have been normalised by the mean energy injection rate
 $\epsilon ^g\equiv \langle {{\boldsymbol{u}}} \boldsymbol{\cdot }{\boldsymbol{F}^g} \rangle$
.

However, the buoyancy contribution for large
 ${At}$
varies non-monotonically with the filtering wavenumber
 $K$
(see
 ${\mathcal F}^g_K$
in figure 3). It initially rises, reaching a peak around
 $K\sim K_D$
, then declines and saturates to
 $\epsilon ^g$
. This suggests that, in addition to injection, buoyancy plays a role in the inter-scale energy transfers. This assertion is further justified by noting that the contribution of the buoyancy term in the time evolution equation of the residual energy (at scales
 $\gt K$
),
 $\mathcal{K}-\mathcal{E}_K$
, is equal to
 ${\mathcal F}_K^{g,\,\textit{ small}}=\epsilon ^g-\mathcal{F}^g_K$
. From the plot of
 $\mathcal{F}^g_K$
, it is evident that
 ${\mathcal F}_K^{g,\,\textit{small}}$
remains positive for
 $K\lt K_D$
and turns negative when
 $K\gt K_D$
. This sign reversal between the resolved and residual buoyancy contribution indicates an inverse energy transfer from small scales (
 $K\gt K_D$
) to intermediate scales (
 $K\approx K_D$
) (Pope Reference Pope2000). Note that similar non-monotonic behaviour of the energy injection is also observed in definitions F3 and F4 (see figure 8(b) in Appendix B).
Furthermore, the pressure contribution
 $\mathcal{P}_K$
is no longer negligible, and it transfers energy from both the small and large scales (where
 $\textrm {d}\mathcal{P}_K/\textrm {d}K\lt 0$
) to the intermediate scales (where
 $\textrm {d}\mathcal{P}_K/\textrm { d}K\gt 0$
).
How can an injection mechanism transfer across scales and how can pressure simultaneously transfer to both large and small scales? We do not address this immediately, but rather first investigate the Favre-filtered F2 energy budget in the next section.
4.2. Favre-filtered budget F2 for the large Atwood number case (run R2)
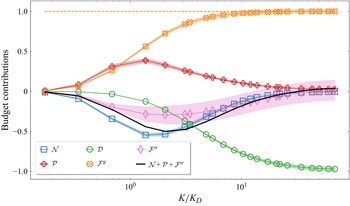
The contribution of the different terms in the Favre-filtered budget (3.16) for the large Atwood number case is shown in figure 4. A comparison with figure 3 reveals that the contributions of nonlinear advection
 $\mathcal{N}_K$
, viscous dissipation
 $\mathcal{D}_K$
and surface tension
 $\mathcal{F}^\sigma _K$
are qualitatively identical to the scale-by-scale budget obtained for F1 (3.6). However, the buoyancy and pressure contributions are very different. The cumulative buoyancy injection is a monotonically increasing function and saturates at large
 $K$
to
 $\epsilon ^g$
(Aluie Reference Aluie2013). Thus, in contrast to the
 $\tt F1$
definition, buoyancy injects energy at all scales. Perhaps the most striking is the pressure contribution, which for the Favre-filtered budget performs an inverse transfer from small scales (where
 $\textrm {d}\mathcal{P}_K/\textrm {d}K\lt 0$
) to large scales (where
 $\textrm {d}\mathcal{P}_K/\textrm {d}K\gt 0$
). This inverse baropycnal transfer (Aluie Reference Aluie2013) is consistent with previous studies on forced compressible turbulence (Wang et al. Reference Wang, Yang, Shi, Xiao, He and Chen2013; Lees & Aluie Reference Lees and Aluie2019). However, the sum of all transfer terms (advection, pressure and surface tension), the black solid line in figure 3, still shows a net transfer of energy from large (
 $\textrm {d}\mathcal{P}_K/\textrm {d}K+\textrm {d}\mathcal{N}_K/\textrm {d}K+\textrm {d}\mathcal{F}^\sigma _K/\textrm {d}K\lt 0$
) to small scales (
 $\textrm {d}\mathcal{P}_K/\textrm {d}K+\textrm {d}\mathcal{N}_K/\textrm {d}K+\textrm {d}\mathcal{F}^\sigma _K/\textrm {d}K\gt 0$
).
Scale-by-scale budget using the Favre filtering (F2) (3.16) for the large Atwood number (run R2). The shading indicates one standard deviation variations. All the budget contributions (vertical axis) have been normalised by the mean energy injection rate
 $\epsilon ^g\equiv \langle {{\boldsymbol{u}}} \boldsymbol{\cdot }{\boldsymbol{F}^g} \rangle$
. In contrast with the F1 budget (figure 3), the buoyancy term increases monotonically.

4.3. Reconciling definitions F1 and F2
Evidently, the definitions F1 and F2 give strikingly different results for buoyancy
 $\mathcal{F}^g_K$
and pressure
 $\mathcal{P}_K$
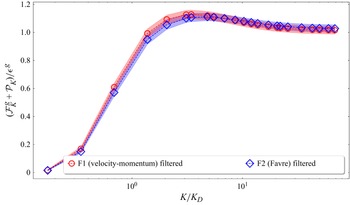
contributions. Since the other contributions are similar, one finds that, not surprisingly, the sum
 $\mathcal{F}^g_K + \mathcal{P}_K$
is nearly the same in the two definitions as well, see figure 5.
The sum of the baropycnal and the buoyancy contribution to the scale-by-scale budget (run R2) for both F1 and F2 definitions.

In the Favre-filtered framework F2, the buoyancy
 $\mathcal{F}^g_K$
injects energy and is not involved in transfers, while the pressure term does an inverse energy transfer from small scales to large scales. In contrast, for the definition F1, both buoyancy and pressure contribute to the inter-scale transfers.
Motivated by this, our subsequent analysis explores modifications to F1 to ensure that the buoyancy contribution only injects energy, and determines whether this allows us to reconcile definitions F1 and F2.
4.3.1. Decomposing the buoyancy contribution in F1
We propose to modify F1 by extracting the transfer part of
 $\mathcal{F}_K^g$
and adding it to the pressure term
 $\mathcal{P}_K$
. Recall that the buoyancy term in F1 makes two contributions (3.6)
 \begin{equation} \mathcal{F}\,^{{\tt F1},\,g}_K = \frac {1}{2}\underbrace { \left \langle \overline {{\boldsymbol{u}}}_K\boldsymbol{\cdot }\overline {\boldsymbol{F}^g}_K\right \rangle }_{\mathcal{I}_K} + \frac {1}{2}\underbrace {\left \langle \overline {\rho {\boldsymbol{u}}}_K \boldsymbol{\cdot }\overline {\left (\frac {\boldsymbol{F}^g}{\rho }\right )}_K \right \rangle }_{\mathcal{J}_K}. \end{equation}
The first term
 $\mathcal{I}_K$
is a pure injection term and is close to
 $\mathcal{F}^{{\tt F2},\,g}_K$
for all
 $K$
(see Appendix B and (Aluie Reference Aluie2013)), unlike
 $\mathcal{J}_K$
. Note that the structure of the buoyancy contribution term in the Favre budget
 $\langle \widetilde {{\boldsymbol{u}}}_K \boldsymbol{\cdot }\overline {\boldsymbol{F}^g}_K \rangle \equiv \langle \overline {{\rho {\boldsymbol{u}}}}_K \boldsymbol{\cdot }\overline {\boldsymbol{F}^g}_K/\overline {\rho }_K\rangle$
is similar to
 $\mathcal{J}_K$
. Therefore, we identify the transfer part in
 $\mathcal{J}_K$
as
 $\mathcal{J}_K-\mathcal{F}_K^{\tt {F2},\,g}$
 \begin{align} \mathcal{J}_K=\left \langle \overline {\rho {\boldsymbol{u}}}_K \boldsymbol{\cdot }\overline {\left (\frac {\boldsymbol{F}^g}{\rho }\right )}_K \right \rangle = \left \langle \overline {\rho {\boldsymbol{u}}}_K \boldsymbol{\cdot }\frac {\overline {\boldsymbol{F}^g}_K}{\overline {\rho }_K} \right \rangle + \left \langle \overline {\rho {\boldsymbol{u}}}_K \boldsymbol{\cdot }\left [\overline {\left (\frac {\boldsymbol{F}^g}{\rho }\right )}_K -\frac {\overline {\boldsymbol{F}^g}_K}{\overline {\rho }_K}\right ] \right \rangle \!. \end{align}
The above decomposition can be thought of as the contribution from the large-scale (resolved) acceleration
 $\overline {\boldsymbol{F}^g}_K/{\overline \rho }_K$
and a residual (sub-grid) contribution
 $\overline {\boldsymbol{F}^g/\rho }\,_K - \overline {\boldsymbol{F}^g}_K/{\overline \rho }_K$
which is involved in transfers across scales.
Indeed, if we add the residual contribution in buoyancy to the pressure transfer, we get the following modified equation for the F1 budget:
 \begin{equation} \partial _t \mathcal{E}_K = \mathcal{N}_K + \mathcal{D}_K + \mathcal{P}\,^{m}_K + \mathcal{F}^{g,\,m}_K + \mathcal{F}^\sigma _K, \end{equation}
with the following definitions of the modified buoyancy and pressure terms:
 \begin{align} \mathcal{F}^{g,\,m}_K &= \frac {1}{2} \left \langle \overline {\boldsymbol{u}}_K\boldsymbol{\cdot }\overline {\boldsymbol{F}^g}_K + \overline {\rho {\boldsymbol{u}}}_K \boldsymbol{\cdot }\frac {\overline {\boldsymbol{F}^g}_K}{\overline {\rho }_K}\right \rangle \!,\,\textrm {} \end{align}
 \begin{align} \mathcal{P}^m_K &= -\frac {1}{2} \left \langle \overline {\rho \boldsymbol{u}}_K\boldsymbol{\cdot }\overline {\left (\frac {\boldsymbol{\nabla }\!p}{\rho }\right )}_K\right \rangle + \left \langle \overline {\rho {\boldsymbol{u}}}_K \boldsymbol{\cdot }\left [\overline {\left (\frac {\boldsymbol{F}^g}{\rho }\right )}_K -\frac {\overline {\boldsymbol{F}^g}_K}{\overline {\rho }_K}\right ] \right \rangle \!. \end{align}
The superscript
 $m$
indicates modified quantities. With these new definitions, in figure 6, we plot the modified budget. Now all the transfers are consistent with the Favre-filtered framework. In particular, the injection term monotonically increases and the transfer due to modified pressure is indeed from small scales to large scales.
The F1-filtered scale-by-scale budget for the large Atwood number run R2 with the modified pressure and buoyancy contributions (as in (4.7) and (4.8)). The shading indicates one standard deviation variations. All the budget contributions (vertical axis) have been normalised with the mean injection. Notice the monotonic behaviour of the buoyancy term, contrast with figure 3. Further, the pressure term
 $\mathcal{P}_K$
now transfers energy definitively from small to large scales.

Thus, on appropriately identifying the residual transfer terms and the pure injection contributions, we find that both the definitions of evaluating the budget give similar results.
5. Spatial distribution of the buoyancy contribution in F1 and F2
To investigate the physical origin of the discrepancy between the buoyancy injection mechanisms in the definitions F1 and F2, we now contrast the filtered injection fields
 \begin{align} {\mathcal F}^{{\tt F1}, g}_K({\boldsymbol{x}})&= \frac {1}{2} \left (\overline {\boldsymbol{u}}_K\boldsymbol{\cdot }\overline {\boldsymbol{F}^g}_K + \overline {\rho {\boldsymbol{u}}}_K \boldsymbol{\cdot }\overline {\left (\frac {\boldsymbol{F}^g}{\rho }\right )}_K\right )\!, \quad\textrm {} \end{align}
 \begin{align} {\mathcal F}^{{\tt F2}, g}_K({\boldsymbol{x}})&= \widetilde {{\boldsymbol{u}}}_K \boldsymbol{\cdot }\overline {\boldsymbol{F}^g}_K. \end{align}
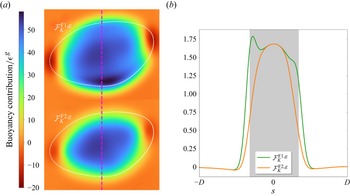
In figure 7 we compare the injection fields obtained using the two definitions for the top right bubble shown in figure 1(c). The filtering scale is set at
 $K \approx 2K_D$
, where the largest differences between the definitions are observed. The analysis reveals that the Favre-filtered contribution F2 is localised within the bubble, whereas in the velocity–momentum case F1, contributions arise from both the bubble interior and its boundary. We believe that this discrepancy in the two definitions is the reason for the observed differences. For
 $K=K_{\textit{max}}$
, the (unfiltered) buoyancy injection is from the regions within the bubble. We expect the filtered fields to preserve the same structure. Therefore, the above discussion suggests that the Favre-filtered energy budget is more appropriate to study buoyancy-driven bubbly flows. Further details are presented in Appendix B.
Two-dimensional slice of of the buoyancy contribution for F1 (3.6) and F2 (3.16) (a, for the top right bubble in figure 1 (c)) and corresponding one-dimensional vertical cut through the centre, marked by the dashed line (as a function of the distance from bubble centre
 $s$
) (b). The filtering wavenumber
 $K\approx 2K_D$
.

6. Discussion and conclusion
In this paper, we compared the scale-by-scale energy transfers obtained using two different definitions of the filtered energy,
 $\mathcal{E}^{\tt F1}_K = \langle \overline {{\boldsymbol{u}}}_K\boldsymbol{\cdot }\overline {\rho {\boldsymbol{u}}}_K\rangle /2$
(velocity–momentum definition) and
 $\mathcal{E}^{\tt F2}_K = \langle {\overline {\rho }_K}|\widetilde {{\boldsymbol{u}}}_K|^2\rangle /2$
(Favre definition) for bubbly flows. For the former definition of energy transfer, we also identify an equivalent KHM relation in terms of the velocity–momentum correlation function (Galtier & Banerjee Reference Galtier and Banerjee2011; Thiesset & Vahé Reference Thiesset and Vahé2025). There are two main contributions of the present manuscript: (i) we find that the KHM relation C1 shows excellent agreement with the corresponding filtered scheme F1, and (ii) we find that the filtered energy definitions F1 and F2 lead to different physical pictures for the transfer mechanisms when the Atwood number is large. For the parameters explored in our simulations, the nonlinear advection, surface tension and viscous contributions are found to be qualitatively identical for the two definitions. However, the buoyancy and baropycnal (pressure) contributions are found to be qualitatively different across the two schemes.
Strikingly, the buoyancy contribution in F1 also involves an inverse transfer part in addition to the expected injection, which to the best of our knowledge has not been reported in the literature before. In the Favre definition, this inverse transfer is via the baropycnal (pressure) term, while the buoyancy term is a pure injection term (Pandey et al. Reference Pandey, Mitra and Perlekar2023). We show that, for the Atwood numbers explored in our study, the two definitions can be matched by extracting the inverse transfer part from
 $\mathcal{F}^{{\tt F1},\,g}_K$
and adding it to the pressure contribution
 $\mathcal{P}_K^{\tt F1}$
as discussed in § 4.3. Thus, irrespective of the definition used there is an inverse energy transfer present, but involving different mechanisms. In the following, we address which definition is the most appropriate. It is physically reasonable to demand that the injection mechanism (here, the buoyancy contribution) only injects energy and does not couple the resolved and residual scales. Thus,
 $\mathcal{F}^g_K$
must be bounded above by
 $\epsilon ^g$
for all
 $K$
, as is the case in definition F2. Furthermore, an analysis of the spatial distribution of the buoyancy injection shows that it is localised within the bubble for F2, while for F1 we also observe strong contribution from regions in the vicinity of bubble interface. These results show that, even for the moderate Atwood and Galilei numbers used in our simulations, definition F2 is the more appropriate definition to study energy transfers in buoyancy-driven bubbly flows.
We now place our manuscript within the landscape of the previous studies that have compared different approaches to the scale-by-scale budget. Aluie (Reference Aluie2013) mathematically proved that the Favre F2 scheme satisfies the inviscid criterion, that is, the viscous effects do not contaminate the inertial-range dynamics. Zhao & Aluie (Reference Zhao and Aluie2018) showed numerically that, in contrast to F2, in the F3 and F4 schemes the viscous effects need not be negligible in the inertial range. While they did not explicitly check the F1 definition, one expects that this scheme may also violate the inviscid criterion at large Atwood and Galilei (or Reynolds) numbers. Another criticism of the C1 scheme in the context of generic compressible flows was raised in Eyink & Drivas (Reference Eyink and Drivas2018), who were concerned with the regularisation of the terms in the
 ${Re}_{\lambda }\to \infty$
limit. However, as they themselves point out, this criticism is not valid in the incompressible regime
 $\boldsymbol{\nabla }\boldsymbol{\cdot }{\boldsymbol u} =0$
, which is of interest to the present study. Finally, the study by Kritsuk, Wagner & Norman (Reference Kritsuk, Wagner and Norman2013) on forced compressible homogeneous and isotropic turbulence employed the velocity–momentum KHM relation and observed that, as
 $r\to 0$
(
 $K\to \infty$
) in filtering framework), the energy injection monotonically saturates to
 $\langle \rho {\boldsymbol{u}}\boldsymbol{\cdot }\boldsymbol{a}\rangle$
, where
 $\boldsymbol{a}$
is the large-scale stirring acceleration. While the injection terms like
 $\langle {\boldsymbol{u}}'\boldsymbol{\cdot }\boldsymbol{F}\rangle$
are, in general, functions of
 $\boldsymbol{r}$
, Kritsuk et al. (Reference Kritsuk, Wagner and Norman2013) argue that, for their choice of forcing and compressible flow dynamics, the injection terms are essentially constant in the inertial range. This follows from their observation that the fluctuations in the density field have a very short correlation length. Crucially, in our study, this assumption is not valid since the bubbles represent large-scale coherent fluctuations of density from the mean value, with length scale
 $D\approx L/5$
, where
 $D$
is the typical bubble diameter and
 $L$
is the size of the box.
To conclude, we compare and contrast two different definitions for the filtered energy F1 and F2 for incompressible bubbly flows. Previous studies, as discussed above, have found the Favre scheme to be more suitable for studying energy transfers in compressible turbulence. Our work is complementary to these studies in the context of incompressible buoyancy-driven bubbly flows. We show that the Favre-filtered definition is a natural choice even for moderate density contrast and Galilei numbers. Our study highlights the importance of appropriately defining the filtered energy and the fact that care must be taken while interpreting the different transfer mechanisms in buoyancy-driven multiphase flows.
Acknowledgements
We thank S. Banerjee for discussions.
Funding
D. M. and V. P. acknowledge the support of the Swedish Research Council Grants No. 638-2013-9243 and No. 2016-05225. Nordita is partially supported by Nordforsk. H.N. and P. P. acknowledge support from the Department of Atomic Energy (DAE), India under Project Identification No. RTI 4007, and DST (India) Projects No. MTR/2022/000867. All the simulations are performed using the HPC facility at TIFR Hyderabad.
Declaration of interests
The authors report no conflicts of interest.
Appendix A. The Kármán–Howarth–Monin relation
A.1. Connection between the filtering and correlation approaches
For completeness, we now make the connection between the filtering and correlation function approaches explicit. Consider a correlator
 $C(\boldsymbol{r})={1}/{2}\langle A(\boldsymbol{x})\,B(\boldsymbol{x}+\boldsymbol{r})\rangle$
of
 $2\pi$
-periodic functions
 $A$
and
 $B$
. Let the Fourier representation for
 $A(\boldsymbol{x}) = \sum _{\boldsymbol{k}} \widehat {A}(\boldsymbol{k})e^{i\boldsymbol{k}\boldsymbol{\cdot }\boldsymbol{x}}$
and likewise
 $B(\boldsymbol{x})$
. It follows from Parseval’s theorem that
 \begin{equation} C(\boldsymbol{r}) = \frac {1}{2} \sum _{\boldsymbol{k}}\widehat {A}^*(\boldsymbol{k})\widehat {B} (\boldsymbol{k})e^{i\boldsymbol{k}\boldsymbol{\cdot }\boldsymbol{r}}. \end{equation}
Due to the orthogonality of the Fourier basis, the above expression allows us to immediately write the co-spectrum of
 $\widehat {A}$
and
 $\widehat {B}$
in terms of the correlation function as
 \begin{equation} \left\langle C(\boldsymbol{r})e^{-i\boldsymbol{k}\boldsymbol{\cdot }\boldsymbol{r}}\right\rangle _{\boldsymbol{r}} = \frac {1}{2} \widehat {A}^*(\boldsymbol{k})\widehat {B}(\boldsymbol{k}). \end{equation}
Now, the shell-averaged (isotropic) correlator is defined as
 \begin{equation} C(r) \equiv \frac {1}{4\pi } \int \textrm {d}\varOmega \, C(\boldsymbol{r}) = \frac {1}{2}\sum _{\boldsymbol{k}} \widehat {A}^*(\boldsymbol{k})\widehat {B} (\boldsymbol{k})\frac {\sin ({\textit{kr}})}{\textit{kr}}, \end{equation}
with
 $\varOmega$
being the solid angle. We can rewrite the right-hand side using the spectral energy density
 $G(\boldsymbol{k}) = {1}/{4}(\widehat {A}^*(\boldsymbol{k})\widehat {B} (\boldsymbol{k})+c.c.)$
, where
 $c.c.$
denotes the complex conjugate, to get
 \begin{align} C(r) = \sum _{\boldsymbol{k}} G(\boldsymbol{k}) \frac {\sin ({\textit{kr}})}{\textit{kr}} = \sum _k G(k)\frac {\sin ({\textit{kr}})}{\textit{kr}}. \end{align}
In the second equality we have done angular integration in
 $\boldsymbol{k}$
-space and
 $G(k)$
is the energy contained in
 $k$
-shell. The expression above (A4) allows one to move between the filtered quantities and correlation functions. For open boundaries, analogous relation holds with Fourier transform instead of Fourier series, with
 $\sum \to \int \textrm {d} k$
.
A.2. Derivation of the Kármán–Howarth–Monin relation
Our derivation for the KHM relation with the velocity–momentum correlator (definition C1) follows closely the presentation given in Galtier & Banerjee (Reference Galtier and Banerjee2011). We first derive the time evolution equation for
 $R(\boldsymbol{r}) = {1}/{2}\langle \boldsymbol{u}'\boldsymbol{\cdot }\rho \boldsymbol{u}\rangle$
Starting from the Navier–Stokes equations
 \begin{equation} D_t \rho {\boldsymbol{u}} = -\boldsymbol{\nabla }\!p + \mu {\nabla} ^{2} {\boldsymbol{u}} +\boldsymbol{F}^g + \boldsymbol{F}^\sigma , \end{equation}
and taking the dot product of the above equation with
 ${\boldsymbol{u}}'$
we get
 \begin{equation} {\boldsymbol{u}}' \boldsymbol{\cdot }\partial _t \rho {\boldsymbol{u}} + {\boldsymbol{u}}' \boldsymbol{\cdot }(\boldsymbol{\nabla }\boldsymbol{\cdot }\rho {\boldsymbol{u}} {\boldsymbol{u}}) = -{\boldsymbol{u}}'\boldsymbol{\cdot }\boldsymbol{\nabla }\!p + \mu {\boldsymbol{u}}'\boldsymbol{\cdot }{\nabla} ^{2} {\boldsymbol{u}} + {\boldsymbol{u}}'\boldsymbol{\cdot }\boldsymbol{F}^g + {\boldsymbol{u}}'\boldsymbol{\cdot }\boldsymbol{F}^\sigma . \end{equation}
The complementary equation to the above comes from the time evolution equation for the primed velocity field
 ${\boldsymbol{u}}'$
 \begin{equation} \rho {\boldsymbol{u}} \boldsymbol{\cdot }\partial _t {\boldsymbol{u}}' + \rho {\boldsymbol{u}} \boldsymbol{\cdot }(\boldsymbol{\nabla }' \boldsymbol{\cdot }{\boldsymbol{u}}' {\boldsymbol{u}}') = -\rho {\boldsymbol{u}}\boldsymbol{\cdot }\frac {\boldsymbol{\nabla }' {p'}}{\rho '} + \mu \rho {\boldsymbol{u}}\boldsymbol{\cdot }\frac {1}{\rho '}{\boldsymbol{\nabla }'}^{2} {\boldsymbol{u}}' + \rho {\boldsymbol{u}}\boldsymbol{\cdot }\frac {1}{\rho '}\boldsymbol{F}^{g '} + \rho {\boldsymbol{u}}\boldsymbol{\cdot }\frac {1}{\rho '}\boldsymbol{F}^{\sigma '}. \end{equation}
Note that, for any function
 $f(\boldsymbol{x}+\boldsymbol{r})=f'$
, we have
 $\boldsymbol{\nabla }'f'=\boldsymbol{\nabla }f'=\boldsymbol{\nabla} _r f'$
by chain rule. Here,
 $\boldsymbol{\nabla} _i=\partial /\partial x_i$
,
 $\boldsymbol{\nabla }'_i=\partial /\partial x'_i$
and
 $\boldsymbol{\nabla} _{ri}=\partial /\partial r_i$
. Adding the above two equations, we have
 \begin{align} \partial _t (\rho {\boldsymbol{u}}\boldsymbol{\cdot }{\boldsymbol{u}}') &= - {\boldsymbol{u}}' \boldsymbol{\cdot }(\boldsymbol{\nabla }\boldsymbol{\cdot }\rho {\boldsymbol{u}} {\boldsymbol{u}}) - \rho {\boldsymbol{u}} \boldsymbol{\cdot }(\boldsymbol{\nabla }\boldsymbol{\cdot }{\boldsymbol{u}}' {\boldsymbol{u}}') -{\boldsymbol{u}}'\boldsymbol{\cdot }\boldsymbol{\nabla }\!p-\rho {\boldsymbol{u}}\boldsymbol{\cdot }\frac {\boldsymbol{\nabla }\!p'}{\rho '} \nonumber \end{align}
 \begin{align} &\quad + \mu {\boldsymbol{u}}'\boldsymbol{\cdot }{\nabla} ^{2} {\boldsymbol{u}} + \mu \rho {\boldsymbol{u}}\boldsymbol{\cdot }\frac {1}{\rho '}{\nabla} ^{2} {\boldsymbol{u}}' + {\boldsymbol{u}}'\boldsymbol{\cdot }\boldsymbol{F} + \rho {\boldsymbol{u}}\boldsymbol{\cdot }\frac {1}{\rho '}\boldsymbol{F}'. \end{align}
Here, we are using
 $\boldsymbol{F}$
as shorthand for
 $\boldsymbol{F}^g + \boldsymbol{F}^\sigma$
.
We add the above equation the time evolution equation for
 $R(-\boldsymbol{r})$
and define the scale energy
 $\mathcal{R}(\boldsymbol{r})$
as
 \begin{equation} \mathcal{R} = \frac {1}{4} \langle \rho {\boldsymbol{u}}\boldsymbol{\cdot }{\boldsymbol{u}}' + \rho '{\boldsymbol{u}}'\boldsymbol{\cdot }{\boldsymbol{u}} \rangle . \end{equation}
In the limit
 $r\to 0$
, the above definition of scale energy reduces to the unfiltered kinetic energy. Any generic term
 $\boldsymbol{Q}$
that appears on the right-hand side of the Navier–Stokes equation (for example the dissipation term
 $\mu {\nabla} ^2 {\boldsymbol{u}}$
) makes a contribution
 $\mathcal{Q}$
to the KHM relation that can be written as follows,
 \begin{equation} 4 \mathcal{Q} = \left \langle {\boldsymbol{u}}' \boldsymbol{\cdot }\boldsymbol{Q} + \rho {\boldsymbol{u}} \boldsymbol{\cdot }\frac {\boldsymbol{Q}'}{\rho '} + {\boldsymbol{u}} \boldsymbol{\cdot }\boldsymbol{Q}' + \rho ' {\boldsymbol{u}}' \boldsymbol{\cdot }\frac {\boldsymbol{Q}}{\rho } \right \rangle \!. \end{equation}
There are essentially two contributions to the right-hand side above, corresponding to terms of type velocity dotted with force, and momentum dotted with acceleration. We can also rewrite the above expression in terms of increments. Let
 $\delta$
represent increments in any quantity
 $\psi$
, defined as
 \begin{equation} \delta \psi (\boldsymbol{x},\,\boldsymbol{r}) = \psi (\boldsymbol{x}+\boldsymbol{r}) - \psi (\boldsymbol{x}). \end{equation}
It is then straightforward to check
 \begin{equation} \left \langle \delta {\boldsymbol{u}} \boldsymbol{\cdot }\delta \boldsymbol{Q}\right \rangle = \left \langle {\boldsymbol{u}}'\boldsymbol{\cdot }\boldsymbol{Q}' + {\boldsymbol{u}}\boldsymbol{\cdot }\boldsymbol{Q} - {\boldsymbol{u}}'\boldsymbol{\cdot }\boldsymbol{Q} - {\boldsymbol{u}}\boldsymbol{\cdot }\boldsymbol{Q}'\right \rangle \!. \end{equation}
The first two terms are identical after averaging over the entire box, and the last two terms correspond to the first and third terms of (A10) (with an extra minus sign here). Therefore, we can write
 \begin{equation} \mathcal{Q} = \langle {\boldsymbol{u}}\boldsymbol{\cdot }\boldsymbol{Q}\rangle - \frac {1}{4} \left [\left \langle \delta {\boldsymbol{u}} \boldsymbol{\cdot }\delta \boldsymbol{Q} \right \rangle + \left \langle \delta (\rho {\boldsymbol{u}})\boldsymbol{\cdot }\delta \left (\frac {\boldsymbol{Q}}{\rho }\right ) \right \rangle \right ]\!. \end{equation}
By writing the
 $\mathcal{Q}$
contribution like this, we relate the large-scale contributions (left side) with the residual contributions (right side in brackets). Further, the nonlinear term can be written as divergence of a third-order structure function
 \begin{equation} 4 \mathcal{N} = \left \langle -{\boldsymbol{u}}' \boldsymbol{\cdot }(\boldsymbol{\nabla }\boldsymbol{\cdot }\rho {\boldsymbol{u}} {\boldsymbol{u}}) - \rho {\boldsymbol{u}} \boldsymbol{\cdot }(\boldsymbol{\nabla }\boldsymbol{\cdot }{\boldsymbol{u}}' {\boldsymbol{u}}') - {\boldsymbol{u}} \boldsymbol{\cdot }(\boldsymbol{\nabla }\boldsymbol{\cdot }\rho ' {\boldsymbol{u}}' {\boldsymbol{u}}') - \rho '{\boldsymbol{u}}' \boldsymbol{\cdot }(\boldsymbol{\nabla }\boldsymbol{\cdot }{\boldsymbol{u}} {\boldsymbol{u}})\right \rangle. \end{equation}
Consider now the following expression:
 \begin{equation} \boldsymbol{\nabla} _r\boldsymbol{\cdot }\langle [\delta (\rho {\boldsymbol{u}})\boldsymbol{\cdot }\delta {\boldsymbol{u}} \delta {\boldsymbol{u}} ]\rangle . \end{equation}
The expansion of the above term gives us 8 terms
 \begin{align} \boldsymbol{\nabla} _r\boldsymbol{\cdot }\langle [\delta (\rho {\boldsymbol{u}})\boldsymbol{\cdot }\delta {\boldsymbol{u}} \delta {\boldsymbol{u}} ]\rangle &= \boldsymbol{\nabla} _r \boldsymbol{\cdot }\langle [ \rho '{\boldsymbol{u}}'\boldsymbol{\cdot }{\boldsymbol{u}}'{\boldsymbol{u}}'-\rho '{\boldsymbol{u}}'\boldsymbol{\cdot }{\boldsymbol{u}}'{\boldsymbol{u}} - \rho '{\boldsymbol{u}}'\boldsymbol{\cdot }{\boldsymbol{u}}{\boldsymbol{u}}' - \rho {\boldsymbol{u}}\boldsymbol{\cdot }{\boldsymbol{u}}'{\boldsymbol{u}}' \nonumber \\ &\quad +\rho '{\boldsymbol{u}}'\boldsymbol{\cdot }{\boldsymbol{u}}{\boldsymbol{u}} + \rho {\boldsymbol{u}}\boldsymbol{\cdot }{\boldsymbol{u}}'{\boldsymbol{u}} + \rho {\boldsymbol{u}}\boldsymbol{\cdot }{\boldsymbol{u}}{\boldsymbol{u}}' -\rho {\boldsymbol{u}}\boldsymbol{\cdot }{\boldsymbol{u}}{\boldsymbol{u}}] \rangle. \end{align}
Note that the first and last terms cancel exactly after averaging. Terms 2 and 7 also vanish because of incompressibility constraint. The remaining terms can be seen to be exactly
 $4\mathcal{N}$
, by noting that
 \begin{equation} \langle \boldsymbol{\nabla} _r \boldsymbol{\cdot }(\rho '{\boldsymbol{u}}') \boldsymbol{\cdot }{\boldsymbol{u}}{\boldsymbol{u}} \rangle = \langle \boldsymbol{\nabla }\boldsymbol{\cdot }(\rho '{\boldsymbol{u}}') \boldsymbol{\cdot }{\boldsymbol{u}}{\boldsymbol{u}} \rangle = -\langle \rho '{\boldsymbol{u}}' \boldsymbol{\cdot }\boldsymbol{\nabla }\boldsymbol{\cdot }{\boldsymbol{u}}{\boldsymbol{u}} \rangle , \end{equation}
hence, finally,
 \begin{equation} \mathcal{N} = \frac {1}{4}\boldsymbol{\nabla} _r \boldsymbol{\cdot }\langle \delta (\rho {\boldsymbol{u}})\boldsymbol{\cdot }\delta {\boldsymbol{u}}\,\delta {\boldsymbol{u}}\rangle . \end{equation}
Here, the divergence operator acts on the scale-space coordinates
 $r$
, not the physical-space coordinates. The KHM relation for incompressible variable-density flows then is
 \begin{equation} \partial _t \mathcal{R}(\boldsymbol{r}) = \mathcal{N}(\boldsymbol{r}) + \mathcal{D}(\boldsymbol{r}) + \mathcal{P}(\boldsymbol{r}) + \mathcal{F}^g(\boldsymbol{r}) + \mathcal{F}^\sigma (\boldsymbol{r}), \end{equation}
with
 $\mathcal{R}(\boldsymbol{r}) = ({1}/{4}) \langle \rho {\boldsymbol{u}}\boldsymbol{\cdot }{\boldsymbol{u}}' + \rho '{\boldsymbol{u}}'\boldsymbol{\cdot }{\boldsymbol{u}} \rangle$
. The shell average of this quantity is
 $\mathcal{R}(r)$
, which represents the cumulative energy in eddies larger than
 $r$
. In the above derivation, we did not assume either homogeneity or isotropy. The above derivation can also be derived by interpreting
 $\langle (\ldots )\rangle$
as ensemble averaging if the flow is assumed to be homogeneous, as is the approach in Frisch (Reference Frisch1995).
Appendix B. Buoyancy contribution in F1–F4 definitions
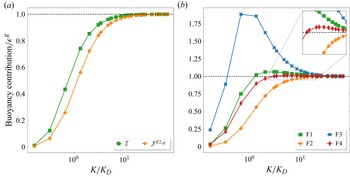
We expand here on buoyancy contributions in all the definitions F1-F4 as presented in § 3. We note that the first (monotonic) part of buoyancy contribution in F1, that is,
 $\mathcal{I}_K$
(4.4) is close to the Favre contribution at all filtering wavenumbers, as shown in figure 8. The second part of the buoyancy contribution in F1 is
 $\mathcal{J}_K$
(4.4). The form of
 $\mathcal{J}_K$
is similar to the buoyancy contribution in F2 except that it has
 $\overline {(1/\rho )}_K$
instead of
 $1/\overline {\rho }_K$
in the latter (3.16). By Jensen’s inequality,
 $\overline {(1/\rho )}_K\ge 1/\overline {\rho }_K$
(point-wise) for all
 $K$
, when filtering is interpreted as a local averaging operation (Aluie Reference Aluie2013). Indeed, at the interface,
 $\overline {(1/\rho )}_K\sim 1/\rho _B \gg 1/\overline {\rho }_K\sim 1/\rho _L$
in the limit
 ${At}\to 1$
. Consequently, in comparison with F2, the interface is weighted more in the buoyancy contribution for definition F1. Therefore, the difference between the two definitions is expected to become larger as the Atwood number becomes larger.
(a) Comparison of the monotonic part of buoyancy contribution
 $\mathcal{I}_K$
in
 $\tt F1$
and the buoyancy contribution
 $\mathcal{F}^{{\tt F2},\, g}_K$
(left) and (b) the buoyancy contribution for definitions F1–F4 (right). Both plots are for run R2.

Now we consider the four definitions F1-F4 as defined in § 3. A similar version of the above argument suggests that the buoyancy contribution
 $\mathcal{F}^g_K$
in the F1, F3 and F4 definitions is a non-monotonic function of the filtering wavenumber
 $K$
, and becomes larger than
 $\epsilon ^g$
for some
 $K$
in the
 ${At}\to 1$
limit. We verify this in figure 8 for run R2. These results indicate that F2 definition for the scale-dependent kinetic energy is the most suitable for multi-phase flows in the large Atwood number limit, irrespective of the Galilei number.