


INTRODUCTION
A speaker’s fundamental frequency (F0) conveys both nonlinguistic and linguistic information. This includes emotion and speaker idiosyncrasies, as well as language-specific pragmatic, grammatical, and lexical information (see Beckman, Reference Beckman1986; Gussenhoven, Reference Gussenhoven2004). For learners of a second (L2) or third (L3) language, speech perception in the target language can involve two challenges related to pitch, the perceptual correlate of F0: (a) learners must discriminate new language-specific pitch patterns (So & Best, Reference So and Best2010, Reference So and Best2014); and (b) learners must weight pitch cues in accordance with their language-specific informativeness and functional load (Holt & Lotto, Reference Holt and Lotto2006; Surendran & Niyogi, Reference Surendran, Niyogi and Thomsen2006).
For example, spoken English demonstrates pitch rise and fall in intonation patterns that are not fixed to syllables or words (Cruttenden, Reference Cruttenden1997). These patterns typically convey pragmatic information at a postlexical level (Beckman & Pierrehumbert, Reference Beckman and Pierrehumbert1986; Ladd, Reference Ladd2008). As a result, English pitch cues carry a relatively low functional load (Van Lancker, Reference Van Lancker1980) in that they are informative for the identification of less than 1% of English words (Shibata & Shibata, Reference Shibata and Shibata1990).
In contrast, pitch variations in Mandarin Chinese (hereafter “Mandarin”) convey lexical information. To accurately perceive that a Mandarin speaker said “four” and not “death,” a listener must discriminate between the syllable si spoken with a falling pitch (“four”) and the same syllable spoken with a low-dipping pitch (“death”). The four discrete Mandarin pitch patterns or tones are informative for the identification of roughly 70% of Mandarin words (Shibata & Shibata, Reference Shibata and Shibata1990), causing Mandarin tones to carry a functional load as high as that of Mandarin vowels (Surendran & Levow, Reference Surendran, Levow, Bel and Marlien2004). Unsurprisingly, Mandarin tone discrimination and categorization are initially challenging for most nonnative listeners because pitch perception is affected by L1 phonetic, phonemic, and phonotactic properties (Hallé, Chang, & Best, Reference Hallé, Chang and Best2004; Wong & Perrachione, Reference Wong and Perrachione2007; Wu, Munro, & Wang, Reference Wu, Munro and Wang2014). Yet, a listener’s sensitivity to pitch is adaptive; categories can be learned and cue weighting typically changes over time (e.g., Hao, Reference Hao2012; Wang, Spence, Jongman, & Sereno, Reference Wang, Spence, Jongman and Sereno1999).
The present study examines nonnative listeners’ perception of Japanese pitch accent in the context of L2/L3 classroom learning. Unlike previous studies that have examined participants’ perceptual learning of pitch through short lab-based training (e.g., Saito & Wu, Reference Saito and Wu2014; Wayland & Guion, Reference Wayland and Guion2004; Wayland & Li, Reference Wayland and Li2008), we test participants engaged in classroom learning of different L2/L3s that vary in how pitch cues inform word discrimination. This serves as a more ecologically valid sample of L2/L3 learners who have acquired new lexical representations informed by pitch cues. Using an information-theoretic approach (e.g., Chang, Reference Chang2018; Wedel, Kaplan, & Jackson, Reference Wedel, Kaplan and Jackson2013), we test and model listeners’ discrimination of and sensitivity to Japanese pitch accent. We use Japanese as our test language for two reasons.
First, Japanese allows us to draw on the well-documented L2 pitch accent literature (e.g., Shport, Reference Shport, Heinrich and Sugita2008, Reference Shport2015, Reference Shport2016), including key cross-linguistic studies summarized in the following text. This body of work provides clear predictions regarding how a listener’s L1 affects Japanese pitch accent perception, as well as how L2/L3-Japanese learning can improve perception of pitch accent.
Second, the informativeness of Japanese pitch cues represent an intermediary point between that of English (lowest) and that of Mandarin (highest). This allows us to test groups for which Japanese pitch accent represents either an information value increase (L1-English) or decrease (L1-Mandarin). Additionally, Japanese allows us to compare how learning more or less informative pitch cues as an L2/L3 affects pitch accent perception. We compare how L1-English + L2-Mandarin classroom learners differ in their Japanese pitch accent discrimination from L1-English + L2-Japanese classroom learners. We also compare how L1-Mandarin listeners with and without L3-Japanese classroom experience differ in their Japanese pitch accent discrimination. This serves as a test of whether a listener’s sensitivity to pitch increases, decreases, or remains unchanged given L3 input in which pitch cues are less informative than they are in the L1.
PERCEPTION OF JAPANESE PITCH ACCENT BY L1 AND L2 LISTENERS
Japanese pitch accent (in Tokyo-type accent regions) is produced with sequences of high (H) and low (L) pitch cues combined with an accent (*). These cues are minimally spread across two moras, the primary timing unit in spoken Japanese (Vance, Reference Vance2008). For example, the two-mora hashi can carry three different lexical meanings as “chopsticks” (H*L: initial accented mora with a high pitch followed by a mora with a lower pitch), “bridge” (LH*: initial low pitch followed by an accented mora with a higher pitch), or “edge” (LH: initial low pitch followed by a higher pitch with neither mora accented). These accent categories are primarily cued by F0 rise/fall, though F0 peak, duration, and amplitude serve as secondary cues (Beckman, Reference Beckman1986; Hasegawa & Hata, Reference Hasegawa and Hata1992; Maniwa, Reference Maniwa2002).
Native listeners make use of pitch cues for speech segmentation and the discrimination of slightly less than one fifth of Japanese words (Cutler & Otake, Reference Cutler and Otake1999; Goss & Tamaoka, Reference Goss and Tamaoka2015; Otake & Cutler, Reference Otake and Cutler1999; Shibata & Shibata, Reference Shibata and Shibata1990). L2 learners of Japanese must therefore attend to pitch accent to become proficient listeners. In a series of dichotic listening studies, Wu, Tu, and Wang (Reference Wu, Tu and Wang2012) demonstrated that L1 linguistic experience affects L2 listeners’ perception of pitch accent. The researchers observed that L1-Mandarin listeners performed similar to L1-Japanese listeners because L1-Mandarin listeners heavily weight F0 movement information at the lexical level. L1-Mandarin listeners may have also perceptually assimilated pitch accents to Mandarin tone categories (e.g., So & Best, Reference So and Best2010, Reference So and Best2014). For instance, the HLL pitch accent may be perceptually similar to Mandarin Tone 4 given the two categories’ relatively similar F0 decrease over time. Mandarin tone, however, is manifested on a syllable whereas Japanese pitch accent is manifested on at least two moras. It is therefore unclear whether L1-Mandarin listeners automatically assimilate pitch accent to Mandarin tone categories.
In contrast, the L1-English listeners tested in Wu et al. (Reference Wu, Tu and Wang2012) did not resemble the L1-Japanese or L1-Mandarin listeners because L1-English listeners tend to perceive pitch accent (and lexical tones) as nonlinguistic units (Burnham & Mattock, Reference Burnham, Mattock, Bohn and Munro2007; Leather, Reference Leather, James and Leather1987; Stagray & Downs, Reference Stagray and Downs1993). Wu et al.’s findings corroborate previous L2 research that has shown L1-English listeners with no Japanese experience routinely discriminate pitch accent less accurately than L1-Japanese listeners (e.g., Goss, Reference Goss2018; Shport, Reference Shport, Heinrich and Sugita2008, Reference Shport2015, Reference Shport2016).
In Wu, Kawase, and Wang’s (Reference Wu, Kawase and Wang2017) follow-up dichotic listening study, the authors demonstrated that L2-Japanese experience improves L1-English listeners’ perception of Japanese pitch accent. After roughly one year of L2 classroom learning, L1-English + L2-Japanese listeners showed a shift toward more nativelike behavior. This finding supports previous lab-based L2-Japanese perceptual learning studies (e.g., Hirata, Reference Hirata1999; Minematsu et al., Reference Minematsu, Hirano, Nakamura and Oikawa2016). Taken together, Wu et al. (Reference Wu, Tu and Wang2012, Reference Wu, Kawase and Wang2017) established that while L1 background can constrain Japanese pitch accent perception, learners’ perception improves as a result of classroom L2 learning.
THE PRESENT STUDY
This study tests the hypothesis that a listener’s discrimination of and sensitivity to Japanese pitch accent reflects how F0 cues inform all known words rather than only Japanese-specific words. Because early stages of phonetic processing can involve activation of multiple languages in parallel through nonselective access (Dijkstra & Van Heuven, Reference Dijkstra and Van Heuven2002; Kroll & Stewart, Reference Kroll and Stewart1994; Spivey & Marian, Reference Spivey and Marian1999), including tonal and nontonal languages (Ortega-Llebaria, Nemoga & Presson, Reference Ortega-Llebaria, Nemoga and Presson2017; Shook & Marian, Reference Shook and Marian2016; Wang, Wang, & Malins, Reference Wang, Wang and Malins2017; Wu, Cristino, Leek, & Thierry, Reference Wu, Cristino, Leek and Thierry2013), a listener’s pitch perception may better reflect how F0 cues inform all lexical candidates than how F0 cues inform only candidates in the target language.
For example, an L1-English listener engaged in L2-Mandarin classroom learning will gradually encode new tonal minimal pairs. Compared to a monolingual L1-English listener, this L1-English + L2-Mandarin listener uses F0 information to identify a relatively large percentage of known words independent of the input. In theory, this predicts that L2-Mandarin listeners without Japanese experience should outperform proficiency-matched L1-English + L2-Japanese listeners in pitch accent discrimination because pitch cues inform a much larger proportion of Mandarin words than Japanese words (Shibata & Shibata, Reference Shibata and Shibata1990). Moreover, this nonselective, information-based account predicts that discrimination accuracy should not be affected by Japanese-specific categories. L2-Mandarin learners should discriminate all Japanese pitch accent categories equally well despite unfamiliarity with particular F0 rise/fall patterns. Finally, this account predicts that pitch perception is additive or cumulative. As a learner acquires more words in which pitch is an informative cue—irrespective of the language—overall sensitivity should improve in a linear manner.
This information-based model is juxtaposed with a purely language-specific, experience-based model of L2/L3 pitch perception. Such a model predicts that although adult L2/L3-Japanese listeners can approach L1-Japanese listeners’ accuracy, L2/L3 learners should never outperform L1 listeners. Moreover, L1-English + L2-Japanese listeners should be more accurate at discriminating Japanese pitch accent than L1-English + L2-Mandarin listeners because the latter group has no experience with Japanese speech. If L1/L2-Mandarin listeners assimilate rising/falling pitch accents to Mandarin rising/falling tone categories (e.g., So & Best, Reference So and Best2010), the LHL pitch accent serves as a critical comparison because it does not directly map to a Mandarin tone category; only listeners exposed to Japanese speech should be familiar with the LHL pitch pattern.
To investigate learners’ pitch perception given their L1/L2/L3 experience, we test six groups of listeners in a speeded-ABX Japanese pitch accent discrimination task. We test L1-English and L1-Japanese baseline groups and compare their results to two new groups of L1-English listeners undergoing either L2-Japanese or L2-Mandarin classroom learning. This allows for an examination of whether L1-English listeners’ sensitivity to pitch is better predicted by experience with Japanese-specific pitch cues or experience with more informative pitch cues independent of the language. We additionally test two groups of L1-Mandarin (+L2-English) listeners. The first group allows for an examination of whether L1-Mandarin sensitivity to Japanese pitch accent approaches that of L1-Japanese listeners despite the former group having no Japanese experience. The second L1-Mandarin group allows for a test of how L3-Japanese input affects listeners’ perception. That is, do L1-Mandarin listeners undergoing L3-Japanese classroom learning demonstrate even greater sensitivity to pitch cues in an additive manner or does L3-Japanese learning dampen L1-Mandarin listeners’ pitch perception because pitch cues are less informative in Japanese than they are in Mandarin?
EXPERIMENT
PARTICIPANTS
Six groups of participants (N = 15 per group; see Table 1) took part in the experiment. All non-L1-English participants spoke English as an L2 and were matched for English proficiency based on self-reported abilities and Test of English as a Foreign Language (TOEFL) or International English Language Testing System (IELTS) scores. All L1-Mandarin participants were from central or northern China and self-reported only speaking standard Mandarin and no other tonal dialect. All L1-Japanese speakers were from the Tokyo-type accent regions of Japan. The L1-English groups engaged in L2-Mandarin and L2-Japanese classroom learning were controlled for their respective level of L2 proficiency based on self-reported abilities, length of L2 study, and placement in comparable L2 intermediate courses. No participant had studied abroad in China or Japan. All L3-Japanese learners were drawn from the same advanced Japanese class. All L1-English participants had 2 years or less of previous secondary school instruction in Spanish, French, Latin, or German; no participant was currently studying or exposed to an L2. An adaptive pitch test (Mandell, Reference Mandell2018) was used to control for pure pitch perception. All 90 participants were able to reliably differentiate two tones at 16 Hz or lower (range: 1.4–16 Hz). All participants were undergraduate or graduate students and were paid or given class credit for their participation.
Participant information (group means)
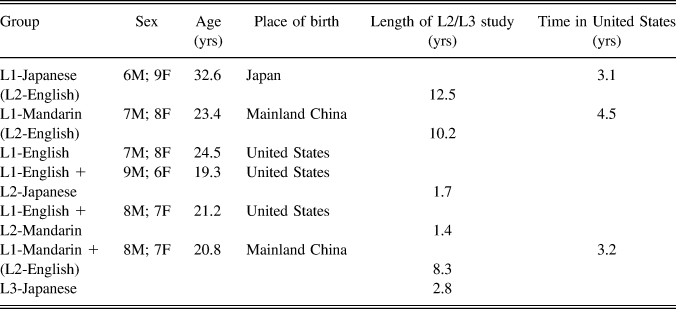
Table 2 summarizes each group’s relative experience with Japanese and estimated informativeness of pitch. Experience with Japanese was conceptualized as a value from 1 (none) to 4 (native) with L1-Japanese listeners scoring the highest (4) and L1-Mandarin, L1-English, and L1-English + L2-Mandarin listeners with no Japanese experience scoring the lowest (1). L1-English + L2-Japanese listeners were given (2) to account for their intermediate proficiency level, while L1-Mandarin + L3-Japanese listeners were given (3) to account for their advanced proficiency level.
Estimates of pitch informativeness and Japanese experience
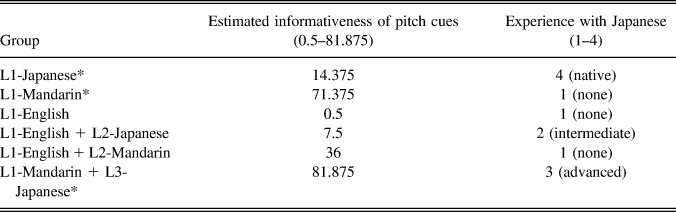
* indicates that all participants in the Group spoke English as an L2.
Pitch’s informativeness reflects Shibata and Shibata’s (1990; see also Tamaoka et al., Reference Tamaoka, Saito, Kiyama, Timmer and Verdonschot2014) calculated values. They computed informativeness by first identifying homophones in lexical corpora from the three languages and then determining which homophones differed by stress, pitch, or tone alone. Values were then averaged across word lengths, yielding estimates for each language: 0.5% for English, 14% for Japanese, and 71% for Mandarin. For intermediate L2-Mandarin and L2-Japanese learners, values were halved. For advanced L2-English and L3-Japanese learners, values were split into three fourths. Thus, the information values roughly captured the same four-step learning continuum used for measuring Japanese experience. For example, the informativeness value for the L1-Mandarin + L2-English + L3-Japanese group was calculated as: 71 (L1) + .375 (L2) + 10.5 (L3) = 81.375.
MATERIALS
Ten nonwords were created with a segmental structure of CVCVCV (see Online Supplementary Material for items and acoustic measurements). Nonwords were chosen to eliminate potential lexical frequency information that would unfairly bias L1/L2/L3 listeners. Each trimoraic stimulus was recorded by a female native speaker of Tokyo Japanese at 16 bits/44,100 Hz with three existent accent patterns: HLL, LHL, and LHH. For example, the nonword makana was produced with the accent patterns: MAkana (HLL), maKAna (LHL), and maKANA (LHH). All nonwords were produced in the carrier sentence ____to iimashita “(I) said ___” and extracted in Praat (Boersma & Weenink, Reference Boersma and Weenink2018). Acoustic means for each category aligned with accent categories used in previous studies (e.g., Cutler & Otake, Reference Cutler and Otake1999; Shport, Reference Shport2015, Reference Shport2016), and were thus presented to listeners without phonetic manipulation. The ABX stimuli consisted of three consecutive trimoraic nonwords with a 250 ms interstimulus interval. The first two nonwords, A and B, only differed in pitch accent for a total of 120 unique stimuli/trials (12 ABX patterns per target × 10 targets).
PROCEDURE
Participants were tested individually in a quiet room with headphones. After completing a language background questionnaire and the Tonometric pitch perception test, participants were given oral and printed instructions in their L1 by a bilingual English-Mandarin or English-Japanese experimenter. Participants were told to indicate through a button press whether the final sound (X) was similar to the first (A) or second (B) sound as quickly and accurately as possible. If participants did not respond within 2.5 seconds from the offset of X, the next trial would proceed automatically. AB ordering was counterbalanced across all trials with a 1 second intertrial interval. To familiarize participants with the task, two practice trials were presented using a practice stimulus of similar moraic structure and accent pattern as the stimuli. All stimuli were presented using Superlab 5.
STATISTICAL ANALYSES
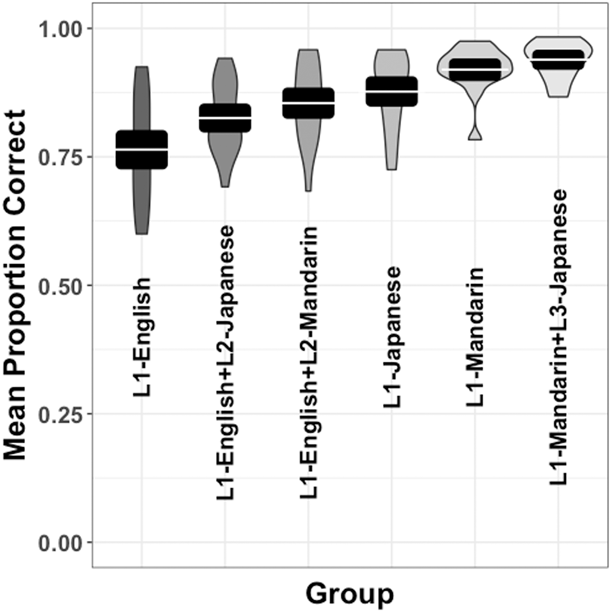
Figure 1 shows group violin plots, 95% confidence intervals (CIs; black box), and group means (white line within CI box). CIs for the six groups revealed that L1-English listeners were overall least accurate while L1-Mandarin + L3-Japanese listeners were overall most accurate. Participants’ overall time-out rate was less than 2%.
ABX discrimination accuracy by group. Black box indicates 95% confidence interval. White line within interval indicates group mean.
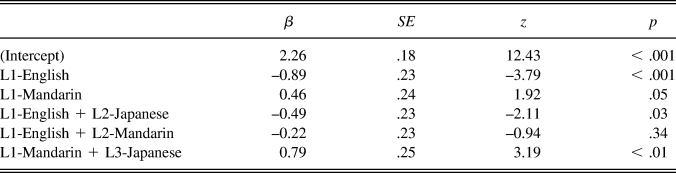
The ABX data were first analyzed in R (version 3.3) using the lme4 package (Bates, Mächler, Boker, & Walker, Reference Bates, Mächler, Bolker and Walker2015). A mixed-effects logistic regression model of the log odds of correct discrimination was built. The model contained subjects and items as random intercepts and a fixed-effect term for group with L1-Japanese as the reference level (treatment coded), allowing for five comparisons. The model [n = 10800, log-likelihood = –3879] is summarized in Table 3. Observed power as a 95% CI for the predictor group was calculated using the simr package (Green & MacLeod, Reference Green and MacLeod2016): [.88, 1].
Fixed-effect terms in mixed-effects model of the likelihood of ABX discrimination accuracy
R code: glmer(accuracy ∼ group + (1|subject) + (1|item), family = “binomial”)
The model indicated that L1-Japanese listeners were significantly more likely than L1-English and L1-English + L2-Japanese listeners to accurately discriminate pitch accent. No difference was found between the L1-Japanese and L1-English + L2-Mandarin listeners. The L1-Mandarin listeners were marginally more likely than L1-Japanese listeners to accurately discriminate pitch accent. The L1-Mandarin + L3-Japanese listeners were significantly more likely than the L1-Japanese listeners to accurately discriminate pitch accent.
To test planned comparisons not present in the main model, two additional models were built with different L1 reference levels and the inclusion of Japanese pitch accent type (LHL as the reference level, treatment coded). R code: glmer(accuracy ∼ group * accent + (1|subject) + (1|item), family = “binomial”). The model testing L1-English listeners as the reference level [n = 5400, log-likelihood = –2411] revealed that L1-English + L2-Japanese listeners were as likely as L1-English listeners to accurately discriminate pitch accent [β = 0.40, z = 1.74, p = .18]. In contrast, L1-English + L2-Mandarin listeners were significantly more likely than L1-English listeners to accurately discriminate pitch accent [β = 0.66, z = 2.80, p < .01]. A comparison between the two L2 groups calculated using least-square-means in the lsmeans package (Lenth, Reference Lenth2016) revealed that L1-English + L2-Japanese listeners did not differ from L1-English + L2-Mandarin listeners in their discrimination accuracy [β = 0.25, z = 1.07, p = .53]. Neither a main effect of accent type nor its interaction with group was significant at an alpha level of .05.
The model testing L1-Mandarin listeners as the reference level [n = 3600, log-likelihood = –849] revealed that L1-Mandarin listeners did not differ from L1-Mandarin + L3-Japanese listeners in their discrimination accuracy [β = 0.33, z = 1.42, p = .15]. Neither a main effect of accent type nor its interaction with group was significant at an alpha level of .05.
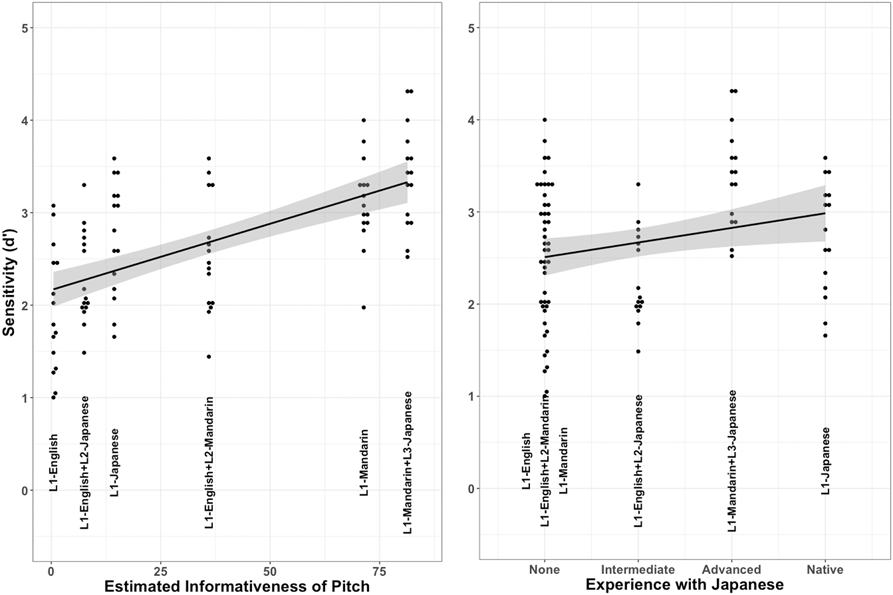
To model this overall pattern of responses, raw ABX data were converted to d-prime (d’), a measure of perceptual sensitivity that accounts for response bias (McNicol, Reference McNicol2005). The differencing model strategy (Hautus & Meng, Reference Hautus and Meng2002) was used to calculate d’; adjustments to d’ were not required because all participants performed above chance and no participant had a hit rate of 1. Participants’ d’ scores were analyzed in R by building two generalized linear models. The models contained a fixed-effect term for either experience with Japanese or estimated informativeness of pitch: R code: lm(dprime ∼ experience), lm(dprime ∼ informativeness). Values for these variables were taken from Table 2 corresponding to either language experience or Shibata and Shibata’s (1990) calculations of informativeness.
Figure 2 plots fits from each linear model (with standard error). Points represent individual d’ scores. The model testing informativeness better fit the data [β = 0.01, t = 7.06, p < .001; adjusted R 2 = .36; log-likelihood = –81; f2 = .56] than the model testing experience with Japanese [β = 0.15, t = 2.38, p = .02; adjusted R 2 = .06; log-likelihood = –98; f2 = .06].
Linear regression model fits (with SE).
RESULTS
We examined Japanese pitch accent perception in two groups of L1-English listeners undergoing either L2-Mandarin or L2-Japanese classroom learning. Our results indicate that even after more than one year of L2-Japanese classroom training, L1-English + L2-Japanese listeners’ pitch accent discrimination still resembled that of naïve L1-English listeners, and did not reach L1-Japanese abilities. In contrast, L1-English + L2-Mandarin listeners discriminated Japanese pitch accent as accurately as L1-Japanese listeners and more accurately than L1-English listeners.
We further examined two groups of L1-Mandarin (+ L2-English) listeners. L1-Mandarin listeners without Japanese experience discriminated pitch accent with nativelike abilities. L1-Mandarin + L3-Japanese listeners discriminated pitch accent significantly more accurately than L1-Japanese listeners, suggesting that sensitivity to pitch cues continues to increase for learners in an additive manner. This hypothesis was evaluated by building two linear regression models. The model testing sensitivity as a function of pitch’s informativeness accounted for relatively more of the observed variance and had a larger effect size than the model testing sensitivity as a function of experience with Japanese.
DISCUSSION
Our ABX discrimination results (Figure 1) confirmed previously reported effects of L1 affecting listeners’ Japanese pitch accent perception: L1-English listeners discriminated Japanese pitch accent less accurately than L1-Japanese listeners whereas L1-Mandarin listeners discriminated Japanese pitch accent marginally more accurately than L1-Japanese listeners (Goss, Reference Goss2018; Shport, Reference Shport, Heinrich and Sugita2008, Reference Shport2015, Reference Shport2016; Wu et al., Reference Wu, Kawase and Wang2017).
Previously reported L2-Japanese perceptual learning effects, however, were not replicated. One year of classroom learning was insufficient for L1-English + L2-Japanese listeners to approach nativelike levels of pitch accent perception; learners still resembled L1-English listeners without Japanese experience (cf., Goss, Reference Goss2018; Shibata & Hurtig, Reference Shibata, Hurtig and Han2008). Unexpectedly, the L2-Mandarin learners unfamiliar with Japanese speech reached nativelike discrimination accuracy. One interpretation of this finding is that Mandarin tone training facilitated Japanese pitch accent discrimination. Future research may test this hypothesis by examining whether training on unrelated languages in which the target cue is more informative results in improved perception of the (less informative) cue in the L2/L3. As an example, Vietnamese or Cantonese tone training may facilitate L2 learners’ Mandarin tone discrimination given the more informative tonal systems of these languages as compared to Mandarin’s (see Yip, Reference Yip2002).
This view of linguistic pitch learning also predicts that advanced L1-English + L2-Mandarin learners with a large enough lexicon of tonal minimal pairs (e.g., participants from Reference Pelzl, Lau, Guo and DeKeyserPelzl, Lau, Guo, & DeKeyser, 2018) may demonstrate a sensitivity to Japanese pitch accent that exceeds that of L1-Japanese listeners. Indeed, superior nonnative perception was observed in the present study: L1-Mandarin + L3-Japanese listeners discriminated Japanese pitch accent more accurately than L1-Japanese listeners. To our knowledge, this is the first reported evidence of “advantageous transfer” (Bohn & Best, Reference Bohn and Best2012; Chang, Reference Chang2018; Chang & Mishler, Reference Chang and Mishler2012) in which nonnative perception of pitch accent exceeded that of native Japanese listeners.
Taken together, our results motivate the claim that sensitivity to pitch accent reflects how pitch cues inform all words a listener knows in a nonselective, additive manner. Theoretically, this information-based model is in line with a cue-centric approach of perception and transfer (e.g., Chang, Reference Chang2018). How pitch informs words in an L1 and its relative functional load drive how F0 cues are initially weighted and transferred to an L2 (e.g., Schaefer & Darcy, Reference Schaefer and Darcy2014; Tremblay, Broersma, & Coughlin, Reference Tremblay, Broersma and Coughlin2017). During L2 acquisition, new pitch patterns are learned and F0 cue weighting changes as more words informed by pitch are acquired (Holt & Lotto, Reference Holt and Lotto2006). Importantly, this attunement to F0 cues appears to be additive. Sensitivity to pitch cues continues to increase during L3 acquisition. This view is compatible with models of L3 acquisition that posit any prior language experience contributes to subsequent acquisition, for example, the Cumulative Enhancement Model (Flynn, Foley, & Vinnitskaya, Reference Flynn, Foley and Vinnitskaya2004).
While this study serves as an initial investigation, we recognize limitations to our information-theoretic approach. Among them, we assume that L2 and L3 acquisition involve the same underlying mechanisms. Future work will need to quantify L2/L3 learners’ proficiency with more rigor and account for within-group learner variability (e.g., Chandrasekaran, Sampath, & Wong, Reference Chandrasekaran, Sampath and Wong2010; Perrachione, Lee, Ha, & Wong, Reference Perrachione, Lee, Ha and Wong2011). Our approach also assumes listeners activate representations in their L1 and L2 in parallel, including those representations informed primarily by pitch cues. While ample evidence indicates that L1-Mandarin listeners continue to heavily weight F0 contours during L2-English lexical processing (Ortega-Llebaria et al., Reference Ortega-Llebaria, Nemoga and Presson2017; Shook & Marian, Reference Shook and Marian2016; Wang et al., Reference Wang, Wang and Malins2017; Wu et al., Reference Wu, Cristino, Leek and Thierry2013; see also Tatsuno & Sakai, Reference Tatsuno and Sakai2005 for limited L1-Japanese evidence), it is an empirical question whether L2-Mandarin or L2-Japanese listeners change their weighting of English F0 cues as a result of undergoing L2 or L3 learning. Because L2 learning can impact the L1 even during early development (Bice & Kroll, Reference Bice and Kroll2015), L2/L3 pitch learning could theoretically modify how L1 pitch cues are weighted.
We acknowledge that the present results cannot fully falsify a phonotactic transfer account of prosodic categories or rule out any category-specific assimilation. This claim is difficult to adequately evaluate because F0 cues are manifested differently across the two languages: syllable (Mandarin) versus minimally two moras (Japanese). Evidence for tone category transfer in L2/L3 perception is inconsistent, with results varying given the participants, tasks, stimuli, and dependent measures (see Chang, Yao, & Huang, Reference Chang, Yao and Huang2017; Hallé et al., Reference Hallé, Chang and Best2004; Qin & Jongman, Reference Qin and Jongman2016; So & Best, Reference So and Best2010, Reference So and Best2014 among others). Model fits of our discrimination data suggest that all statistically significant increases were due to aggregate gains and were not driven by category-specific improvements. We note that the LHL pitch accent, which does not directly map to a Mandarin tone category, should have been L1-Mandarin and L2-Mandarin listeners’ least accurate category. This pattern was not found. Future studies can test whether the LHL pitch accent results in new category formation for L1/L2-Mandarin listeners (e.g., Flege, Reference Flege and Strange1995), how additional unfamiliar pitch patterns affect L1/L2/L3-Japanese listeners’ responses, and to what degree frequency distributions of pitch accent patterns may contribute to these results.
In conclusion, an L2 or L3 learner’s sensitivity to pitch is additive and appears to reflect how pitch informs discrimination of words in all known languages rather than in the target language only. These findings are in line with cue-centric views of perception and transfer, demonstrate potential advantageous transfer for tonal-L1 listeners, and highlight the cumulative role that pitch plays in language learning.
SUPPLEMENTARY MATERIAL
To view supplementary material for this article, please visit https://doi.org/10.1017/S0272263119000068



