INTRODUCTION
Tolo Harbour is a semi-enclosed and poorly flushed bay in the north-eastern part of Hong Kong. Nutrient loading and eutrophication of Tolo Harbour began in the 1970s. Frequent algal blooms and rapid deterioration of Tolo Harbour's water quality led to the initiation of various measures to reduce nutrient loading in 1987 (Holmes, Reference Holmes1988; Morton, Reference Morton1988). Improvement in water quality, including detectable decreases in nutrient levels and algal bloom occurrences, was achieved when a scheme to redirect partially treated sewage effluents from the Tolo Harbour catchment for final disposal in the ocean became fully implemented in 1998 (Chau, Reference Chau2007; Hong Kong Environmental Protection Department, 2009; Lie et al., Reference Lie, Wong, Lam, Liu and Yung2011).
The decrease in nutrient levels in Tolo Harbour was accompanied by changes in nutrient ratios, such as NO3:NH4, N:P and N:Si (Lie et al., Reference Lie, Wong, Lam, Liu and Yung2011). Changes in the nutrient concentrations and ratios could lead to shifts in the size structure and taxonomic composition of the phytoplankton community (Watson et al., Reference Watson, McCauley and Downing1997; Lie et al., Reference Lie, Wong, Lam, Liu and Yung2011), which would in turn affect the primary productivity as different phytoplankton groups have been found to have varying photosynthetic and growth rates (Agawin et al., Reference Agawin, Duarte and Agusti2000; Cermeño et al., Reference Cermeño, Marañón, Rodríguez and Fernández2005). Indeed, despite a decrease in the chlorophyll-a concentrations in Tolo Harbour, the densities of groups such as diatoms and cryptophytes have increased significantly as a result of recent changes in nutrient levels (Lie et al., Reference Lie, Wong, Lam, Liu and Yung2011). In addition to changes in the phytoplankton community, changes in the zooplankton community in Tolo Harbour have also been recorded. While small copepods of the genera Oithona and Paracalanus have always dominated the copepod community in Tolo Harbour (Wong et al., Reference Wong, Chan and Chen1993; Zhang & Wong, Reference Zhang and Wong2011), the abundance of copepods was much lower in samples taken in 2003–2004 than in samples taken before the full implementation of the nutrient reduction schemes in 1988–1990 (Zhang & Wong, Reference Zhang and Wong2011). The dominance of small copepods and the decrease in copepod abundance may have significant impact on the size structure of the phytoplankton community (Bruno et al., Reference Bruno, Staker, Sharma and Turner1983; Bergquist et al., Reference Bergquist, Carpenter and Latino1985; Vanni, Reference Vanni1987). Previous studies of marine plankton in Tolo Harbour have focused mainly on the taxonomic composition and seasonal dynamics of phytoplankton (Lam & Ho, Reference Lam and Ho1989; Wong & Wong, Reference Wong and Wong2004) and copepods (Wong et al., Reference Wong, Chan and Chen1993; Zhang & Wong, Reference Zhang and Wong2011), with little or no information on the phytoplankton primary and copepod production in Tolo Harbour.
Phytoplankton and zooplankton form the lower trophic levels of the marine food webs. Data on phytoplankton and zooplankton production rates, and information on the efficiency by which energy fixed by phytoplankton is transferred to copepod grazers are essential to the better understanding of the pelagic food web and for the estimation of energy budgets (Uye et al., Reference Uye, Kuwata and Endo1987). Information on the transfer efficiency and copepod production is also important because copepods are important prey of fish (Huntley & Lopez, Reference Huntley and Lopez1992; Turner, Reference Turner2004). In addition, information on the correlations between the phytoplankton and copepod production and transfer efficiency may provide a simple and direct way of estimating one from the other in the future (Ara & Hiromi, Reference Ara and Hiromi2007).
The recent increase in the density of diatoms (Lie et al., Reference Lie, Wong, Lam, Liu and Yung2011) and decrease in the abundance of copepods (Zhang & Wong, Reference Zhang and Wong2011) point to the possibility of an increasingly ineffective control of phytoplankton by copepod grazers in Tolo Harbour, and a decrease in the transfer of phytoplankton primary production up the pelagic food web by herbivores. The objective of this study is two-fold. First, phytoplankton primary production and copepod secondary production in Tolo Harbour were measured, and the data were used to estimate the transfer efficiency between these two basal trophic levels. Second, the size composition of the phytoplankton community was studied with the aim to provide a better understanding of its relations to the copepod community and copepod production in Tolo Harbour.
MATERIALS AND METHODS
Sampling
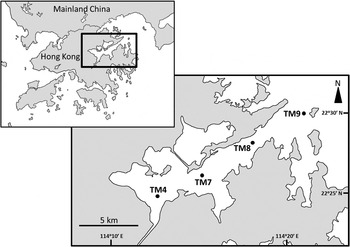
The study was carried out between February 2008 and March 2009 in Tolo Harbour, Hong Kong. Samples were collected from four sampling stations (TM4: 22o26′N 114o13′E; TM7: 22o27′N,114o16′E; TM8: 22o28′N 114o18′E; TM9: 22o30′N 114o21′E) at intervals of one to two months (Figure 1). Water depth at the sampling stations ranged from 7 m at TM4, the innermost station, to 18 m at TM9, the outermost station. Temperature and salinity were recorded at the surface (0.5 m) using a YSI 6600 V2-2 Multiparameter Water Quality Sonde (YSI Incorporated, Yellow Springs, USA). Water samples for measurement of chlorophyll-a (Chl a) and inorganic nutrient concentrations were taken at each sampling station at 0.5 m with a Van Dorn-type water bottle, passed through 200 μm filters to remove debris and zooplankton, and stored at −20oC before processing. Duplicate zooplankton samples were taken at each station by hauling a conical plankton net (0.5 m mouth diameter, 125 μm mesh size) from 2 m above the sea bottom to the surface and immediately preserved in a 4% formaldehyde solution.
Map of Tolo Harbour showing the four sampling stations.

Laboratory analysis
In the laboratory, water samples were passed through filters (20 μm nylon mesh filters and 3 μm MilliporeTM IsoporeTM membrane filters) to obtain fractions containing particles >20 μm, 3−20 μm and <3 μm. Chl a concentration was measured with a Turner Designs 10-AU fluorometer (Sunnyvale, USA) after extraction with 90% acetone for 24 h. Inorgainc nutrients (nitrate, nitrite, ammonia phosphate and silicate) in water samples were measured using a Skalar San + + Automatic Ion Analyzer (Breda, The Netherlands). Total inorganic nitrogen (TIN) concentrations were calculated as the sum of nitrate, nitrite and ammonia concentrations. The densities of adults and copepodites of calanoid, cyclopoid and harpacticoid copepods in each zooplankton sample were estimated by counting at least 5% of the original samples under a stereomicroscope. The body size distribution of the copepods was measured to provide a database for the estimation of copepod production (See ‘Measurement of copepod production’ below). For calanoids and cyclopoids, the cephalothorax length of 50 randomly sorted adults and copepodites were measured under a stereomicroscope equipped with an ocular micrometer. For harpacticoids, the total body length of only 30 individuals were measured due to their low abundance in many samples.
Measurement of phytoplankton primary production
Phytoplankton primary production was measured using the light/dark bottle dissolved oxygen method (Parsons et al., Reference Parsons, Maita and Lailli1984). Water samples from depths receiving 100%, 50%, 20% and 1% of the photon fluxes at sea surface were collected from each station using a Van Dorn-type water bottle. Water samples from each depth were transferred into two light and two dark glass BOD bottles, and the bottles were incubated in situ for 3−4 h at the same location where the water sample was collected. Dissolved oxygen concentrations in the light and dark bottles were measured before and after incubation using a YSI oxygen meter with a BOD probe.
Phytoplankton gross primary production (P G) and net primary production (P N) were calculated from the equations (Parsons et al., Reference Parsons, Maita and Lailli1984):
 $$P_{G} = C_{L} + C_{D}$$
 $$P_{N} = C_{L}$$
where C L is the oxygen concentration difference before and after incubation in the light bottle, and C D is the oxygen concentration difference before and after incubation in the dark bottle.
Phytoplankton primary production estimated from oxygen concentrations (P = P G or P N) was converted to carbon production (P C) using the equation (Parsons et al., Reference Parsons, Maita and Lailli1984):
 $$P_{C} =P \times 12/32 \times 1000 \times PQ$$
where PQ is the photosynthetic quotient. A value of 1.2 was used in this study because the ammonia concentration in the water was found to be higher than the nitrate concentration (Holligan et al., Reference Holligan, Williams and Purdie1984).
The phytoplankton gross or net primary production measurements were converted to daily phytoplankton primary production (P D) by extrapolation using the equation (Schulz et al., Reference Schulz, Koschel, Reese and Mehner2004):
 $$P_{D}=P_{C} \times QG/Q_{exp}$$
where QG is the daily global solar radiation and Q exp is the global solar radiation during the incubation period. All solar radiation data were provided by the Hong Kong Observatory. The phytoplankton primary productions for the four depths were integrated (Ara & Hiromi, Reference Ara and Hiromi2007) to give a depth-integrated gross primary production (DGP) or net primary production (DNP).
Measurement of copepod production
The dry weight of copepods was estimated from the copepod body lengths using length–weight regression equations. Dry weight was further converted to carbon weight to determine the production from copepod grazing.
Zooplankton samples for the construction of the length–weight regressions for calanoid and cyclopoid copepods were collected at TM8 in August 2007 and preserved in 2% glutaraldehyde (Kimmerer & McKinnon, Reference Kimmerer and McKinnon1986). Copepods in both adult and copepodite stages were first separated into calanoids and cyclopoids, then further sorted into 13 and 7 size categories, respectively, according to their cephalothorax length. Each size category contained at least 20 individuals. The sorted copepods were rinsed with Milli-Q water, dried in an oven at 60oC for at least 48 hours before being weighed on a CAHN microbalance (Cenitos, USA) (precision to 0.0001 mg).
Zooplankton collected at TM8 in August 2007 was also used to determine the relationship between dry weight and carbon weight. Samples collected were immediately frozen in liquid nitrogen and stored at −80°C until analysis. In the laboratory, samples were immersed in 0.22 μm filtered seawater and copepods were separated into calanoids and cyclopoids. Since each analysis of carbon weight required a minimum of 2 mg of specimens, each sample consisted of at least 1000 calanoid copepods or 2000 cyclopoid copepods. The copepods were freeze-dried, placed in a pre-weighed aluminium foil boat and burned in the furnace of a Perkin Elmer CHNS/O 2400 Analyzer (Waltham, USA) at 500oC. The carbon weight of the copepods was measured as the release of carbon dioxide. Carbon content, as a percentage of dry weight, was used to determine copepod carbon weight in all samples.
Due to the limited number of harpacticoids in most samples, the length–weight regression equation of Ara & Hiromi (Reference Ara and Hiromi2007) was used:
 $$W_{d}=8.51 \times 10^{-10}\ {\rm BL}^{3.26}$$
where W d is the dry weight and BL is the total body length. Carbon was assumed to account for 47% of the dry weight according to Hirota (Reference Hirota1981).
The biomass in carbon (B C) was calculated for each group of copepod using the equation (Uye et al., Reference Uye, Nagano and Shimizu2000):
 $$B_{C}=D_{C} \times W_{C}$$
where D C is the density of the copepod group, and W C is the mean carbon weight per individual of the copepod group.
The production rate of each group of copepods (P Cop) was estimated by the equation (Uye et al., Reference Uye, Nagano and Shimizu2000):
 $$P_{Cop}=B_{C} \times G$$
where G, the individual weight-specific growth rate, was estimated for copepodites and adults of all copepod groups using the model of Hirst & Lampitt (Reference Hirst and Lampitt1998):
 $$log_{10}G=0.0208T \ndash 0.3221log_{10}W_{C} \ndash 1.1408$$
where T is the ambient temperature (oC). Total copepod production (CP) is the sum of the production from all three groups of copepods. For comparisons with the depth-integrated phytoplankton primary productions, the depth-integrated total copepod production (DCP) was estimated by multiplying CP to the length of the water column sampled (Ara & Hiromi, Reference Ara and Hiromi2007).
The transfer efficiency (TE) from phytoplankton primary production to copepod production was calculated using the following equation (Ara & Hiromi, Reference Ara and Hiromi2007):
 $${\rm TE}={\rm DCP}/{\rm DNP} \times 100 \percnt$$
Statistical analysis
Seasonal and spatial variations in physico-chemical parameters such as temperature and salinity, and biological parameters such as total Chl a concentration, Chl a concentrations in different size fractions, contribution of Chl a in different size fractions to total Chl a concentrations, phytoplankton primary production and copepod production were tested using two-way ANOVA with post-hoc Tukey multiple comparisons. The study period was divided into four seasons, with December to February as winter, March to May as spring, June to August as summer, and September to November as autumn. Relationship between variables was tested using Pearson's correlation.
RESULTS
Seasonal and spatial variation
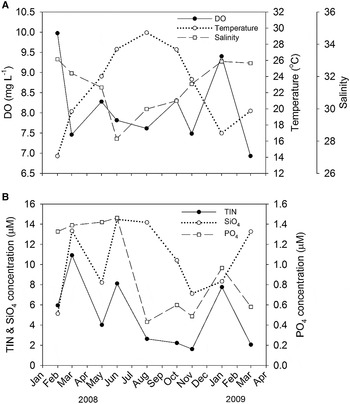
Samples were not taken at TM8 in March 2008 due to technical difficulties. Temperature, salinity and dissolved oxygen (DO) differed significantly between summer and winter (P < 0.05; Figure 2), but not among sampling stations (P > 0.05). The concentration of SiO4 concentrations was significantly higher in summer than in winter and autumn (P < 0.01), but no significant spatial and seasonal trends were found in the concentrations of total inorganic nitrogen (TIN) and PO4 (Figure 2).
Temporal variation in the surface physico-chemical parameters measured: (A) temporal variations in the surface temperature, salinity and dissolved oxygen (DO); (B) temporal variations in the surface total inorganic nitrogen (TIN), PO4 and SiO4 concentrations. Data are presented as the mean of all four stations.

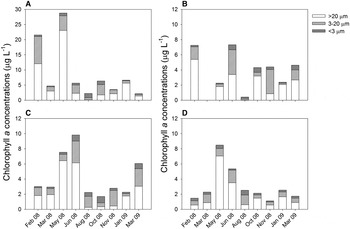
Total Chl a concentrations over the entire study period averaged 9.07 μg l−1 at TM4, 4.3 μg l−1 at TM7, 4.1 μg l−1 at TM8 and 3.07 μg l−1 at TM9 (Figure 3). There was a tendency for Chl a concentrations to increase toward the inner part of the bay, although spatial and seasonal differences in Chl a concentrations were not statistically significant (P > 0.05). Algal blooms, indicated by discoloration of the surface water, were detected at TM4 in February and May 2008. In both cases, total Chl a concentrations were >20 μg l−1. Over the entire study period, Chl a concentrations varied from 0.03 to 23.06 µg l−1 in the >20 µm size fraction, 0.18 to 8.99 µg l−1 in the 3–20 µm size fraction, and 0.09 to 1.39 µg l−1 in the <3 µm size fraction.
Temporal variations in the surface chlorophyll-a concentrations in the >20 µm, 3–20 µm, and <3 µm size fractions at the four sampling stations: (A) temporal variations in the surface chlorophyll-a concentrations at Station TM4; (B) temporal variations in the surface chlorophyll-a concentrations at Station TM8; (C) temporal variations in the surface chlorophyll-a concentrations at Station TM7; (D) temporal variations in the surface chlorophyll-a concentrations at Station TM9.

The phytoplankton assemblage was usually dominated by the >20 μm size fraction (Figure 3). Averaged over the entire study period, the percentage contribution of Chl a by each of the three size fractions to total Chl a concentrations (hereafter known as ‘contribution’) was relatively similar among the four sampling stations. On average, the >20 μm, 3−20 μm and <3 μm size fractions accounted for ~50%, ~35% and ~12% of the total Chl a concentrations, respectively. For each size fraction, the contribution did not differ significantly among stations (P > 0.05). The contribution of the >20 μm size fraction was significantly higher in winter and spring than in summer (P < 0.01). Contributions of the other two smaller size fractions did not vary seasonally (P > 0.05). Algae >20 µm were primarily responsible for the algal blooms, accounting for 56% and 80% of the total Chl a concentration at TM4 in February and May 2008, respectively. The relative importance of the <3 µm size fraction peaked in August 2008, especially at TM4, where it accounted for 62% of total Chl a concentration, while contribution from the >20 µm size fraction dropped to 9%.
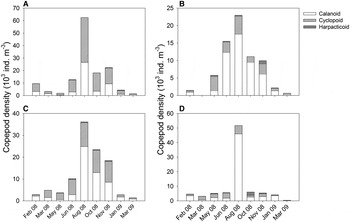
Both calanoids and cyclopoids were numerous in Tolo Harbour (Figure 4). Similar to Chl a concentrations, there was a trend of shoreward increase in copepod density, although statistically significant spatial differences were found only in the densities of cyclopoid copepods, which were higher at TM4 than at TM8 and TM9 (P < 0.01). Significant seasonal differences were found in the densities of all three groups of copepods. Calanoid and cyclopoid densities were significantly higher in summer than in spring and winter (P < 0.05), while the density of harpacticoids was significantly higher in autumn than in spring and winter (P < 0.05).
Temporal variations in the density of calanoid, cyclopoid and harpacticoid copepods at the four sampling stations: (A) temporal variations in copepod density at Station TM4; (B) temporal variations in copepod density at Station TM8; (C) temporal variations in copepod density at Station TM7; (D) temporal variations in copepod density at Station TM9.

The copepod community in Tolo Harbour was dominated by small species. Over the entire study period at all sampling stations, the mean cephalothorax length was ~0.4 mm for calanoids and ~0.3 mm for cyclopoids, and the mean body length for harpacticoids was ~0.5 mm. The mean sizes of both calanoid and cyclopoid copepods were significantly larger at TM9 and TM8 than at TM4 (P < 0.05), and significantly larger in spring than in summer and autumn (P < 0.05).
Phytoplankton primary and copepod production and transfer efficiency
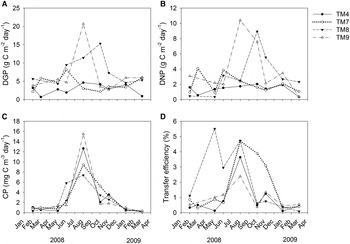
The depth-integrated phytoplankton primary production at TM9 for March 2008 was not available due to loss of incubation bottles. The depth-integrated phytoplankton gross primary production (DGP) remained <5 g C m−2 day−1 throughout the study period at TM4, but exhibited much greater seasonal variations at the three outer stations (Figure 5). In general, DGP values did not have significant seasonal variations (P > 0.05), but were significantly higher at TM8 than at the other sampling stations (P < 0.05). In comparison, the depth-integrated phytoplankton net primary production (DNP) did not have significant spatial or seasonal variations (P > 0.05) (Figure 5).
Temporal variations in production and transfer efficiency at the four sampling stations: (A) temporal variations in the depth-integrated gross primary production (DGP); (B) temporal variations in the depth-integrated net primary production (DNP); (C) temporal variations in the total copepod production (CP); (D) temporal variations in the transfer efficiency between DNP and CP.

The relationship between the cephalothorax length (BL in μm) and dry weight (DW in μg) of calanoid copepods was expressed by the regression equation:
 $${\rm DW}=0.020385\, {\rm BL} \ndash 4.5273\ \lpar r^2=0.96\rpar$$
while that for cyclopoid copepods was expressed by the equation:
 $${\rm DW}=0.0086623\, {\rm BL} \ndash 1.6567\ \lpar r^2=0.98\rpar$$
Carbon accounted for 48% and 40% of the dry weight of calanoids and cyclopoids, respectively. The biomass of both calanoid and cyclopoid copepods was highest in summer (P < 0.05), while the biomass of harpacticoid copepods was significantly higher in autumn than in winter and spring (P < 0.05). This is not surprising as biomass was a function of density. The total copepod production (CP) varied greatly from 0.12 mg C m−3 day−1 at TM9 in March 2009 to 15.47 mg C m−3 day−1 at TM9 in August 2008 (Figure 5). CP did not differ among sampling stations, but was significantly higher in summer than in winter and spring (P < 0.01).
The transfer efficiency (TE) from DNP to DCP was low, ranging from 0.09% to 5.51% (Figure 5). The TE did not differ significantly among sampling stations, but values recorded during summer were significantly higher than values recorded in winter (P < 0.05).
Correlation analyses
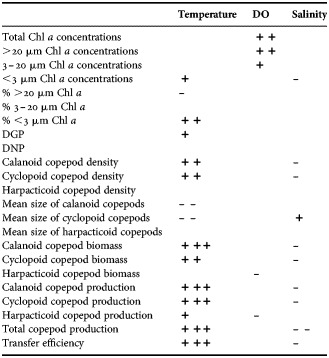
Correlations among physico-chemical, phytoplankton, and copepod variables were tested using Pearson's correlation analyses (Table 1). Temperature correlated positively with both the Chl a concentration and contribution of the <3 µm size fraction (r = 0.427–0.451; P < 0.05; N = 35), and negatively with the contribution of >20 µm size fraction (r = −0.427–−0.134; P < 0.05; N = 35). In general, temperature correlated positively with the density, biomass and production of calanoid and cyclopoid copepods (r = 0.476–0.590; N = 35), but negatively with copepod size (r = −0.482–−0.129; P < 0.05; N = 35). Temperature also correlated positively with DGP, CP, and TE (r = 0.345–0.577; P < 0.05; N = 34–35). The DO correlated positively with total Chl a concentration and Chl a concentrations from the >20 µm and 3–20 µm size fractions (r = 0.386–0.524; P < 0.05; N = 35), and negatively with harpacticoid copepod biomass and production (r = −0.401–−0.396; P < 0.05; N = 26). Salinity correlated negatively with certain copepod parameters (P < 0.05), such as densities and biomass (r = −0.399–−0.335; N = 35), but positively with the mean size of cyclopoid copepods (r = 0.378; P < 0.05; N = 35).
Pearson's correlation analyses of physico-chemical variables against various phytoplankton and copepod variables. ‘DGP’ and ‘DNP’ represent depth-integrated gross primary production and depth-integrated net primary production, respectively. ‘ + /−’, ‘ + +/– –’ and ‘ + ++ /– – –’ represent statistical positive or negative significance at the 0.05, 0.01 and 0.001 level, respectively. Empty entry represents no statistical significance.

In general, nutrient concentrations did not have significant correlations with Chl a concentrations (P > 0.05; N = 35), except positive correlation was found between PO4 concentrations and total and >20 µm Chl a concentrations (r = 0.392–0.453; P < 0.05; N = 35). Total Chl a concentrations correlated strongly and positively with the Chl a concentrations of the >20 µm and 3–20 µm size fractions (r = 0.797–0.965; P < 0.001; N = 35), but negatively with the contribution of <3 µm size fraction (r = −0.349; P < 0.05; N = 35). The DGP and DNP did not correlate with Chl a concentrations or contributions of any size fractions, or nutrient concentrations (P > 0.05; N = 34).
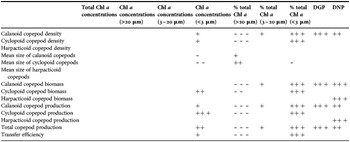
Correlations between various phytoplankton and copepod variables were also tested with Pearson's correlation (Table 2). Total Chl a concentrations and Chl a concentrations of the >20 µm and 3–20 µm size fractions did not correlate significantly with any of the copepod variables (P > 0.05; N = 35). Chl a concentrations from the <3 µm size fraction correlated positively with the density and production of calanoid and cyclopoid copepods (r = 0.353–0.638; P < 0.05; N = 35), but negatively with their mean size (r = −0.439–−0.351; P < 0.05; N = 35). Contribution of various phytoplankton size fractions showed strong significant correlations with the densities, biomass, and production of calanoids and cyclopoids, as well as CP and TE (P < 0.05; N = 34–35). The contribution of the >20 µm size fraction correlated negatively with the density, biomass, and production of calanoid and cyclopoid copepods (r = −0.625–−0.484; N = 34–35), but positively with their size (r = 0.385–0.451; P < 0.05; N = 35). The contribution of >20 µm size fraction also correlated negatively with CP and TE (r = −0.552–−0.547; P < 0.001; N = 34–35). An exact opposite trend was found in the correlations between the contribution of <3 µm size fraction and the various copepod variables (r = −0.414–−0.306; r = 0.492–0.652; P < 0.05; N = 34–35). Both DGP and DNP correlated strongly and positively with the density, biomass and production of calanoid copepods and production of all copepods (r = 0.449–0.661; P < 0.001; N = 34). In addition, DNP also correlated positively with harpacticoid copepod biomass and production (r = 0.756–0.765; P < 0.001; N = 25). While TE did not have significant correlations with DGP or DNP, it correlated strongly and positively with CP (r = 0.564; P < 0.001; N = 34; data not shown in Table 2).
Pearson's correlation analyses of various phytoplankton variables against various copepod variables. ‘DGP’ and ‘DNP’ represent depth-integrated gross primary production and depth-integrated net primary production, respectively. ‘ + /−’, ‘ + +/– –’ and ‘ + ++ /– – –’ represent statistical positive or negative significance at the 0.05, 0.01 and 0.001 level, respectively. Empty entry represents no statistical significance.

DISCUSSION
Spatial and seasonal variations
Despite the absence of spatial patterns in the physico-chemical parameters such as salinity, dissolved oxygen (DO), and nutrient concentrations in the surface waters of Tolo Harbour, our observations agree with previous studies that both Chl a concentration and copepod density increased towards the inner part of the bay (Wong et al., Reference Wong, Chan and Chen1993; Lie et al., Reference Lie, Wong, Lam, Liu and Yung2011; Zhang & Wong, Reference Zhang and Wong2011). The higher Chl a concentrations in the inner bay also led to higher phytoplankton primary production at the water surface (data not shown), but the estimated depth-integrated phytoplankton gross primary production (DGP) was significantly higher at TM8 due to the higher production potential from its greater depth. Indeed, based on measurements taken at the surface, Chan & Hodgkiss (Reference Chan and Hodgkiss1987) had also reported that annual mean primary production from 1983 to 1984 was higher in inner Tolo Harbour than at an outer station.
The densities of calanoid and cyclopoid copepods peaked during the summer, while harpacticoid copepods peaked in autumn. Calanoid copepods of the genus Paracalanus and cyclopoid copepods of the genus Oithona are the most abundant copepods found in Tolo Harbour (Wong et al., Reference Wong, Chan and Chen1993; Zhang & Wong, Reference Zhang and Wong2011). Oithona in the Gulf of Maine and Inland Sea of Japan had also been reported to reach peak densities in the summer (Fish, Reference Fish1936; Uye & Sano, Reference Uye and Sano1995). Several species of Paracalanus, on the other hand, have been found to reach peak abundances around winter in the Gulf of Mannar, India and Biscayne Bay, Florida (Reeve, Reference Reeve1964; Ummerkutty, Reference Ummerkutty1965), but smaller peaks have also been recorded around late spring or summer in the Gulf of Mannar (Ummerkutty, Reference Ummerkutty1965). As copepod biomass and production are directly related to copepod density, spatial and seasonal variations in biomass and production of copepods in Tolo Harbour can be explained by variations in copepod abundance.
Cyclopoid copepods were more abundant in the inner part of the bay than at TM8 and TM9, as Oithona is considered to be one of the most abundant copepods in eutrophic embayments (Nagasawa & Marumo, Reference Nagasawa and Marumo1984; Uye & Sano, Reference Uye and Sano1995). The sizes of calanoid and cyclopoid copepods varied seasonally and correlated negatively with temperature. Temperature has been known to influence copepod body sizes (Huntley & Lopez, Reference Huntley and Lopez1992), and high temperature has been shown to produce smaller copepod stages of both Paracalanus and Oithona (Riccardi & Mariotto, Reference Riccardi and Mariotto2000; Castellani et al., Reference Castellani, Irigoein, Harris and Holliday2007). In addition, the appearance of larger copepods in the outer part of Tolo Harbour during winter and spring may be due to the introduction of large non-native species from offshore waters. The large calanoid copepods Calanus sinicus (Hwang & Wong, Reference Hwang and Wong2005; Zhang & Wong, Reference Zhang and Wong2013) and Paraeuchaeta concinna (Wong et al., Reference Wong, Yau and Lie2012) have been shown to appear in the coastal seas of eastern Hong Kong waters during late winter and early spring only.
Phytoplankton size distribution
While environmental factors such as nutrients can affect the size structure of the phytoplankton community (Parsons & Takahashi, Reference Parsons and Takahashi1973), there was no strong correlation between various nutrient concentrations and Chl a concentrations of various size fractions, except for PO4 which correlated positively with total Chl a and Chl a in the >20 µm size fraction. One plausible explanation is that PO4 was the limiting nutrient for the phytoplankton in the >20 µm size fraction, and the concentrations of other nutrients were sufficient for optimal phytoplankton growth. On the other hand, the relationships between phytoplankton size and nutrients can also be complicated by differential nutrient uptake rates and storage abilities of phytoplankton of various groups and sizes (Pascual & Caswell, Reference Pascual and Caswell1997). Despite the lower surface area:volume ratio of large phytoplankton, physiological structures, such as the large vacuole of diatoms may allow the cells to maintain high nutrient uptake rates (Stolte et al., Reference Stolte, McCollin, Noordeloos and Riegman1994; Stolte & Riegman, Reference Stolte and Riegman1995). Indeed, diatoms can use their vacuole to store sufficient nutrients to undergo several cycles of cell divisions (Falkowski et al., Reference Falkowski, Katz, Knoll, Quigg, Raven, Schofield and Taylor2004).
The size composition of the phytoplankton community can strongly influence the structure and function of food webs in aquatic ecosystems (Ryther, Reference Ryther1969; Sprules & Munawar, Reference Sprules and Munawar1986). It is widely believed that small phytoplankton dominate under oligotrophic conditions, while eutrophic conditions favour larger phytoplankton (Irwin et al., Reference Irwin, Finkel, Schofield and Falkowski2006). Our results agree with the general belief that picophytoplankton (<2 µm) are less abundant in eutrophic coastal waters (Søndergaard et al., Reference Søndergaard, Jensen and Ærtebjerg1991; Iriarte & Purdie, Reference Iriarte and Purdie1994; Agawin et al., Reference Agawin, Duarte and Agusti2000). In the subtropical oceans of southern China, mean phytoplankton sizes change gradually from >20 μm in the coastal waters of Guangdong and Zhujiang River estuary to <10 μm in the more offshore waters of the northern South China Sea (Wang et al., Reference Wang, Caow, Xu and Yang2007). Many investigators have suggested that coastal phytoplankton communities consist of relatively stable populations of smaller phytoplankton (<5 µm), and relatively variable populations of larger phytoplankton (>5 µm) that are the principal contributors of blooms (Tremblay et al., Reference Tremblay, Klein, Legendre, Rivkin and Therriault1997; Tamigneaux et al., Reference Tamigneaux, Legendre, Klein and Mingelbier1999; Cermeño et al., Reference Cermeño, Marañón, Rodríguez and Fernández2005, Reference Cermeño, Marañón, Pérez, Serret, Fernández and Castro2006). Study of phytoplankton size structure in Singapore's coastal waters also revealed an increased contribution by larger cells (8–100 µm) as total chlorophyll concentrations increased (Gin et al., Reference Gin, Lin and Zhang2000). Indeed, the >20 µm size fraction accounted for >50% of the total Chl a in the two algal blooms encountered during the course of this study. In addition, Chl a concentrations varied by ~770× in the >20 µm size fraction, ~50× in the 3–20 µm size fraction, but only ~15× in the <3 µm size fraction. Phytoplankton of the two larger size fractions had the greatest influence on the total phytoplankton biomass as their Chl a concentrations correlated strongly and positively with the total Chl a concentrations.
While the phytoplankton community was dominated by the >20 µm size fraction, the densities of both calanoid and cyclopoid copepods correlated strongly and positively with the contribution of <3 µm Chl a, and strongly and negatively with that of >20 µm Chl a. While Paracalanus and Oithona, the most abundant copepods in Tolo Harbour (Wong et al., Reference Wong, Chan and Chen1993; Zhang & Wong, Reference Zhang and Wong2011), are known to prefer prey in the 10–20 µm size range (Paffenhöfer, Reference Paffenhöfer1984; Sommer et al., Reference Sommer, Stibor, Sommer and Velimirov2000), Paracalanus has been found to ingest particles as small as 4.5 µm (Paffenhöfer, Reference Paffenhöfer1984). In general, both Paracalanus and Oithona are considered to be suspension feeders with a wide range of exploitable prey sizes, and can have an optimal grazer:particle size-ratio as high as 180:1, with an average of 65:1 (Hansen et al., Reference Hansen, Bjørnsen and Hansen1994). Given the small mean body sizes of the copepods in Tolo Harbour, phytoplankton cells in the <3 µm size fraction may fit into their optimal food size range. Alternatively, copepods such as Oithona and Paracalanus may actually prefer microzooplankton over phytoplankton (Fessenden & Cowles, Reference Fessenden and Cowles1994; Turner, Reference Turner2004; Olson et al., Reference Olson, Lessard, Wong and Bernhardt2006). The small phytoplankton cells in the <3 µm size fraction may be grazed by microzooplankton (Landry & Hassett, Reference Landry and Hassett1982), which in turn are consumed by the copepods. The role of microzooplankton as a trophic link between phytoplankton and copepods will be discussed further in the following section. Nevertheless, phytoplankton cells >20 µm may be too large to be effectively grazed by the small copepods and microzooplankton in Tolo Harbour, and thus can dominate the phytoplankton community and develop dense blooms when conditions are favourable.
Phytoplankton primary and copepod production and transfer efficiency
The 0.71–20.65 g C m−2 day−1 of DGP and 0.34–10.40 g C m−2 day−1 of DNP recorded in this study were high compared to values of 0.04– ~ 11.0 g C m−2 day−1 reported in some eutrophic bays (Smith & Demaster, Reference Smith and Demaster1996; Lohrenz et al., Reference Lohrenz, Fahnenstiel, Redalje, Lang, Chen and Dagg1997, Reference Lohrenz, Fahnenstiel, Redalje, Lang, Dagg, Whitledge and Dortch1999; Burford & Rothlisberg, Reference Burford and Rothlisberg1999; Harding et al., Reference Harding, Mallonee and Perry2002; Yin et al., Reference Yin, Zhang, Qian, Jian, Huang, Chen and Wu2004; Zvalinskii et al., Reference Zvalinskii, Lobanov, Zakharkov and Tishchenko2006; Ara & Hiromi, Reference Ara and Hiromi2007). Over the entire study period, the highest DNP mean of 3.90 g C m−2 day−1 was from TM9, and was ~7–14× higher than the annual mean values recorded in the South China Sea (0.28 g C m−2 day−1; Liu et al., Reference Liu, Chao, Shaw, Gong, Chen and Tang2002) and the East China Sea (0.39–0.58 g C m−2 day−1; Gong et al., Reference Gong, Shiah, Liu, Wen and Liang2000, Reference Gong, Wen, Wang and Liu2003). A recent study using C14 has revealed that phytoplankton primary production in waters around Hong Kong could reach 40 g C m−2 day−1 during the summer (Ho et al., Reference Ho, Xu, Yin, Jiang, Yuan, He, Anderson, Lee and Harrison2010). While Agawin et al. (Reference Agawin, Duarte and Agusti2000) have shown that the contribution of <2 µm phytoplankton production is generally low in areas of high nutrient levels, no significant correlation between DGP or DNP with any phytoplankton size fraction parameters was found to provide support for such observations in Tolo Harbour. There was also no correlation between DGP or DNP and various physico-chemical parameters, except for a slight positive correlation between temperature and DGP.
In contrast to phytoplankton primary production, the total copepod production (CP) in Tolo Harbour was not particularly high compared to those from other eutrophic bays. While CP varied greatly, from 0.12 to 15.47 mg C m−3 day−1, the average value for the four sampling stations over the whole study period was ~2.7 mg C m−3 day−1, which is ~3× lower than the annual mean of 6.85 mg C m−3 day−1 recorded in the eutrophic Fukurama Harbour in Japan (Uye & Liang, Reference Uye and Liang1998).
As a result of the high phytoplankton primary production and the relatively low copepod production, the transfer efficiency (TE) between phytoplankton production and copepod production in Tolo Harbour was low. The overall mean of 1.4% was several times lower than the 4–6% reported from two bays in Japan (Uye et al., Reference Uye, Nagano and Shimizu2000; Ara & Hiromi, Reference Ara and Hiromi2007). The lowest value of <0.3% was obtained during algal blooms at TM4 in March and May 2008. While the classical large phytoplankton–copepod–fish food chain may still be applicable in some productive waters (Calbet, Reference Calbet2001), our results revealed a huge loss of production between phytoplankton and copepods. One plausible explanation is that the two groups were not directly connected, but were linked by microzooplankton. Results of field studies have suggested that many copepods prefer microzooplankton (Fessenden & Cowles, Reference Fessenden and Cowles1994; Olson et al., Reference Olson, Lessard, Wong and Bernhardt2006) and may achieve better growth and reproduction feeding on the more nutritious heterotrophic prey (Wiadnyana & Rassoulzadegan, Reference Wiadnyana and Rassoulzadegan1989; Klein Breteler et al., Reference Klein Breteler, Koski and Rampen2004; Tang & Taal, Reference Tang and Taal2005). Reviews have confirmed that mesozooplankton consume an average of ~22% of the primary production, compared to 60–75% consumed by microzooplankton (Calbet, Reference Calbet2001; Landry & Calbet, Reference Landry and Calbet2004). Indeed, it has been shown that microzooplankton remove on average ~60% of the phytoplankton standing stock and 160% of the phytoplankton production in Tolo Harbour (Lie & Wong, Reference Lie and Wong2010). While no data on copepod grazing impact in Tolo Harbour are available, it is worth noting that the marine cladoceran Penilia avirostris remove only ~1% of the phytoplankton standing stock in Tolo Harbour (Wong et al., Reference Wong, Chan and Tang1992). Alternatively, a significant portion of the phytoplankton primary production in Tolo Harbour can also be lost from the water column through sinking. As the phytoplankton community in Tolo Harbour was generally dominated by larger cells (>20 µm), and vertical mixing is poor in summer due to the presence of vertical stratification (Wong et al., Reference Wong, Chan and Chen1993; Tang et al., Reference Tang, Chen and Wong1994; Lie et al., Reference Lie, Tse and Wong2012). Thus a faster sinking rate and ineffective grazing control on large phytoplankton cells may lead to a large export of large phytoplankton production to the sea bottom, especially during algal bloom periods (Rodriguez et al., Reference Rodriguez, Tintore, Allen, Blanco, Gomis, Reul, Ruiz, Rodriguez, Echievarria and Jimenez-Gomez2001; Li, Reference Li2002).
Ara & Hiromi (Reference Ara and Hiromi2007) reported a strong negative correlation between TE and phytoplankton primary production, and proposed the use of this relationship for the estimation of copepod production from phytoplankton primary production. The TE correlated with neither DGP nor DNP in this study, making the estimation of copepod production from phytoplankton primary production impossible. Instead, there was a strong positive correlation between TE and CP, suggesting that while copepods were not able to control the phytoplankton community effectively, TE was dependent on the copepod population. Although the copepod community in Tolo Harbour is consistently dominated by the small herbivorous Paracalanus spp. and Oithona spp. (Wong et al., Reference Wong, Chan and Chen1993; Zhang & Wong, Reference Zhang and Wong2011), larger copepods of other species are carried into the bay by water currents in winter (Hwang & Wong, Reference Hwang and Wong2005). Such introduction of an external population of copepods may lead to a short-term change in the interactions between phytoplankton and copepods, thus the dynamics of the pelagic food web.
ACKNOWLEDGEMENTS
The authors would like to thank Y.H. Yung, K.C. Cheung, P. Tse and W. Li for assistance in the laboratory and fieldwork.
FINANCIAL SUPPORT
The research is supported by a Direct Grant for Research from the Research Committee of The Chinese University of Hong Kong.