Introduction
Albitisation is a metasomatic process activated by Na-rich fluids that, while infiltrating granitoid and metasedimentary rocks, leads to the transformation of feldspars of variable composition into albite and to the dissolution of quartz (Boulvais et al., Reference Boulvais, Ruffet, Cornichet and Mermet2007; Engvik et al., Reference Engvik, Putnis, Fitz Gerald and Austrheim2008; Petersson et al., Reference Petersson, Stephens, Mattsson and Möller2012; Condit et al., Reference Condit, Mahan, Curtis and Moller2018). Although commonly related to the late magmatic and subsolidus hydrothermal phases of the intrusion-related environment (e.g. Cathelineau, Reference Cathelineau1986, Reference Cathelineau1987; Charoy and Pollard, Reference Charoy and Pollard1989; Kaur et al., Reference Kaur, Chaudhri and Eliyas2019; Pérez-Soba and Villaseca, Reference Pérez-Soba and Villaseca2019), the metasomatic process of albitisation has been recognised in a variety of geological contexts over a range of crustal conditions, from sedimentary-diagenetic (pseudomorphic replacement of detrital plagioclase by albite, Perez and Boles, Reference Perez and Boles2005) to the amphibolite and even granulite metamorphic facies (Rubenach and Lewthwaite, Reference Rubenach and Lewthwaite2002; Holness, Reference Holness2003; Touret and Nijland, Reference Touret, Nijland, Harlov and Austrheim2013). Albitisation is also a characteristic alteration facies of porphyry-style, iron oxide copper–gold ore deposits (IOCG) and uranium ore deposits (Pirajno, Reference Pirajno2009 and references therein), and on a large scale can result in feldspathic deposits of economic importance (Castorina et al., Reference Castorina, Masi, Padalino and Palomba2006).
In general, the albitisation processes active in a range of different environments can be related to two types of metasomatising fluids and circulation models: (1) dilute aqueous fluids circulating around cooling granite plutons, with salinity acquired by mixing with magmatic fluids or through water–rock interaction (e.g. Carten, Reference Carten1986; Pirajno, Reference Pirajno2009); and (2) high salinity chlorine and Na-rich fluids (Na is easily complexed by chlorine), being either surface-derived brines, infiltrating through faults in extensional settings, or subsurface waters acquiring high salinity by interaction with evaporite beds (Barton and Johnson, Reference Barton and Johnson1996; van de Kamp and Leake, Reference van de Kamp and Leake1996; Quesnel et al., Reference Quesnel, Boiron, Cathelineau, Truche, Rigaudier, Bardoux, Agrinier, de Saint Blanquat, Masini and Gaucher2019; Cathelineau et al., Reference Cathelineau, Boiron and Jakomulski2021). Aqueous fluids circulating along increasing temperature paths result in albitisation of feldspars together with quartz dissolution induced by temperature rise and consequent increase of quartz solubility.
Regardless of the origin of the Na-rich fluids, albitisation develops through a dissolution–precipitation mechanism, leading to an increase in porosity (Engvik et al., Reference Engvik, Putnis, Fitz Gerald and Austrheim2008). An important consequence is the development of a transient (or permanent) permeability which enhances the infiltration of albitising fluids and the development of metasomatism (Boulvais et al., Reference Boulvais, Ruffet, Cornichet and Mermet2007). Note however, if permeability promotes albitisation on a large scale, it may leave the albitite prone to infiltration by later circulating fluids.
In most cases, albitisation has been recognised in granitic environments, although some papers have recognised that granite albitisation can also develop long after the hydrothermal activity associated with cooling of the intrusion, in which case the granitoid rocks only have a passive role (e.g. Engvik et al., Reference Engvik, Putnis, Fitz Gerald and Austrheim2008; Kontonikas-Charos et al., Reference Kontonikas-Charos, Ciobanu and Coo2014). Notwithstanding the vast amounts of literature on albitisation, few papers report examples outside of the magmatic environment (e.g. van de Kamp and Leake, Reference van de Kamp and Leake1996). Moreover, the effects of the superposition of later fluid circulation has not been investigated, regardless of the increase of permeability during this metasomatic process.
In this paper, we present petrographic and geochemical data to describe fully an example of albitisation of Middle Triassic phyllites from Monti Pisani, northern Tuscany, Italy, and track the mineralogical and geochemical changes undergone by these rocks through a multi-stage (albitisation to kaolinisation) hydrothermal process. The latter occurred after the main Apenninic deformative phase, and is not related directly to any known magmatic-related hydrothermal activity. This aspect contrasts with other areas of southern Tuscany where hydrothermal activity is related to thermal anomalies induced by lithospheric thinning, generally coupled with post-collisional magmatism of Late Miocene to Quaternary age (e.g. Batini et al., Reference Batini, Brogi, Lazzarotto, Liotta and Pandeli2003).
Geological background
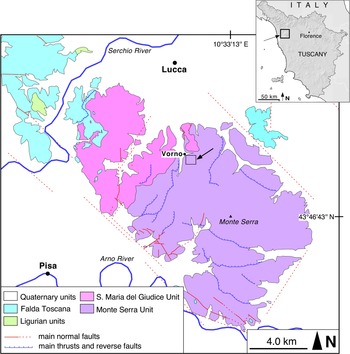
The Monti Pisani are a small mountainous massif belonging to the Northern Apennines, located in northern Tuscany, between the Arno and Serchio rivers (Fig. 1). They are part of the ‘Middle Tuscan Ridge’, a discontinuous belt of mountains and hills, from the Alpi Apuane massif to the north, to the Monte Argentario to the south, where the metamorphic units of the Northern Apennines are well exposed.
Tectonic sketch map of the Monti Pisani area (Lucca and Pisa provinces, Tuscany). The small square encloses the area represented in Fig. 2. Redrawn and simplified from Rau and Tongiorgi (Reference Rau and Tongiorgi1974).

From east to west and from bottom to top the Monti Pisani are constituted by the Monte Serra Unit, the Santa Maria del Giudice Unit and the Tuscan Nappe (Fig. 1; Rau and Tongiorgi, Reference Rau and Tongiorgi1974). The rocks cropping out in the study area belong to the Monte Serra Unit, which is made mainly of meta-siliciclastic rocks belonging to the Anisic-Ladinic Verruca and the Carnic Quarziti di Monte Serra formations. The protoliths of these rocks were continental siliciclastic sediments that initiated the Alpine sedimentary succession of the Northern Apennines. These rocks rest unconformably on a Palaeozoic basement (Cambrian?–Permian) composed of schist, phyllite, quartzite and meta-conglomerate (Rau and Tongiorgi, Reference Rau and Tongiorgi1974; Paoli et al., Reference Paoli, Stokke, Rocchi, Sirevaag, Ksienzyk, Jacobs and Košler2017). During the Alpine Orogeny these rocks underwent a polyphase tectono-metamorphic evolution, characterised by three main deformative events (D1, D2 and D3; Leoni et al., Reference Leoni, Montomoli and Carosi2009). The first, and most intense, tectonic phase (D1) produced tight to isoclinal F1 folds associated with a penetrative S1 axial plane foliation (slaty cleavage foliation). The F1 folds have steep axial planes and vergences both towards the NE and SW. During this phase the rocks suffered a dynamic recrystallisation and were metamorphosed under greenschist-facies conditions (Franceschelli et al., Reference Franceschelli, Leoni, Memmi and Puxeddu1986; Leoni et al., Reference Leoni, Montomoli and Carosi2009). The most common mineral assemblage of the meta-siliciclastic rocks from Monti Pisani is quartz+muscovite ± ‘chlorite' ± paragonite ± pyrophyllite ± albite with accessory amounts of ‘tourmaline’, hematite, magnetite, rutile, zircon, ‘apatite’, ‘monazite’, ‘xenotime’ and Fe-hydroxide replacing Fe-carbonate (e.g. Franceschelli et al., Reference Franceschelli, Leoni and Sartori1987). The P–T conditions of this metamorphism are poorly constrained; however, most pressure and temperature estimates are in the range 0.4–0.7 GPa and 350–400°C, respectively (Franceschelli et al., Reference Franceschelli, Leoni, Memmi and Puxeddu1986; Franceschelli et al., Reference Franceschelli, Leoni and Memmi1989; Franceschelli et al., Reference Franceschelli, Leoni and Sartori1991; Leoni et al., Reference Leoni, Montomoli and Carosi2009). The tectonic phases that followed, D2 and D3, were much less intense than the former and typically did not produce significant metamorphic recrystallisation (Leoni et al., Reference Leoni, Montomoli and Carosi2009).
Field occurrence
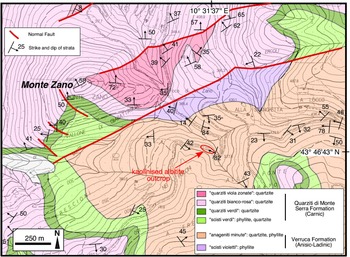
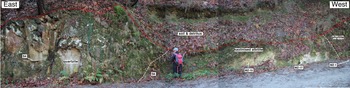
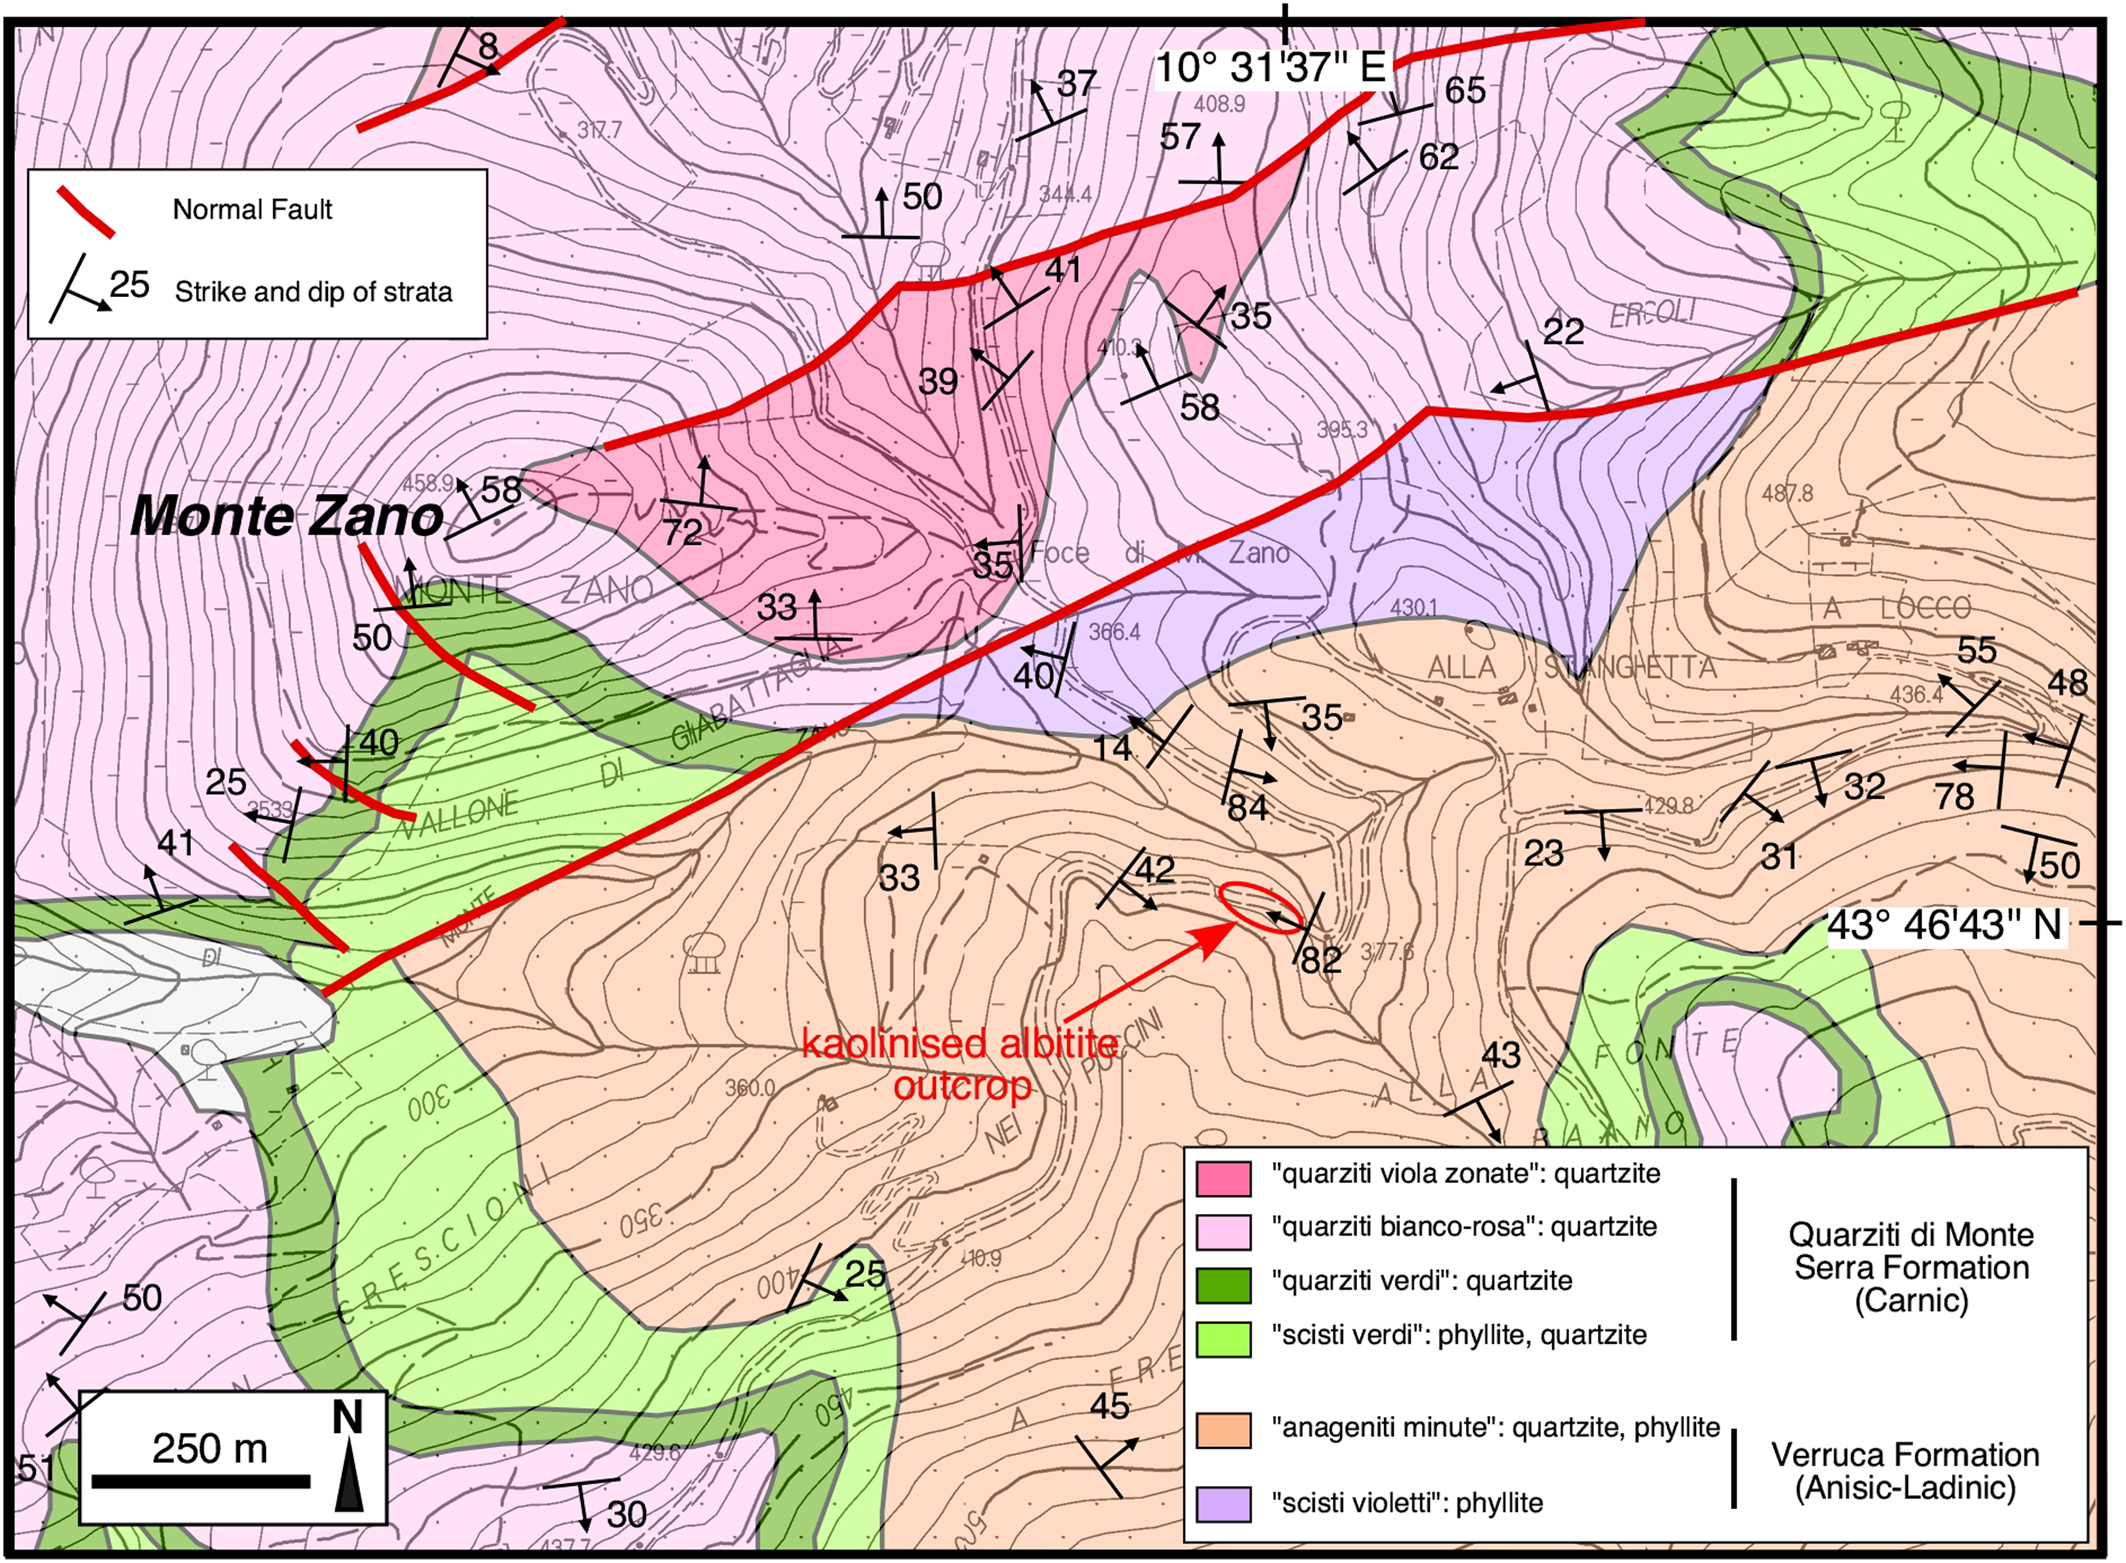
The kaolinised albitite rocks described in this investigation are located in a wooded area in the central part of the Monti Pisani, ~650 m SE of Monte Zano (Vorno hamlet, Lucca) at an altitude of ~ 380 m a.s.l. and have not been described to date (Fig. 2). They crop out over a length of ~20 m and a height of ~1–2 m thanks to a road cut at 43°46'43''N, 10°31'37''E, whereas the surrounding area is characterised by a thick cover of soil and detritus (Fig. 3). The whitish to greyish earthy rocks are interposed between quartzite (east side) and phyllite (west side) belonging to the Anageniti minute Member of the Verruca Formation (Fig. 3) and are pervaded by a network of brown veins and veinlets of Fe-hydroxide (Fig. 4).
Geological map of the Monte Zano area (Monti Pisani, Lucca province). The red ellipse encloses the study area. Redrawn and simplified from Rau and Tongiorgi (Reference Rau and Tongiorgi1974), and integrated with measurements from this work.
The outcrop of the kaolinised albitite rock investigated in this study. The locations of some of the samples are also reported. See also Fig. 4.

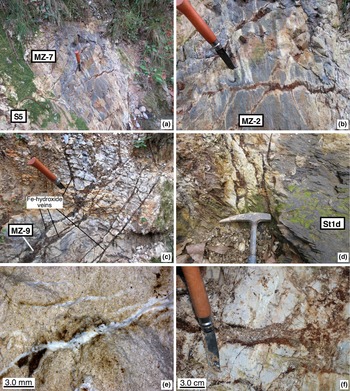
Details of the kaolinised albitite outcrop: (a) westernmost part of the outcrop showing ragged relicts of the lead-grey phyllite protolith; (b) detail of the same outcrop as (a) showing several Fe-hydroxide veins with white halos; (c) Fe-hydroxide veins cross-cutting the whitish kaolinised albitite; (d) detailed view of the transitional contact (western side) between the hydrothermally altered rock (left) and the unaffected phyllite protolith (right); (e) veinlets of halloysite cross-cutting the kaolinised albitite; (f) detail of the breccia structure within the kaolinised albitite. The locations of some of the samples are also shown. See also Fig. 3.

The transition from the kaolinised albitite to the country rocks is relatively abrupt towards the quartzite and more gradual towards the phyllite. Towards its western margin, the kaolinised albitite includes ragged masses of lead-grey to violet phyllite and fades gradually to the phyllite (Fig. 4a,b,d). The field observations, confirmed by thin section analysis, indicates that the kaolinised albitite formed at the expense of a phyllite protolith. The Fe-hydroxide veins are from a few mm up to 3 cm in width and can be followed for up to 1–2 m. They are very irregularly distributed, however two more frequent sets of veins can be recognised that are subvertical and strike N110 and N60 (Fig. 4b,c). When crushing this material, many grains with an obvious rhombohedral habit are observed. Very probably, the veins were originally Fe-bearing carbonates (possibly siderite) replaced successively by Fe-hydroxide. Where the veins crosscut the phyllite, they typically exhibit a white halo (Fig. 4b). Quartz veins, up to 2 cm in width, also occur. They are locally deformed and generally follow the main pervasive foliation of the country rocks which is sub-parallel to bedding, trends N23 and dips 82W; cross-cutting relationships reveal that the quartz veins predate the Fe-hydroxide ones. Finally, a network of tiny veinlets (up to 2 mm in width) of whitish material pervades the kaolinised albitite (Fig. 4e). Rarely, we observed the occurrence of breccia structures within the kaolinised albitite (Fig. 4f).
Samples and analytical methods
Ten samples considered representative of all the types of rocks in the outcrop were selected for the petrographic, mineralogical and geochemical study.
Mineralogical and textural features of the samples were examined in polished thin sections with optical (Zeiss Axioplan) and electron (Philips XL30 and FEI Quanta 450 ESEM FEG) microscopy. Polished thin sections were carbon-coated before electron microscopy. X-ray maps (800 × 532 grid, 30 min acquisition time) were obtained with a FEI Quanta 450 ESEM FEG using the Kα radiation of the elements Na, Mg, Al, Si, K, Ti and Fe. Scanning electron microscopy (SEM) analyses were performed at the Pisa University's Dipartimento di Scienze della Terra (hereafter DST-UniPi; Philips XL30) and at Centro per l'Integrazione della Strumentazione Scientifica dell'Università di Pisa (CISUP; FEI Quanta 450 ESEM FEG).
A tiny vein of white material taken from a kaolinised albitite sample was dispersed in water and left to settle. Then a few drops of the supernatant were deposited on a thin-section glass slide and evaporated. This preparation was carbon-coated and examined with the FEI Quanta 450 ESEM FEG at very high magnification (up to × 260,000).
Powder X-ray diffraction (PXRD) was performed for the identification and quantification of mineral phases using a Rigaku DMax 2200 diffractometer equipped with CuKα radiation, a scintillation counter detector and sample spinner (Istituto di Metodologie per l'Analisi Ambientale (IMAA-CNR), Tito Scalo). Data were collected between 2–70°2θ and 2–32°2θ angles for the bulk sample and clay fraction, respectively, with a 0.02°2θ step size and 3 s for each step, power = 40 kV and current = 30 mA. The clay fraction was separated by settling in distilled water. Oriented mounts were prepared by settling a suspension after being saturated with Mg2+ cations using 1 N MgCl2 solution, and each specimen was air dried, glycolated at 60°C for 8 hours and heated at 375°C for 1 hour (Moore and Reynolds, Reference Moore and Reynolds1997). Quantitative analyses were carried out on bulk sample XRD profiles by measuring the peak area of both phyllosilicates and non-phyllosilicates (Cavalcante et al., Reference Cavalcante, Fiore, Lettino, Piccarreta and Tateo2007) using the Winfit computer program (Krumm, Reference Krumm1999). The results obtained by PXRD were calibrated with whole-rock major-element data obtained by inductively coupled plasma optical emission spectrometry (ICP-OES) and LOI values, using the experimental software vbAffina (Leoni et al., Reference Leoni, Lezzerini and Saitta2008; Cesarano et al., Reference Cesarano, Bish, Cappelletti, Cavalcante, Belviso and Fiore2018).
The major-element concentrations of the bulk-rock samples were determined by ICP-OES following lithium metaborate/tetraborate fusion and dilute HNO3 dissolution (detection limits = 0.01 wt.% or better) at Actlabs (Ancaster, Ontario, Canada).
The concentrations of 37 trace elements in the whole-rock samples were determined by inductively coupled plasma mass spectrometry (ICP-MS, Perkin-Elmer NexION 300x at DST-UniPi.) following HF + HNO3 dissolution at low and high pressure. At the element concentrations in the samples investigated precision is better than 5% RSD, except for Sc, Cu, Zn and Pb in which the precision is between 5 and 10% RSD. Mercury has been determined by atomic absorption spectrometry (AAS) using a Milestone direct mercury analyser (DMA 80 Tri Cell; detection limit ≈ 0.5 ng/g for a sample weight of 100 mg).
A fluid-inclusion investigation was carried out on quartz crystals separated from the breccia, shown in Fig. 4f. Doubly polished quartz crystals (thickness 100–300 μm) were prepared for petrography and microthermometric determinations. The thermometric behaviour of fluid inclusions was studied on a Linkam THMS 600 heating-freezing stage (DST-UniPi), and the accuracy of measurements is estimated at ± 2°C at 398°C, controlled by the melting point of K2Cr2O7, ± 0.1°C at 0°C and ± 0.2°C at –56.6°C, controlled by using certified pure water and CO2-bearing synthetic fluid inclusions.
Results
Petrography and mineralogy
The protolith
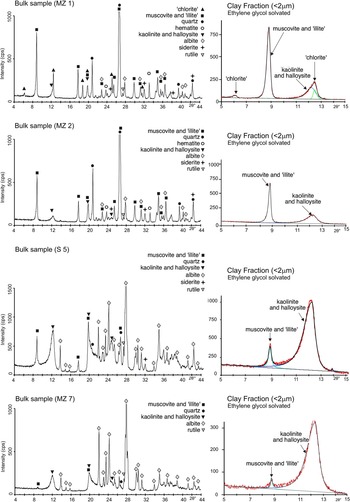
Three samples of the protolith of the kaolinised albitite rock described in this study were collected. One (sample MZ-1) was taken west of the kaolinised albitite outcrop just out of the alteration zone, whereas the other two (St1d and MZ-2) were taken within the kaolinised albitite outcrop, in the least altered portions (Fig. 4a,b). Sample MZ-1 is a lead-grey to violet-grey phyllite that, together with quartzite, meta-sandstone and meta-conglomerate, forms the Anageniti minute member of the Verruca Formation (Franceschelli et al., Reference Franceschelli, Leoni and Sartori1987). Petrographically, this fine-grained rock has a well-developed schistosity and is composed predominantly of ‘potassic white mica’ (muscovite and/or ‘illite’) + quartz with minor amounts of ‘chlorite’ + hematite + albite. Accessory phases are ‘tourmaline’, zircon, xenotime-(Y), monazite-(Ce), ‘apatite’, rutile and Fe-carbonates. Samples St1d and MZ-2 are similar to sample MZ-1, except for their much lower content of hematite and ‘chlorite’, and their slightly higher content of quartz and albite. The proportion of hematite and ‘chlorite’ in the protolith rocks correlates with their hand-specimen colour that changes from lead-grey/violet-grey to pearly white as the amounts of these ferromagnesian minerals decrease. Samples MZ-1 and MZ-2 were investigated by PXRD, which shows that sample MZ-2 does not contain ‘chlorite’, carries a small amount of kaolinite/halloysite; and is characterised by a lower ‘potassic white mica’/quartz ratio with respect to sample MZ-1 (Fig. 5; Table 1).
Powder X-ray diffraction patterns. The diagrams to the right show the X-ray diffraction of the clay fraction of the samples solvated with ethylene glycol.

Mineralogical composition (wt.%) of the bulk samples determined by PXRD.

Qz, quartz; Ab, albite; Sd, siderite; Hem, hematite; Rt, rutile; Ms, muscovite; Ilt, ‘illite’; Chl, ‘chlorite’; Kln, kaolinite; Hly, halloysite; tr, trace; n.d., not detected.
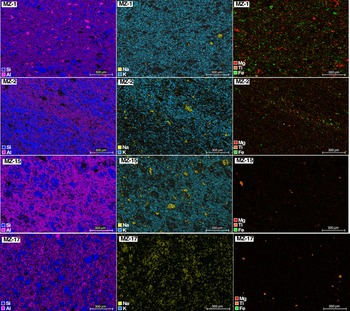
The X-ray maps of samples MZ-1 and MZ-2 (Fig. 6) show the high abundance of quartz and ‘potassic white mica’ of these rocks, and the slight increase and decrease of albite and ferromagnesian minerals, respectively, from MZ-1 to MZ-2. A sample of quartzite (S4) has been collected from the easternmost border of the outcrop. This rock is dominated by quartz with less abundant ‘potassic white mica’ and minor amounts of ‘chlorite’ and albite. The accessory minerals observed are the same as those found in the phyllites. Samples S5 and MZ-15 have petrographic features intermediate between those of the phyllite protolith and kaolinised albitite. Indeed, X-ray maps (Fig. 6; MZ-15 sample) and PXRD data (Fig. 5; sample S5) provide evidence that these rocks are characterised by slightly lower abundances of ‘potassic white mica’ and ferromagnesian minerals and by a higher content of albite with respect to the phyllite protolith.
X-ray maps (Kα radiation of Si, Al, Na, K, Mg, Fe and Ti).

The kaolinised albitite
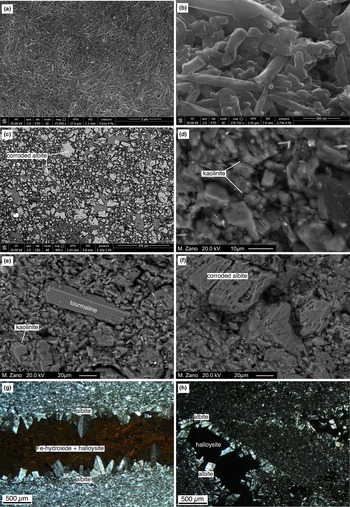
The kaolinised albitite (samples MZ-7, MZ-17 and S6) is whitish or light orange in colour. It is earthy and friable, crossed by irregular dark brown veins and veinlets of Fe-hydroxides (1 mm to 3–4 cm in width), and pervaded by a network of tiny veins (~0.1 mm to ~2 mm in width) of pearly-white and compact material mostly comprising halloysite (Figs 4e, 7a,b).
Images of the kaolinised albitite: (a) FEG-SEM SE image nanotubes of halloysite; (b) FEG-SEM SE image nanotubes of halloysite taken at high magnification (×170,000); (c) FEG-SEM back-scatter electron (BSE) image at low magnification showing corroded albite crystals (light grey) with kaolinite + halloysite (dark grey); (d) SEM BSE image of flaky kaolinite crystals; (e) SEM BSE image of a euhedral, residual ‘tourmaline’ crystal within a matrix of kaolinite + albite; (f) SEM BSE image of a strongly corroded larger albite crystal within a matrix of kaolinite + albite; (g,h) optical microscope images (crossed polars) of a micro-vein (g) and micro-vugs (h) lined by euhedral albite crystals and filled by Fe-hydroxide + halloysite and halloysite, respectively.

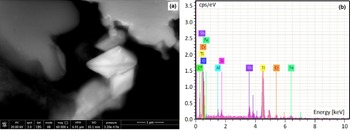
Optical and scanning electron microscopy shows that these samples consist of variable amounts of albite + kaolinite (± halloysite) + quartz ± ‘potassic white mica’ (Fig. 7c,d,f). Accessory minerals are rutile, monazite-(Ce), zircon, xenotime-(Y) and ‘tourmaline’ (Fig. 7e). We also found tiny (~1 μm) euhedral crystals and larger rounded grains of a Sb(Cr,Fe,Si,Al)-bearing Ti oxide (Fig. 8) with up to ~13 wt.% Sb (SEM-EDX semi-quantitative analyses). The major minerals (albite + kaolinite and halloysite) of these rocks (sample MZ-7) were also identified by PXRD (Fig. 5).
(a) FEG-SEM BSE image of a tiny euhedral crystal of the Sb(Cr,Fe,Si,Al)-bearing Ti oxide phase in sample MZ-7; (b) SEM-EDX spectrum of the crystal.

The X-ray maps of sample MZ-17 (Fig. 6) show the abundance of quartz, kaolinite (± halloysite) and albite and the complete lack of K-bearing minerals.
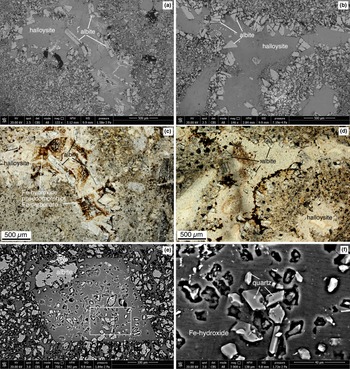
Most of the albite crystals appear extensively corroded (Fig. 7c,f). Within the same samples we observed veinlets and micro-vugs, a few mm in size, lined with coarser euhedral (sometimes having rounded edges) albite crystals (up to 5–600 μm in length; Fig. 7g,h). The latter protrude into homogeneous masses of halloysite and Fe-hydroxides pseudomorphing Fe-carbonate (Figs 7g,h, 9a–d). Iron hydroxide also replaces euhedral Fe-carbonate crystals within the matrix of the kaolinised albitite (Fig. 9e,f). These pseudomorphs enclose tiny euhedral quartz crystals and strongly corroded albite. The same mineral association, though with a higher proportion of Fe-hydroxides replacing Fe-carbonates, also characterises the larger veins cross-cutting the kaolinised albitite. The rare brecciated rocks within the kaolinised albitite (Fig. 4f) are composed of small clasts (~80% by volume), from 0.5 to 8 mm in size, dominated by kaolinised albitite and Fe-hydroxide vein fragments with less abundant euhedral quartz and albite crystal fragments. The fine-grained matrix (<300 μm) is made of the same minerals. No evidence of newly-formed cementing minerals have been found.
Petrography of the kaolinised albitite: (a,b) FEG-SEM BSE images showing micro-vugs lined with coarse euhedral albite crystals and filled with homogeneous masses of kaolinite/halloysite and Fe-hydroxide; (c,d) optical microscope images (plane polarised light) of the same area portrayed in (a) and (b) emphasising the occurrence of Fe-hydroxide (brown and black in colour) inside the micro-vugs; (e) FEG-SEM BSE images of the Fe-hydroxide replacing a euhedral rhombohedral crystal of Fe-carbonate enclosing many euhedral quartz crystals and strongly corroded albite; (f) enlarged view of the area enclosed in the white rectangle in (e) showing the tiny euhedral quartz crystals.

Geochemistry
The protolith
The major-element composition of the phyllite protolith falls within the typical range of phyllites of the Verruca Formation from Monti Pisani (Franceschelli et al., Reference Franceschelli, Leoni and Sartori1987). These rocks are characterised by low Na2O/K2O ratios (0.07–0.14; Fig. 10) in agreement with the low and high abundance of albite and ‘potassic white mica’, respectively (Table 2). The concentrations of TiO2, total Fe2O3 and MgO are in keeping with the abundance of hematite, ‘chlorite’ and rutile. The intermediate samples S5 and MZ-15 have Na2O and K2O contents intermediate between those of the kaolinised albitite and the unaltered phyllite, though closer to the latter.
(Fe2O3 tot + MgO) vs. Na2O/K2O (all in wt.%) diagram for the rocks studied.

Major-element compositions (wt.%) of the rocks investigated.

LOI = loss on ignition
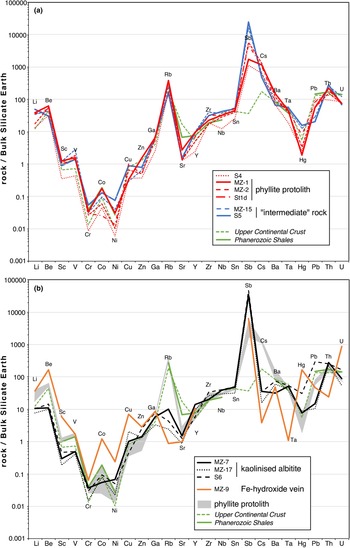
The trace-element distributions of the phyllite protolith are comparable to that of the average Upper Continental Crust (Taylor and McLennan, Reference Taylor and McLennan1995) and the average Phanerozoic Shale (Condie, Reference Condie1993; Fig. 11a; Table 3). The most notable exceptions are the concentration of Sr, which is much lower, and those of Sb and Cs, which are higher. The low Sr content is a typical feature of the meta-siliciclastic rocks of the Monte Serra Unit, which are characterised by very low, and low, abundances of Ca–Mg carbonates and feldspars, respectively (Franceschelli et al., Reference Franceschelli, Leoni and Sartori1987). The positive anomaly of Sb seems to be a peculiar feature of the meta-sedimentary rocks investigated. The high content of Cs is in agreement with the abundance of ‘potassic white mica’ and correlates with the high K2O content (4.37–5.55 wt.%) of the rocks studied (Upper Continental Crust = 3.37 wt.%; Phanerozoic Shale = 3.84 wt.% K2O).
Concentrations of trace elements in the samples investigated normalised to the Bulk Silicate Earth values (McDonough and Sun, Reference McDonough and Sun1995).

Trace-element concentrations (μg/g) of the rocks studied.

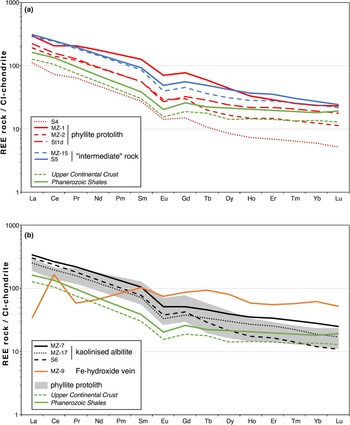
The CI-normalised rare earth element (REE) distributions of the three protolith samples are characterised by rectilinear and slightly fractionated patterns (LaN/LuN = 12–17; Fig. 12a) showing moderate negative Eu anomalies (EuN/Eu* = 0.63–0.71). The pristine phyllite sample (MZ-1) has higher REE concentrations and also shows a slight negative Ce anomaly (CeN/Ce* = 0.83).
Concentrations of the REE of the samples investigated normalised to the CI-chondrite values (McDonough and Sun, Reference McDonough and Sun1995).

The trace-element distribution of the quartzite sample S4 is very similar to that of the pristine phyllite MZ-1, with its much lower concentrations due to dilution by quartz (Figs 11a, 12a).
The kaolinised albitite
The kaolinised albitite samples (S6, MZ-7 and MZ-17) are composed predominantly of SiO2, Al2O3, Na2O (Table 2). The Na2O content is particularly high (3.2–5.9 wt.%) compared to those measured in the metasiliciclastic rocks of the Monte Serra Unit (generally Na2O <1 wt.%; Franceschelli et al., Reference Franceschelli, Leoni and Sartori1987). The high Na2O is coupled with very low K2O and, accordingly, the Na2O/K2O ratio is very high (34–200; Fig. 10). The TiO2 contents are 1.0–1.3 wt.%, comparable to those measured in the phyllite rocks (1.0–1.1 wt.%).
The kaolinised albitite samples share similar trace-element distributions (Fig. 11b; Table 3) and differ from the pristine phyllite in their lower Li, Be, Sc, V, Ba, much lower Rb and Cs, and higher Sb (up to 278 μg/g) and Hg (up to 310 ng/g).
The CI-normalised REE patterns are generally rectilinear and slightly fractionated (LaN/LuN = 14–28; Fig. 12b) and show slightly negative Eu anomalies (EuN/Eu* = 0.64–0.70). Overall, the REE abundances and relative distributions of the kaolinised albitite samples do not differ substantially from those of the pristine phyllite.
The Fe-hydroxide veins
The Fe-hydroxide veins are represented by sample MZ-9 which is composed mostly of Fe-hydroxide (Fe2O3tot = 65.8 wt.%, LOI = 18.0 wt.%), although it also contains a significant fraction of SiO2, Al2O3, MnO and P2O5 (Table 2). The trace-element distribution of the sample is marked by a strong enrichment of Be, Sc, Cr, Co, Ni, Cu, Hg and U and a strong depletion in Rb, Cs, Nb, Ta and Th (Fig. 11b; Table 3). The high concentration of Hg (1650 ng/g) is particularly striking. In contrast, the concentration of Sb (27.3 μg/g) is comparable with that of the pristine phyllite. The CI-normalised REE pattern (Fig. 12b) shows an enrichment of the mid and heavy rare earth elements (MREE, HREE), a significant depletion of the light REE (LREE), a prominent positive Ce anomaly (CeN/Ce* = 3.7), and a slight negative Eu anomaly (EuN/Eu* = 0.79).
Fluid-inclusion data
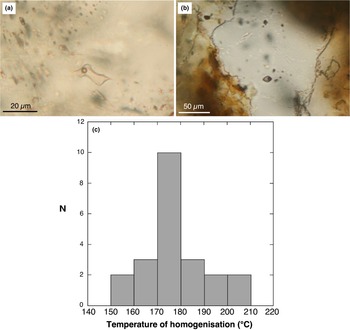
Small (<0.5 mm) quartz crystals, grown during the Fe-carbonate ± quartz stage, were picked out from the breccia shown in Fig. 4f. These quartz crystals commonly host fluid inclusions, classified according to phase types occurring at room temperature. The inclusions were randomly distributed within quartz crystals and sometimes formed isolated clusters (Fig. 13a,b). They are assigned to a probable primary origin, according to the criteria of Roedder (Reference Roedder1984). These inclusions are small in size (<20 μm, though most are <10 μm) and typically display an ellipsoidal morphology, though some examples have an irregular shape. Only one type of fluid inclusion was identified by microscopic observation at room temperature. These are two-phase (liquid + vapour) inclusions, liquid-rich at room temperature, having a vapour bubble that occupies ~20% of the inclusion volume. The results of microthermometric investigation are shown in Fig. 13c. During heating runs these inclusions homogenise by disappearance of the vapour bubble in the liquid phase at temperatures ranging between 159°C and 209°C with a mode at ~175°C. The small size of most of these inclusions does not allow the observation of initial ice melting during cryometric experiments (in only one case we observed initial ice melting at –52°C, suggesting the occurrence of divalent cations such as Ca2+, Mg2+ and Fe2+; Crawford, Reference Crawford, Hollister and Crawford1981). The final ice melting was observed in four fluid inclusions. The collected values consistently indicate a final ice melting temperature of ~–20.5°C, corresponding to salinity of ~23 wt.% NaCl equivalent, calculated according to Bodnar (Reference Bodnar1993).
Fluid inclusions in quartz: (a,b) photomicrographs of two-phase liquid-rich (L + V) primary fluid inclusions found within small quartz crystals in the brecciated kaolinised albitite; (c) histogram of the homogenisation temperatures (°C) of the studied fluid inclusions. N = number of measurements.

Discussion
Mineralogical and textural evidence of hydrothermal reactions
The petrographic and mineralogical data have been used to reconstruct the mineral paragenetic sequence shown in Table 4. Different types of evidence have been used: (1) vein cross-cutting relationships; (2) mineral infilling sequences in veins; (3) mineral reaction textures (e.g. albite dissolution, Fe-hydroxide pseudomorphosis on Fe-carbonate); (4) changes in the relative proportions of mineral phases.
Mineral paragenetic sequence for the alteration of the phyllite protolith.

The first stage of the hydrothermal processes that affected the phyllite rocks is testified by the change in the proportions of albite vs. quartz and albite vs. ‘potassic white mica’ of the kaolinised albitite compared to the protolith (Figs 5,6,7). This suggests quartz and ‘potassic white mica’ consumption and albite growth during the albitisation stage. A possible reaction, implying the involvement of a metasomatic fluid with extremely high Na/K ratio, and the removal of K+, could be the following (Rosenbauer et al., Reference Rosenbauer, Bischoff and Radtke1983):

Albitisation changes from ‘replacement-type’, generating diffuse granular albite, to ‘vein-type’, characterised by coarser albite crystals lining the walls of open fractures and vugs. Subsequently, the vein cross-cutting relationships and the mineral infill textures in veins (Fe-carbonate after albite) testify the Fe-carbonate ± quartz stage following albitisation (Figs 4, 9). The newly formed quartz is very scarce, however it is constantly found with Fe-carbonate, both in the veins and in the rock, indicating cessation of quartz dissolution reactions (Fig. 9e,f). The quartz crystals hosting two-phase L-rich fluid inclusions belong to this stage.
Subsequently, reaction features (partial dissolution of albite, Figs 7c,e, 9e; replacement of Fe-carbonate by Fe-hydroxides, Fig. 9) associated with the formation of kaolinite suggest a new hydrothermal stage (kaolinisation stage) induced by a pervasively circulating, moderately acidic (pH ≈ 4–5) and oxidising fluid. A possible reaction could be the hydrolysis of albite (Blum, Reference Blum and Parsons1994):

We suggest the euhedral albite lining veinlets and micro-vugs is preserved as the acidic fluid is neutralised by its reaction with Fe-carbonate.
Finally, the presence of halloysite as open space filling in veinlets (Figs 4e, 9a–d) and of several generations of Fe-hydroxides, in some cases sequestering P, Al and Si, lining cavities and veinlets, suggest the occurrence of late-stage supergene fluid circulation (halloysite stage).
Geochemical constraints on element mobility
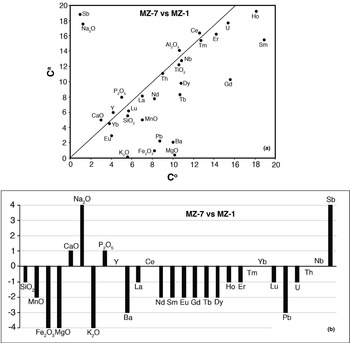
The isocon method of Grant (Reference Grant1986) was employed for evaluating chemical gains and losses during the alteration processes. The altered rocks in this investigation consistently demonstrate the overlapping effects of the different alteration stages. As a consequence, it is not possible to quantify chemical gains and losses induced by any single alteration event; nonetheless, we tried to evaluate the elemental mobility in the course of the whole multistage hydrothermal alteration process, from the pristine phyllite to the final altered rocks. The isocon traced in this work was almost entirely controlled by the immobile elements Al and Ti, as commonly reported in several papers (i.e. Eaton and Setterfield, Reference Eaton and Setterfield1993; Mathieu, Reference Mathieu2018; Pitzalis et al., Reference Pitzalis, Fulignati, Lezzerini, Cioni, Pinarelli, Tamponi and Gioncada2019). The isocon diagram is shown in Fig. 14a, and calculated (according to Grant, Reference Grant1986) gains and losses for various elements due to hydrothermal alteration are plotted in Fig. 14b. These diagrams were built assuming the MZ-1 sample as fresh rock and MZ-7 sample as the most extreme kaolinised albitite. The results show a net gain of Na and Sb and a marked depletion of Fe, Mg, Mn, K, Ba and Pb. The overall effect of the alteration process involves just a minor loss of Si. REE behaviour is characterised by depletion in the intermediate REE, whereas LREE and HREE are generally immobile.
Element mobility during the alteration processes: (a) isocon diagram for the kaolinised albitite sample MZ-7. Component abundances of fresh rock (sample MZ-1) are plotted on the horizontal scale, and those of its altered equivalent are plotted on the vertical scale; (b) histogram showing percentage of gains and losses of selected elements during alteration processes, as calculated from the isocon diagram presented in Fig. 14a. Variation of +4 to +1 = a gain of more than 100%, 50 to 100%, 25 to 50% and 10 to 25%, respectively. 0 = immobile elements (variation in the range + 10 and –10%). Values of –1 to –4 = losses of 10 to 25%, 25 to 50%, 50 to 90%, more than 90%, respectively.

Conclusions: evidence of a multi-stage hydrothermal process in the Monti Pisani area
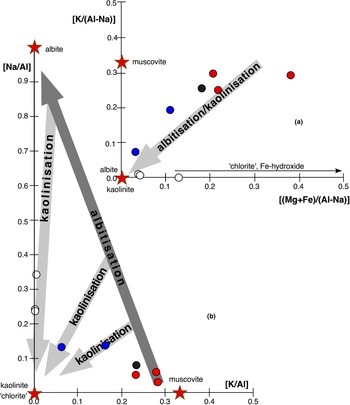
This investigation documents the occurrence of localised multi-stage hydrothermal alteration of phyllite rocks from the Middle Triassic Verruca Formation. The process of albitisation undergone by the phyllite has not been observed before in the Monti Pisani area, and represents an interesting example of Na-metasomatism outside of a magmatic environment. The age of the hydrothermal processes is poorly constrained, however, due to the lack within the kaolinised albitite of the pervasive S1 foliation observed in the pristine phyllite, it is very probably successive to the main deformative phase (D1) of the Monti Pisani massif, which occurred during the Late Miocene (Rau and Tongiorgi, Reference Rau and Tongiorgi1974). The high-Na/K metasomatic fluid induced a pervasive alteration of the pristine phyllite with loss of ‘potassic white mica’, quartz, ‘chlorite’ and hematite (Fig. 15a), and the conspicuous growth of hydrothermal albite. This stage induced a partial to nearly complete substitution of K by Na (Fig. 15b). The Na-rich fluids responsible for this alteration stage could be originated from primary brines or from the interaction between hydrothermal fluids and evaporitic rocks (e.g. Quesnel et al., Reference Quesnel, Boiron, Cathelineau, Truche, Rigaudier, Bardoux, Agrinier, de Saint Blanquat, Masini and Gaucher2019; Cathelineau et al., Reference Cathelineau, Boiron and Jakomulski2021). These latter could be those originally hosted within the Triassic Calcare cavernoso Formation (Dini et al., Reference Dini, Orlandi, Protano and Riccobono1998; Montomoli et al., Reference Montomoli, Ruggieri, Carosi, Dini and Genovesi2005) or within the Scisti verdi member of the Quarziti di Monte Serra Formation. Indeed, Rau and Tongiorgi (Reference Rau and Tongiorgi1974) documented the occurrence of episodes of sedimentation inside hyperaline lagoons in the Scisti verdi succession.
Chemical model for the kaolinised albitite formation: (a) molar [K/(Al–Na)] vs. [(Mg+Fe)/(Al–Na)] for the rocks studied; (b) molar [Na/Al] vs. [K/Al] diagram for the rocks studied. Same symbols as in Fig. 10.

The positive correlation between Na2O and Sb observed in our samples suggests that Sb was carried by the Na-rich fluid. The occurrence of Sb-(Cr)-bearing Ti-oxide euhedral microcrystals in the kaolinised albitite indicates that the Sb introduced into the system during the albitisation stage was mainly fixed into this phase. As proposed by Smith and Perseil (Reference Smith and Perseil1997) for the Sb-rich rutile from St. Marcel-Praborna Mn-mineralisation (Italy), and considering the systematic occurrence of Cr together with Sb in the rutile in the kaolinised albitite, the most probable cation exchange reaction could be:

The albitisation stage was followed by the formation of a system of Fe-carbonate ± quartz veins, which are a very common feature of the whole Monti Pisani area (Dini et al., Reference Dini, Orlandi, Protano and Riccobono1998). The fluid responsible for the formation of the Fe-carbonate ± quartz veins also pervaded the matrix of the albitite as testified by the occurrence of carbonate rhombohedra pseudomorphs (hosting euhedral quartz crystals; Fig. 9e,f). Fluid inclusions hosted in the quartz crystals indicate the circulation of high-salinity aqueous fluids (~23 wt.% NaCl equivalent) with a minimum temperature of ~175°C.
Fluids with greater salinity (33–41 wt.% NaCl equivalent) have been found in the Monti Pisani area by Dini et al. (Reference Dini, Orlandi, Protano and Riccobono1998) in hypersaline fluid inclusions (liquid + vapour + single halite crystal) hosted within quartz + Fe-carbonate (totally replaced by Fe-hydroxides) veins. These veins crop out 1.75 km due SW of the studied kaolinised albitite. On the basis of initial ice melting temperatures, the same authors hypothesised the occurrence of significant amounts of Ca2+, Fe2+ and Mg2+ in addition to Na+ and K+ in these fluid inclusions. The subsequent alteration stage involved a slightly acidic and oxidising fluid, whose ingression was probably favoured by the increase of permeability accompanying albitisation, which led to the extensive replacement of albite by kaolinite and to the complete replacement of Fe-carbonate by Fe-hydroxides. The oxidising environment during this stage is also testified by the prominent positive Ce anomaly of the Fe-hydroxide veins (Fig. 12b; Bau, Reference Bau1999). During this stage Na was partially removed from the rock (Fig. 15b). Successively, the ingression of supergene fluids led to the formation of widespread halloysite veinlets and colloform P–Al–Si-bearing Fe-hydroxides (last alteration minerals formed). The nearly immobile behaviour of LREE and HREE+Y could be due to the refractory nature of monazite-(Ce) and xenotime-(Y), respectively, during the different stages of the hydrothermal alteration process. The very last notable event undergone by these rocks was brittle deformation originating localised fracturing (Fig. 4f), without the formation of new minerals.
Prior to this work, the northernmost hydrothermally-altered rocks formed during the post-collisional phases of the Apennine Orogeny were found 30–40 km south of the Monte Zano area. Those occurrences are clearly related to the extensional tectonic setting which affected the Tyrrhenian side of Tuscany and involved lithospheric thinning and the emplacement of sialic and mafic magmas into the crust (Serri et al., Reference Serri, Innocenti and Manetti1993). This geological framework led to the development of the intense and extensive hydrothermal activity that characterises central-southern Tuscany, where the Larderello and Mt Amiata high enthalpy active geothermal fields are the most striking and renowned occurrences (e.g. Batini et al., Reference Batini, Brogi, Lazzarotto, Liotta and Pandeli2003). Given this background, the kaolinised albitite in this investigation expands the effects of post-collisional hydrothermal activity in Tuscany northwards.
Acknowledgements
Funding of this study was provided by Pisa University's “Progetti di Ricerca di Ateneo - PRA–2020–25” granted to M. D'Orazio and A. Gioncada. The authors thank Ahmad Rabiee and an anonymous referee for their constructive reviews, and Roger Mitchell for the editorial handling. R. Ishak and M. Gemelli are acknowledged for their assistance at the FEG-SEM facility of the Centro per l'Integrazione della Strumentazione Scientifica dell'Università di Pisa (CISUP), P. Boulvais for the insightful comments on a previous version of the manuscript, C. Frassi for advice during field work, and C. Biagioni for the critical reading of the manuscript.
Competing interests
The authors declare none.