Highlights
The results provided evidence that a dissonance-based transdiagnostic eating disorder treatment reduced brain reward region response to thin models and high-calorie binge foods, in addition to reducing eating disorder symptoms and increasing abstinence from binge eating and compensatory behaviors.
Eating disorders affect 13% of females and 5% of males (Allen, Byrne, Oddy, & Crosby, Reference Allen, Byrne, Oddy and Crosby2013; Stice, Marti, & Rohde, Reference Stice, Marti and Rohde2013), which include threshold and subthreshold anorexia nervosa (AN), bulimia nervosa (BN), and binge eating disorder (BED), and purging disorder (PD), and are marked by chronicity, relapse, distress, impairment, suicide, and morbidity (Stice et al., Reference Stice, Marti and Rohde2013; Swanson, Crow, Le Grange, Swendsen, & Merikangas, Reference Swanson, Crow, Le Grange, Swendsen and Merikangas2011). Unfortunately, 80–97% of afflicted individuals do not receive treatment (Swanson et al., Reference Swanson, Crow, Le Grange, Swendsen and Merikangas2011). Further, treatments typically require 20 individual sessions (Wilson & Zandberg, Reference Wilson and Zandberg2012) and cost between $12 146 and $119 200 (Crow et al., Reference Crow, Agras, Halmi, Fairburn, Mitchell and Nyman2013). Treatments for the various eating disorders also differ, complicating implementation. Thus, there has been interest in transdiagnostic eating disorder treatments (Fairburn et al., Reference Fairburn, Bailey-Straebler, Basden, Doll, Jones, Murphy and Cooper2015; Stice, Rohde, Butryn, Menke, & Marti, Reference Stice, Rohde, Butryn, Menke and Marti2015; Wonderlich et al., Reference Wonderlich, Peterson, Crosby, Smith, Klein, Mitchell and Crow2014) because they would be easier to implement broadly.
Among transdiagnostic treatments, body project treatment (BPT; Stice et al., Reference Stice, Rohde, Butryn, Menke and Marti2015) may be most cost-effective because it is delivered in eight group sessions rather than 20 individual sessions, which translates into 1 h of clinician time per patient v. 20 h per patient for other transdiagnostic treatments. BPT is even more cost-effective than guided self-help treatment, which requires 3–4 h of clinician time per patient (Wilson & Zandberg, Reference Wilson and Zandberg2012). In BPT, women with any eating disorder appropriate for outpatient treatment complete activities wherein they collectively explore costs of pursuing the thin beauty ideal and eating disorder behaviors (e.g. fasting, binge eating), which creates dissonance that reduces valuation of the thin ideal and behaviors used to pursue this ideal because people align their attitudes with their publicly displayed behavior. Theoretically, overvaluation of the thin ideal and behaviors used to pursue it maintain eating disorders. Reducing thin-ideal valuation is a central intervention target because valuation of the thin ideal, weight/shape overvaluation, and fear of weight gain predict increases in eating disorder symptoms and eating disorder onset (Dakanalis et al., Reference Dakanalis, Clerici, Bartoli, Caslini, Crocamo, Riva and Carra2017; Rohde, Stice, & Marti, Reference Rohde, Stice and Marti2015; Stice, Desjardins, Rohde, & Shaw, Reference Stice, Desjardins, Rohde and Shaw2021; Stice, Gau, Rohde, & Shaw, Reference Stice, Gau, Rohde and Shaw2017) and persistence of binge eating and compensatory behaviors (Bohon, Stice, & Burton, Reference Bohon, Stice and Burton2009; Dakanalis et al., Reference Dakanalis, Clerici, Bartoli, Caslini, Crocamo, Riva and Carra2017; Fairburn et al., Reference Fairburn, Stice, Cooper, Doll, Norman and O'Connor2003; Stice & Agras, Reference Stice and Agras1998). We also hypothesized that discussing costs of binge eating would reduce valuation of high-calorie binge food. Overeating and binge eating predict future eating disorder onset (Stice et al., Reference Stice, Gau, Rohde and Shaw2017, Reference Stice, Desjardins, Rohde and Shaw2021; Tanofsky-Kraff et al., Reference Tanofsky-Kraff, Shomaker, Olsen, Roza, Wolkoff, Columbo and Yanovski2011) and healthy youth with v. without parental history of eating pathology show greater reward region (putamen) response to anticipated chocolate milkshake tastes (Stice, Yokum, Rohde, Cloud, & Desjardins, Reference Stice, Yokum, Rohde, Cloud and Desjardins2021).
Randomized trials have provided support for BPT (Table 1). In a trial with 72 women with eating disorders, those randomized to BPT showed significantly larger reductions in thin-ideal valuation, dissonance about perpetuating the thin ideal, body dissatisfaction, negative affect, and eating disorder symptoms v. usual care controls (Stice et al., Reference Stice, Rohde, Butryn, Menke and Marti2015). In a second trial with 84 women, those randomized to BPT showed significantly larger reductions in dissonance about perpetuating the thin ideal, body dissatisfaction, negative affect, psychosocial impairment, and remission of eating disorder diagnoses v. a supportive mindfulness group treatment (77% v. 60%; Stice, Rohde, Shaw, & Gau, Reference Stice, Rohde, Shaw and Gau2019). However, the larger reductions in thin-ideal valuation, eating disorder symptoms, and abstinence from binge eating and purging behaviors (55% v. 39%, respectively), a common outcome for trials of transdiagnostic eating disorder treatments, did not reach significance. A third trial with 100 women examined target engagement; BPT participants showed significantly greater reductions in fMRI-assessed responsivity of regions implicated in reward valuation (dorsolateral prefrontal cortex, caudate) and attention (precuneus) to thin v. average weight models, thin-ideal valuation, and increased attractiveness ratings of average weight models, as well as greater reduction in body dissatisfaction, negative affect, and eating disorder symptoms, and marginally greater abstinence from binge eating and purging compared to waitlist controls (39% v. 21%, respectively; Stice et al., Reference Stice, Yokum, Rohde, Shaw, Gau, Johnson and Johns2019). The caudate and ventromedial prefrontal cortex encode valuation of stimuli (Bartra, McGuire, & Kable, Reference Bartra, McGuire and Kable2013). There was no evidence that BPT participants showed greater reductions in reward region response to high-calorie binge foods; BPT participants only showed reductions in parahippocampal gyrus response to high-calorie food images, which plays a role in memory encoding and retrieval. We used a waitlist control condition to evaluate test–retest reliability of target engagement measures; 10-week test–retest reliability was ICC = 0.74 for neural response to thin models and r = 0.82 for attractiveness ratings of models.
Overview of randomized trials examining effects of BPT

* = p < .05.
Although results from the target engagement trial were encouraging, only 72 participants provided pretest and posttest fMRI data. Given concerns about the limited reproducibility of fMRI findings from small samples (Smeets et al., Reference Smeets, Dagher, Hare, Kullmann, van der Laan, Poldrack and Veldhuizen2019), we recruited an additional 38 participants (a 42% increase in fMRI data). The primary aim was to test if BPT participants in this larger sample showed greater reductions in reward region responsivity to thin models and high-calorie binge foods than controls.
An exploratory aim was to evaluate whether a change made to BPT in the third trial to improve efficacy (i.e. encouraging rapid symptom reduction) inadvertently weakened efficacy; effect sizes for symptom reduction (d = 0.59) and abstinence from binge eating and compensatory behaviors (39%) in the third trial were smaller than effects from earlier trials (d = 0.95 and 55% abstinence). The smaller effects from the third trial could be due to encouraging early symptom reduction, which a prior finding suggested led to higher abstinence v. a treatment that did not encourage this (MacDonald, McFarlane, Dionne, David, & Olmsted, Reference MacDonald, McFarlane, Dionne, David and Olmsted2017). We theorized that BPT might be more effective if participants first talk themselves out of pursuing the thin ideal before attempting to reduce eating disorder symptoms that are often used to pursue this ideal (i.e. the original BPT approach). One efficient way to test this hypothesis was to extend recruitment in the third trial and have new participants complete the original BPT in which exercises first focus on reducing thin-ideal valuation before reducing eating disordered behaviors. We hypothesized that reductions in symptoms and abstinence would be larger for the original BPT v. the early symptom reduction version.
Methods
Participants and procedure
We recruited 138 women (M age = 21.97 ± 3.42) from Oregon and Texas. Web postings, flyers, and mailings invited women with body image and eating concerns to participate in a treatment trial, and local eating disorder treatment clinics and recover centers were encouraged to refer individuals. Informed consent was obtained for this institutional review board-approved trial. Participants completed a web-screener; a brief phone screen or in-person interview verified that they met criteria for an eating disorder. Women with AN with a BMI below 17 were excluded because they were not deemed appropriate for outpatient treatment, similar to the exclusion criterion for transdiagnostic outpatient treatment trials (e.g. Fairburn et al., Reference Fairburn, Bailey-Straebler, Basden, Doll, Jones, Murphy and Cooper2015). Suicidal ideation and substance abuse were also exclusion criteria. The sample was 76% Caucasian, 14% Hispanic, 4% Black, 15% Asian, 2% Native American, 1% other (2% did not report race/ethnicity). Baseline eating disorders were AN = 6 (4%), BN = 47 (34%), BED = 19 (14%), subthreshold AN = 4 (3%), subthreshold BN = 40 (29%), subthreshold BED = 8 (6%), and PD = 14 (10%).
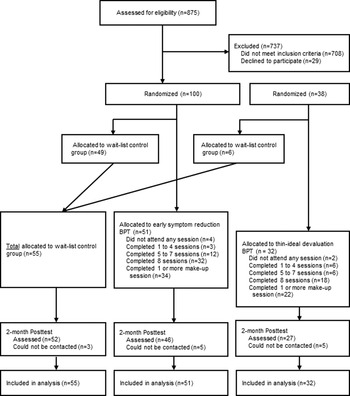
The first 100 participants were randomized to early symptom reduction BPT (n = 51) or waitlist (n = 49) using a random number table (results reported in Stice et al., Reference Stice, Yokum, Rohde, Shaw, Gau, Johnson and Johns2019). The subsequently recruited cohort of 38 participants was randomized to the original BPT (n = 32) or waitlist (n = 6). We randomized more participants to the original BPT to generate more stable effect size estimates; 83 participants were randomized to BPT and 55 to waitlist. Participants completed assessments at pretest and 2 months later at posttest (see Fig. 1 for participation flow). Waitlist controls were offered BPT after study completion.
Participant flow through the study.

Body project treatment (BPT)
BPT consisted of 8 weekly 1-h group sessions with 4–9 participants wherein participants completed written and verbal exercises, including defining the thin ideal, discussed costs of pursuing this ideal and various disordered eating symptoms (e.g. overvaluation of weight/shape, unhealthy weight control behaviors, binge eating), role-played dissuading facilitators from pursuing the thin ideal and engaging in disordered eating behaviors, completed motivational exercises (e.g. discussing the importance of addressing their eating disorder), and shared their written home exercises. Between sessions participants completed exercises including writing letters (e.g. to their eating disorder), motivational exercises (e.g. writing about the importance of improving body image), a mirror body appreciation exercise, generating lists of ‘body activism’ behaviors to resist the thin ideal, consuming three healthy meals daily, reducing ‘linchpin’ eating disorder symptoms that maintain other symptoms, and tracking eating disorder symptoms. The primary difference between the two versions of BPT is that in the original participants were encouraged to begin reducing eating disorder symptoms in session 4 v. session 2; approximately 80% of the content was identical. Facilitator training and supervision details are provided elsewhere (Stice et al., Reference Stice, Yokum, Rohde, Shaw, Gau, Johnson and Johns2019).
Scan procedures and measures
Participants were asked to consume regular meals but refrain from eating or drinking caffeinated beverages 3 h before scans. Mean fasting (±s.d.) hours prior to the scans were 5.6 ± 4.8 (pretest) and 5.8 ± 4.8 (posttest). Participants completed a thin model picture paradigm, wherein they viewed pictures of thin models and average-weight models and were asked to think about the attractiveness of each model, and a high-calorie food picture paradigm, wherein they viewed pictures of high-calorie binge foods (e.g. chocolate cake) and low-calorie foods (fruits and vegetables) and were asked to think about how much they wanted to eat the food. In both paradigms, 20 pictures of each category were presented for 5 s. A 4–8 s jittered fixation cross occurred between images. During each paradigm, stimuli were presented in one scanning run. Order of paradigms and picture presentation were randomized. Immediately after scans, participants rated attractiveness of the models and palatability and monetary value of the foods. See supplemental material for additional details.
Non-fMRI measures
Eating pathology
The semi-structured Eating Disorder Diagnostic Interview (EDDI; Stice et al., Reference Stice, Yokum, Rohde, Shaw, Gau, Johnson and Johns2019) assessed DSM-5 eating disorder symptoms and diagnoses (operationalized in Stice et al., Reference Stice, Gau, Rohde and Shaw2017). The EDDI assessed symptoms frequency on a monthly basis in the past 12 months at pretest and since last assessment at posttest. The continuous symptom composite reflected diagnostic symptoms in the past month (frequency of binge eating, vomiting, laxative/diuretic use, fasting, and excessive exercise; yes/no questions regarding binge eating features [e.g. rapid eating]; and Likert questions about overvaluation of weight/shape, fear of weight gain/becoming fat, use of behaviors to avoid weight gain, and feeling fat). It has shown internal consistency (α = 0.92), inter-rater agreement (ICC r = 0.93), 1-week test–retest reliability (ICC r = 0.95), and sensitivity to detecting intervention effects (Stice et al., Reference Stice, Rohde, Shaw and Gau2019; Stice et al., Reference Stice, Yokum, Rohde, Shaw, Gau, Johnson and Johns2019). EDDI eating disorder diagnoses have shown 1-week test–retest reliability (κ = 0.79), inter-rater agreement (κ = 0.75), and sensitivity to detecting intervention effects (Stice et al., Reference Stice, Yokum, Rohde, Shaw, Gau, Johnson and Johns2019). We defined abstinence as not engaging in binge eating, vomiting and laxative/diuretic use in the past 30 days, following the definition used in other transdiagnostic eating disorder treatment trials (Fairburn et al., Reference Fairburn, Bailey-Straebler, Basden, Doll, Jones, Murphy and Cooper2015; Wonderlich et al., Reference Wonderlich, Peterson, Crosby, Smith, Klein, Mitchell and Crow2014). Descriptions and psychometrics for the secondary outcomes are in the supplementary material section.
Statistical methods
Preliminary analyses
We first tested whether participants randomized to the two versions of BPT differed on pretest outcomes, demographics, ancillary treatment, session attendance, dropout, and change in outcomes. We also assessed whether randomization created equivalent waitlist control and combined BPT conditions by comparing participants in these two conditions on pretest outcomes, demographics, and ancillary treatment. Further, we compared participants who completed all assessments to those who did not on pretest outcomes, demographics, and condition.
Model building
Intent-to-treat analyses of condition effects for continuous outcomes were evaluated with mixed-effects growth models, estimated with SAS PROC MIXED (SAS/STAT, 2011). The intercept was defined as the pretest assessment and the model included a time variable coded in months since pretest, a two-level condition variable and the condition × time interaction term. The condition × time interaction term informed on change in BPT v. controls. Effects sizes for the interaction term are equivalent to Cohen's d-statistics (Feingold, Reference Feingold2009). Logistic regression models, estimated with a logit link using SAS PROC LOGISTIC evaluated posttest condition differences in abstinence, adjusting for pretest abstinence. We also tested condition differences in posttest underweight, healthy weight, and overweight status using multinomial logistic regression models. We specified the healthy weight category as the reference group, included condition as a predictor, and adjusted for baseline BMI. Missing data were imputed using PROC MI, and the imputation model included pretest and posttest outcomes, condition, demographics and ancillary treatment, with imputed data in 50 data sets analyzed separately; model parameters and standard errors were combined using SAS PROC MIANALYZE.
fMRI acquisition and data preprocessing
In total, 120 participants completed pretest scans and 104 completed both pretest and posttest scans. No participant failed the movement inclusion criteria at pretest (within-run movement exceeding 3 mm in translational movement and 3° in rotational movement) but one participant showed excessive movement during the model picture paradigm at posttest and was excluded from analyses. See Supplemental Material for additional details.
fMRI data analysis
We conducted 2 group (BPT v. control) × 2 Time (pretest v. posttest) repeated-measures ANOVAs to examine intervention effects on neural response to the model (n = 103) and food (n = 104) picture paradigms. Scan site was a covariate for both paradigms and hours since last food intake was a covariate for the food paradigm.
Whole-brain analyses were conducted. To correct for multiple comparisons across brain voxels, we calculated cluster extent thresholds for analysis at p < 0.001 with the SPM cluster size threshold tool (https://github.com/ CyclotronResearchCentre/SPM_ClusterSize Threshold). For repeated-measures ANOVAs, thresholds were k ⩾ 36 (model image paradigm) and k ⩾ 37 (food image paradigm), respectively. Similar to our previous report, we performed a priori regions-of-interest (ROI) analyses within the caudate and ventromedial prefrontal cortex (vmPFC) to test for pre-post changes (see Supplemental Material).
We tested for associations between pre-post changes in BOLD response and pre-post changes in eating disorder symptoms, thin-ideal internalization, attractiveness ratings of thin- and average-weight models, palatability ratings of high-calorie foods and low-calorie foods, and monetary value of high-calorie foods and low-calorie foods (see Supplementary Results). We extracted subject-level parameter estimates from significant peak coordinates found with the repeated-measures ANOVAs from SPM and exported these to SPSS to conduct analyses. Effects were considered significant using Benjamini−Hochberg FDR-corrected p values of 0.002.
fMRI effect sizes (r) were derived from the Z-values (Z/√N). fMRI data were inspected to ensure that influential outliers (parameter estimates exceeding 3 SDs from the mean parameter estimate) did not drive effects.
Results
Preliminary analyses
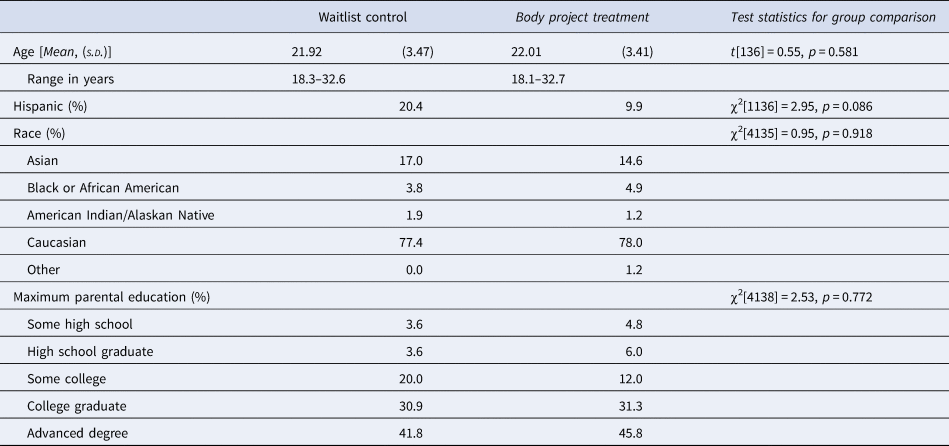
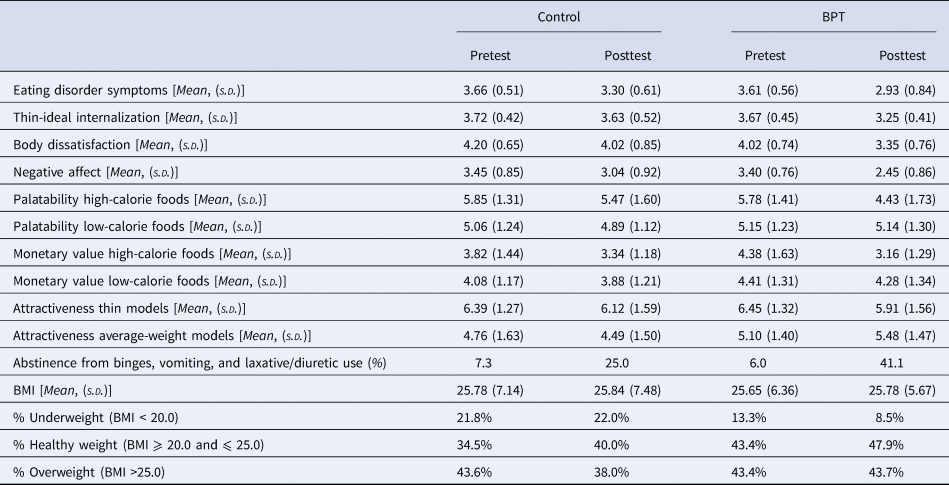
Eating disorder symptom scores were normalized with natural log transformations. Early symptom reduction BPT and original BPT groups did not differ on pretest demographics, ancillary treatment, symptoms, or abstinence. Early symptom reduction BPT and original BPT did not differ on change in eating disorder symptoms (d's = −0.98 and −1.70; p value = 0.187) or abstinence at posttest (41.1% and 44.2%; p value = 0.548), respectively. Analyses also suggested that attendance [Mean = 6.6 early symptom reduction BPT v. Mean = 6.2 original BPT; t(81) = 0.72, p = 0.475] and dropout [9.8% early symptom reduction BPT v. 15.6% original BPT; χ2(1,83) = 0.63, p = 0.428] did not differ. We therefore combined early symptom reduction BPT and original BPT groups for analyses. Control and combined BPT groups did not differ on pretest demographics (Table 2), ancillary treatment [21.8% v. 20.5%; χ2(1138) = 1.56, p = 0.454], eating disorder symptoms [t(136) = 0.55, p = 0.553] or abstinence [7.3% v. 6.0%; χ2(1138) = 0.09, p = 0.771]. Table 3 provides descriptive statistics for outcomes at pretest and posttest for each condition. BPT participants either attended or made-up an average of 6.4 of 8 sessions (s.d. = 2.7); 61% attended or made-up all 8 sessions and 11% attended or made-up less than 2 sessions. Among those who missed a session, 76% received a make-up session. Participants completed 72% of the home exercises. Retention was 91% at posttest; the missing completely at random assumption (MCAR) remained tenable [Little's MCAR test χ2(125) = 93.77, p = 0.983]. Three participants provided only baseline data. Attrition was not significantly related to demographics (all p values >0.142), pretest outcomes (all p values >0.121), or condition (p value = 0.194), with the exception of monetary value of high-calorie binge foods (p value = 0.041) (see Supplementary Materials).
Study demographic and pretest characteristics by study condition

Descriptive statistics for outcomes by condition at pretest and posttest

s.d. = standard deviation. Log transformed values of eating disorder symptoms reported.
Intervention effects on primary and secondary outcomes
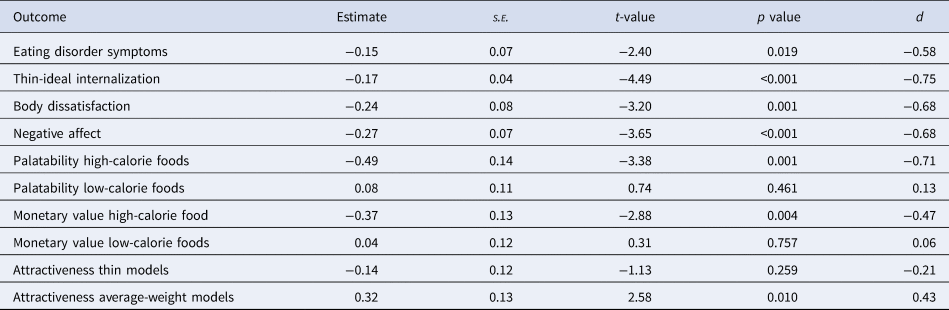
BPT v. control participants showed greater pre-to-post reductions in eating disorder symptoms (d = −0.58), thin-ideal internalization (d = −0.75), body dissatisfaction (d = −0.68) and negative affect (d = −0.68) (Table 4). BPT participants had 122% greater odds (estimate = 0.82, s.e. = 0.42, t-value = 1.97, p value = 0.048, OR = 2.22) of being abstinent at posttest v. controls. BPT v. control participants showed greater reductions in palatability ratings for high calorie foods (d = −0.71), monetary value for high-calorie binge foods (d = −0.47) and greater increases in attractiveness ratings of average weight models (d = 0.43). Results showed non-significant condition differences of being underweight v. healthy weight at posttest [odds ratio (OR) = 0.17, 95% confidence interval (CI) = 0.01–4.78] and of being overweight v. healthy weight at posttest (OR = 1.79, 95% CI = 0.30–10.56).
Results of condition × time effects from mixed effects growth models comparing combined BPT (n = 83) and waitlist control participants (n = 55)

s.e. = standard error.
Note. The waitlist control is the reference category (i.e. dummy coded 0).
Intervention effects on neural response to thin models and high-calorie foods
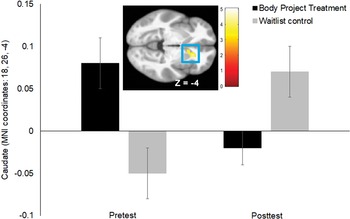
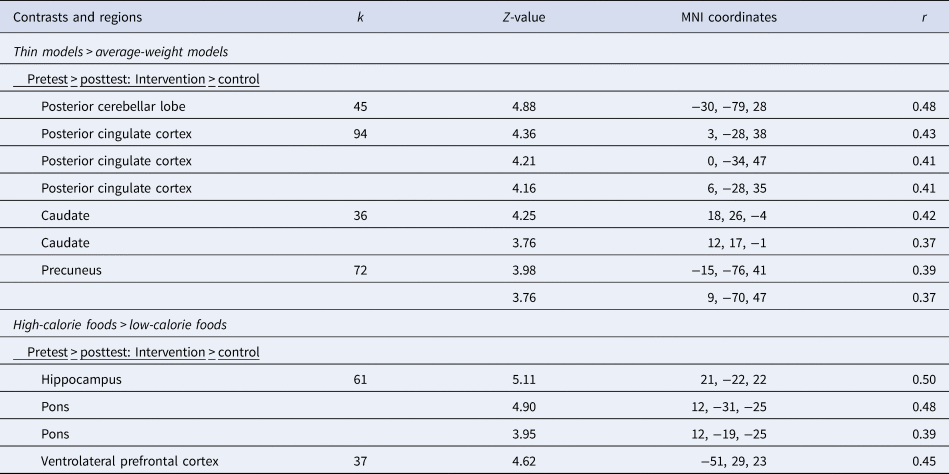
Whole brain analyses comparing BPT and control participants on change in BOLD activity response to thin >average-weight models showed significant group-x-time interactions in the left posterior cerebellar lobe (r = 0.48), the right posterior cingulate cortex (PCC r's = 0.41–0.43), right caudate (r's = 0.42 and 0.37; Figure 2), and left precuneus (r = 0.39 and 0.37). BPT participants showed greater decreases in BOLD activity in these regions than controls (Table 5). A priori ROI analyses showed a significant group × time interaction in the right caudate (MNI coordinates: 18, 26, −4, Z = 4.25, pFWE = 0.006) in response to thin >average-weight models, but not in the vmPFC. BPT participants showed significantly greater decreases in BOLD caudate activity in response to this contrast than controls. Follow-up analyses tested if these interactions were partially driven by group differences at baseline. The groups differed significantly in baseline BOLD activation in the right caudate [BPT Mean caudate response = 0.08 ± 0.20, control Mean caudate response = −0.05 ± 0.20: t(101) = 3.29, p = 0.001]. Paired t tests showed that BPT participants showed a significant reduction in right caudate response [pretest Mean caudate response = 0.08 ± 0.20, posttest Mean caudate response = −0.02 ± 0.16, t(63) = −2.95, p = 0.004] and control participants showed a significant increase in right caudate response [pretest Mean caudate response = −0.05 ± 0.20, posttest Mean caudate response = 0.07 ± 0.17, t(38) = 2.68, p = 0.01]. Results suggest that the caudate effect was partially driven by baseline differences in BOLD response and by significant increases in caudate responsiveness among controls.
Greater pre- to post BOLD response decreases in the right caudate (MNI coordinates: 18, 26, −4, Z = 4.25, k = 36) in response to the contrast thin model >average-weight model images in the BPT v. waitlist control condition. The SPM in this figure is thresholded at p > 0.001; k ⩾ 36. The color bars represent t-values.

Significant group-by-stimulus-by-time interactions in brain activation during exposure to food and model images: flexible factorial 2 × 2: intervention (n = 65) v. control (n = 39)

Notes. Peaks within the regions were considered significant at p < 0.001, k ⩾ 36, p < 0.05, corrected for multiple comparisons across the entire brain. Scan site was included as a covariate in the analyses.
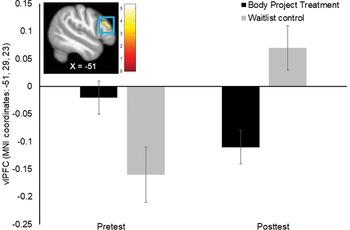
Whole brain analyses comparing BPT and control participants on change in BOLD activity in response to high-calorie >low-calorie foods showed a significant group × time interaction in the right hippocampus (r = 0.50), extending into the right pons (r = 0.48 and 0.39), and in the left ventrolateral prefrontal cortex (vlPFC r = 0.45); BPT participants showed greater decreases in BOLD activity in these regions than controls (Table 5). Follow-up analyses confirmed that there were no significant group differences in baseline BOLD activity. Figure 3 shows the significant group-×-time interaction in the vlPFC. As noted, there were no significant group differences at baseline: BPT Mean vlPFC response = −0.04 ± 0.24, control Mean vlPFC response = −0.10 ± 0.27: t(101) = 1.23, p = 0.22, d = 0.23, which communicates that this difference was due to chance. Paired t tests showed that BPT participants showed a non-significant reduction in left vlPFC response [pretest Mean vlPFC response = −0.04 ± 0.24, posttest Mean vlPFC response = −0.09 ± 0.25, t(63) = −1.09, p = 0.28] and control participants showed a significant increase in left vlPFC response [pretest Mean vlPFC = −0.10 ± 0.27, posttest Mean vlPFC response = 0.03 ± 0.21, t(38) = 2.82, p = 0.008]. Results suggest that the vlPFC effect was partially driven by significant increases in vlPFC responsiveness among controls. There were no significant group × time interactions in the a priori ROIs in response to this paradigm.
Greater pre- to post BOLD response decreases in the left vlPFC (MNI coordinates: −51, 29, 23, Z = 4.62, k = 37) in response to the contrast high-calorie foods >low-calorie foods in the BPT v. waitlist control condition. The SPM in this figure is thresholded at p > 0.001; k ⩾ 37. The color bars represent t-values.

Because effects might be different for participants who do not binge eat, we excluded participants with restricting AN (n = 3) or PD (n = 8) who reported no binge eating in the past year at pretest. Participants retained in analyses reported an average of 39 binge eating episodes in the past year (range 4–122). Similar to the original findings, whole brain analyses showed a significant group-×-time interaction in the right hippocampus (MNI coordinates: 21, −22, −22, Z = 4.69, k = 53, r = 0.49), extending into the right pons (MNI coordinates: 12, −31, −25, Z = 4.20, r = 0.44; 12, −19, −25, Z = 3.63, r = 0.38) and in the left vlPFC (MNI coordinates −51, 29, 23, Z = 4.63, k = 43, r = 0.48); BPT participants showed greater decreases in BOLD activity in these regions than controls. There were no significant group-×-time interactions in the a priori ROIs.
Discussion
The primary aim was to test whether the evidence of target engagement for BPT that we observed in our original report (Stice et al., Reference Stice, Yokum, Rohde, Shaw, Gau, Johnson and Johns2019) emerged when we recruited an additional 38 participants, based on concerns about the reproducibility of fMRI findings from small samples. Consistent with hypotheses, BPT participants showed a significantly greater reduction in caudate response to thin models than controls. The reduction occurred in the ventral caudate, which plays a role in encoding the reward value of stimuli (Duarte et al., Reference Duarte, Coelho, Brito-Costa, Cayolla, Afonso and Castelo-Branco2020). Reductions in right caudate response to thin models correlated with an increase in attractiveness ratings of average-weight models (see Supplementary Results). This finding replicates the reduction in caudate response to thin models in our smaller trial (Stice et al., Reference Stice, Yokum, Rohde, Shaw, Gau, Johnson and Johns2019) and dovetails with evidence that the Body Project eating disorder prevention program, which shares thin-ideal devaluation activities from BPT, also reduced caudate response to thin models (Stice, Yokum, & Waters, Reference Stice, Yokum and Waters2015). Also similar to the findings in our smaller trial, BPT v. control participants showed reductions in BOLD activation in the posterior cerebellar lobe, PCC, and precuneus in response to thin models. These latter regions are involved in visual processing, memory, and attentional motivation (Leech & Sharp, Reference Leech and Sharp2014; Stoodley, Valera, & Schmahmann, Reference Stoodley, Valera and Schmahmann2012). Results suggest that BPT reduces reward thin-ideal valuation and attentional bias for this ideal, which is important because thin-ideal valuation theoretically increases risk for emergence and maintenance of eating pathology (Fairburn, Reference Fairburn, Clark and Fairburn1997; Stice, Reference Stice1994).
BPT participants v. waitlist controls also showed significantly greater reductions in hippocampus, pons, and vlPFC response to high-calorie binge foods. These findings make a novel contribution because we only detected a reduction in parahippocampal gyrus response to high-calorie binge foods in our smaller sample. The vlPFC has been linked with tracking reward expectancy value (Pochon et al., Reference Pochon, Levy, Fossati, Lehericy, Poline, Pillon and Dubois2002) and is modulated by the value of available options during goal-directed choice (Hare, O'Doherty, Camerer, Schultz, & Rangel, Reference Hare, O'Doherty, Camerer, Schultz and Rangel2008), suggesting that BPT participants showed reduced valuation of high-calorie binge foods. Partially consistent with this interpretation, pre-post reduction in left vlPFC response to high-calorie binge foods >low-calorie foods correlated with an increase in monetary value of low-calorie foods but not with a decrease in monetary value of high-calorie binge foods (see Supplementary Results). The hippocampus plays a role in memory encoding and retrieval, including food memories (Stevenson & Francis, Reference Stevenson and Francis2017). The hippocampus modulates the salience of stimuli through regulation of ventral striatal dopamine release (Berridge & Robinson, Reference Berridge and Robinson1998) and has been implicated in food craving (Pelchat, Johnson, Chan, Valdez, & Ragland, Reference Pelchat, Johnson, Chan, Valdez and Ragland2004), physiological hunger (Haase, Cerf-Ducastel, & Murphy, Reference Haase, Cerf-Ducastel and Murphy2009) and negative energy balance (Stice, Burger, & Yokum, Reference Stice, Burger and Yokum2013). The pons responds to sensory stimuli including taste (Small et al., Reference Small, Gregory, Mak, Gitelman, Mesulam and Parrish2003). Collectively, results suggest that BPT reduces reward valuation of high-calorie binge foods, which may reduce risk for binge eating based on evidence that reward region response to high-calorie foods increases risk for future overeating (Yokum, Gearhardt, Harris, Brownell, & Stice, Reference Yokum, Gearhardt, Harris, Brownell and Stice2014).
A secondary objective was to test whether BPT produces larger effects for the primary outcomes when participants complete activities that reduce thin-ideal valuation prior to beginning to reduce eating disordered symptoms compared to the early symptom reduction BPT. Compared to controls, effect sizes for symptom reductions (d = 0.91) and abstinence from binge eating and compensatory behaviors (44%) for the original BPT were larger than parallel effect sizes for early symptom reduction BPT compared to controls (d = 0.40 and 41%, respectively). Although neither of these differences were significant, potentially due to limited power, effect sizes suggest that BPT is more effective if participants first complete activities that devalue the thin ideal before being asked to reduce eating disordered behaviors, which is another novel contribution.
Similar to findings in our smaller trial (Stice et al., Reference Stice, Yokum, Rohde, Shaw, Gau, Johnson and Johns2019), we found that BPT reduces thin-ideal internalization, body dissatisfaction, and negative affect. BPT also reduced palatability and monetary value ratings of high-calorie binge foods and increased attractiveness ratings of average-weight models. The reduction in monetary value of high-calorie binge foods is novel because we did not detect this effect in our smaller sample. The fact that we observed evidence of target engagement with both an objective biological measure and self-report measures is consistent with the goal of documenting target engagement at multiple levels of analysis (Insel et al., Reference Insel, Cuthbert, Garvey, Heinssen, Pine, Quinn and Wang2010).
Regarding study limitations, we were not able to randomize participants to the three conditions across both cohorts, though the three conditions did not differ significantly on measured variables. Further, only 32 participants were randomized to original BPT, which is less than the number assigned to the other conditions, limiting sensitivity to compare the two BPT versions. Finally, the present study does not demonstrate that the observed effects are specific to BPT because this trial did not include a condition wherein participants completed another treatment with different intervention targets, though BPT has been found to produce larger reductions in outcomes than a supportive mindfulness treatment (Stice et al., Reference Stice, Rohde, Shaw and Gau2019).
In conclusion, results from this larger sample provide additional evidence that BPT reduced reward-region response to thin models, replicating the reduced reward-region response to thin models exhibited by the smaller sample. Data from the larger sample provided novel evidence that BPT reduces reward-region response to high-calorie binge foods and self-report measures of intervention targets. Further, data provided novel evidence that the original BPT is more effective than the version that encouraged early symptom reductions. Results imply that future trials should evaluate the original BPT. It was encouraging that the 44% abstinence observed for the participants who completed the original BPT was higher than the 23–34% abstinence produced by extended cognitive behavioral therapy (CBT-E), the 33% abstinence rate produced by integrated cognitive affective therapy (ICAT), or the 35% abstinence rate produced by interpersonal psychotherapy (IPT; Fairburn et al., Reference Fairburn, Bailey-Straebler, Basden, Doll, Jones, Murphy and Cooper2015; Wonderlich et al., Reference Wonderlich, Peterson, Crosby, Smith, Klein, Mitchell and Crow2014), which are other longer trans-diagnostic eating disorder treatments. We confirmed that these trials used similar inclusion and exclusion criteria and examined similar populations, suggesting that the effects should be comparable. Data imply that the group-delivered BPT produces clinically meaningful reductions in outcomes and is more cost effective than other transdiagnostic eating disorder treatments that are delivered in 20 individual sessions. Analyses reported in the Supplementary Material confirmed that baseline eating disorder symptom severity did not moderate the effects of BPT (all p values >0.305), suggesting that BPT is similarly effective for individuals with a range of symptom severity. Although an outpatient treatment such as BPT would not be intensive enough for individuals with severe AN, BPT might be useful for patients with severe AN after they achieve a medically stable weight. Important directions for future research include determining how to increase the efficacy of this intervention, evaluating whether it is effective when implemented under real-world conditions, and determining how to encourage uptake of this cost-effective treatment.
Supplementary material
The supplementary material for this article can be found at https://doi.org/10.1017/S0033291721004049.
Acknowledgements
This trial was supported in part by a NIH grant MH111782 (PI Stice). The authors would like to thank the Lewis Center for Neuroimaging at the University of Oregon for their contribution and assistance in imaging for this investigation.
Financial support
All authors report no conflict of interest with respect to the content of this paper.