1. Introduction
The adoption of autonomous mobile robots has expanded significantly in recent years, finding applications in areas such as search and rescue [Reference Ruangpayoongsak, Roth and Chudoba1], environmental monitoring [Reference Lu and Han2], and logistics [Reference Oliveira, Röoning, Carvalho and Plentz3]. This widespread deployment has been enabled by advances in robotics, artificial intelligence (AI), and the Internet of Things (IoT), which together have paved the way for the development of Multi-Robot Systems (MRS) capable of operating in dynamic and often unpredictable environments.
Among these applications, logistics has emerged as a major frontier for automation, primarily driven by the rapid growth of e-commerce. The demand for fast and efficient order fulfillment has led to the adoption of smart warehouses, which rely on autonomous robot fleets to retrieve, transport, and deliver products to designated stations [Reference Boysen, de Koster and Weidinger4, Reference Gerkey and Matarić5]. However, the complexity of managing multiple robots in real time introduces new challenges, particularly in the domain of Multi-Robot Task Allocation (MRTA).
Unlike traditional warehouse operations based on fixed schedules and static layouts, smart warehouses are highly dynamic. They involve real-time task generation, heterogeneous robot fleets, multiple delivery stations, and constrained operating conditions such as limited energy or carrying capacity [Reference Oliveira, Röoning, Carvalho and Plentz3, Reference Pinkam, Bonnet and Chong6]. This scenario requires adaptive and scalable MRTA strategies that can make efficient decisions under uncertainty and with conflicting objectives.
To address these challenges, MRTA in smart warehouses is often modeled as a Capacitated Vehicle Routing Problem (CVRP), where robots must optimize their routes while considering payload limitations and time constraints [Reference Edelkamp and Lee7]. Extending this formulation, the present study applies metaheuristic optimization techniques to enhance the scalability, adaptability, and quality of task allocation solutions, thereby improving task allocation performance in dynamic multi-robot logistics scenarios [Reference Dou, Chen and Yang8].
MRTA is a core component of any MRS, as it directly impacts the system’s performance, responsiveness, and overall efficiency [Reference Sarkar and Agarwal9]. At its essence, MRTA seeks to assign a set of tasks to a group of robots in a way that optimizes predefined objectives, such as minimizing travel distance, balancing load, or reducing total execution time [Reference Chakraa, Guérin, Leclercq and Lefebvre10]. However, due to its NP-hard combinatorial nature, finding optimal solutions for large-scale MRTA instances is computationally infeasible [Reference Dahl, Matarić and Sukhatme11], motivating the use of heuristic and metaheuristic approaches such as Genetic Algorithms (GA), Variable Neighborhood Search (VNS), and Adaptive Intensification and Diversification Strategies (AINS) [Reference Braga and Lima12, Reference Li, Dong and Li13].
Several taxonomies have been proposed to guide the design of MRTA systems. A foundational classification by Gerkey and Matari’c [Reference Gerkey and Matarić5] organizes MRTA problems based on robot-task interactions: (i) Task Type: Single-task robots (ST) versus multi-task robots (MT); (ii) Robot Type: Single-robot tasks (SR) versus multi-robot tasks (MR); (iii) Assignment Type: Instantaneous assignment versus time-extended assignment. This taxonomy was later extended by Korsah et al. [Reference Korsah, Stentz and Dias14], who introduced additional dimensions, including task dependencies, robot heterogeneity, and resource constraints, making it better suited for real-world scenarios like those encountered in smart warehouses.
Despite the growing interest in applying metaheuristics to MRTA, most existing multi-objective approaches rely on classical frameworks such as Non-dominated Sorting Genetic Algorithm II (NSGA-II) and Multi-Objective Evolutionary Algorithm based on Decomposition (MOEA/D), which, while effective, often require extensive computational effort and may suffer from premature convergence in complex, dynamic environments like smart warehouses. Furthermore, traditional local search strategies, such as deterministic Variable Neighborhood Descent (VND), lack the flexibility to adapt to varying instance characteristics during runtime. This article addresses this gap by proposing a novel hybrid metaheuristic, Multi-Objective VNS with Adaptive Intensification and Diversification (MOVNS-AINS), which extends the MOVNS framework by incorporating an adaptive local search mechanism. Unlike fixed neighborhood traversal schemes, the proposed method employs a stochastic, feedback-driven strategy that dynamically alternates between exploration and exploitation based on solution quality improvements. This results in faster convergence, enhanced diversity, and improved scalability across large-scale MRTA scenarios.
To effectively validate and compare these optimization strategies within realistic operational settings, this research aims to develop a framework for MRTA in smart warehouse environments using the capabilities of NVIDIA Omniverse. The study focuses on implementing and evaluating various task allocation strategies, including classical heuristics and advanced metaheuristic methods such as MOVNS-VND, NSGA-II, and MOVNS-AINS. A key aspect of the work involves incorporating heterogeneous robotic agents with varying energy profiles and operational constraints, reflecting realistic deployment scenarios. To ensure thorough experimentation, the framework is designed to support the generation of diverse task instances, enabling robust evaluation under different warehouse conditions. Finally, the goal is to assess the performance and scalability of each task allocation method, providing insights into their effectiveness in dynamic, real-time environments. The main contributions of this article include:
-
• A modular and extensible MRTA optimization framework capable of addressing task allocation in structured warehouse environments with heterogeneous robots and dynamic constraints.
-
• An integration of multi-objective metaheuristic solutions into high-fidelity warehouse simulation using NVIDIA Omniverse Isaac Sim.
-
• A thorough comparative analysis of classical, evolutionary, and adaptive local search methods based on operational and Pareto-based metrics.
-
• The release of a benchmark dataset and simulation assets designed for evaluating MRTA algorithms in grid-based warehouse environments with realistic navigation and capacity constraints.
-
• A capacity-aware and energy-conscious task allocation scheme that enhances autonomy and robustness of MRS under resource limitations.
2. Related works
The automation of smart warehouses has seen a significant rise in recent years, with a growing emphasis on using autonomous mobile robots for goods retrieval and transportation [Reference Oliveira, Röoning, Carvalho and Plentz3]. This trend is driven by the increasing complexity of order fulfillment in e-commerce and logistics, where efficiency and speed are critical factors. Automated picking robots, such as the one presented in ref. [Reference Boysen, de Koster and Weidinger4], have been widely adopted to streamline warehouse operations, reduce manual labor costs, and improve operational performance.
In this context, the MRTA problem has become central to warehouse robotics. MRTA involves assigning a set of tasks to a team of robots to optimize performance under various constraints. According to the formal taxonomy introduced by Gerkey and Mataric [Reference Gerkey and Matarić5], MRTA problems can be categorized based on task multiplicity (Single-Task vs. Multi-Task), robot assignment (Single-Robot vs. Multi-Robot), and temporal scope (Instantaneous vs. Time-Extended). Korsah et al. [Reference Korsah, Stentz and Dias14] extended this classification by incorporating task dependencies, resource constraints, and dynamic task arrivals, thereby offering a more realistic model for complex environments such as smart warehouses. Regarding the formation, the work of Abujabal et al. [Reference Abujabal, Fareh, Sinan, Baziyad and Bettayeb15] presented a comprehensive review of multi-robot formation in addition to highlighting the basic problems involved in this field.
A key factor in MRTA performance is the composition of the robotic fleet. Heterogeneous robots, with distinct capabilities or costs, enable greater flexibility, robustness, and economic efficiency compared to homogeneous fleets [Reference Gerkey and Matarić5, Reference Korsah, Stentz and Dias14]. By utilizing specialization and complementary functionalities, heterogeneous fleets can address a broader range of tasks while operating more effectively under varying load and resource constraints. Recent studies have further highlighted the role of enhancing cooperative performance. For instance, Zhao et al. [Reference Zhao, Zhao, Liu, Su and Meng16] analyzed the workspace boundaries of coordinated lifting systems using multi-robot rolling bases, emphasizing the challenges of physical coordination and heterogeneous actuation. Note that such works remain focused on kinematic feasibility rather than dynamic task allocation, which reinforces the need for MRTA frameworks that integrate heterogeneity within the task optimization process.
Given the NP-hard nature of MRTA, numerous optimization strategies have been employed. These range from classical methods, such as Integer Linear Programing (ILP) and CVRP, to heuristics and metaheuristics, including Genetic Algorithm (GA), Ant Colony Optimization (ACO), and multi-objective evolutionary algorithms (MOEAs). Beyond these classical metaheuristics discussed above, several recent state-of-the-art algorithms have been applied to MRTA. The NSGA-III [Reference Deb and Jain17] and MOEA/D [Reference Zhang and Li18] frameworks are the foundations for reference-point and decomposition-based multi-objective search, respectively, and have inspired a new generation of algorithms with improved convergence and diversity performance in robotic coordination problems. For instance, enhanced NSGA-III variants have been applied to optimize collaborative task allocation [Reference Shen, Tang, Mohd Ariffin, As’arry and Wang19], while adaptive MOEA/D approaches have been extended to consider objectives such as smoothness, traveling time, terrain (elevation), and speed limit [Reference Zhou, Chieng, Lee, Ji and Li20]. In parallel, hybrid frameworks combining evolutionary operators with deep reinforcement learning (DRL) [Reference Li, Shi, Zhao and Zhang21, Reference de Castro, Berger, Cantieri, Teixeira, Lima, Pereira and Pinto22] have emerged as a prominent research direction. These advances highlight the growing trend of integrating learning-based adaptability with evolutionary robustness in MRTA systems. The choice of optimization approach, therefore, depends on the problem size, real-time requirements, and the number of objectives to be optimized, typically including travel time, workload balance, and energy usage.
One of the earliest MRTA formulations in warehouse environments is presented in ref. [Reference Edelkamp and Lee7], which addresses the problem as a CVRP with clustering followed by routing heuristics. The method assumes homogeneous robots and static environments, using a greedy approach to minimize total distance. Similarly, Pinkam et al. [Reference Pinkam, Bonnet and Chong23] employ a greedy allocation policy for identically capacitated robots and tasks. While these approaches are efficient for static, small-scale setups, they fall short in dynamic or heterogeneous contexts. Still in the warehouse environment, the authors of Shan et al. [Reference Shan, Jin, Jurt and Li24] proposed a decentralized auction-based method to address continuously arriving tasks and time constraints. Their approach involves robots predicting the task choices of their peers, estimating the values and partnerships associated with MR tasks, and ultimately determining their task choices and collaboration partners through an auction process. Their framework primarily targets homogeneous fleets and does not integrate multi-objective optimization or adaptive reallocation strategies.
Building on hybrid approaches, Dou et al. [Reference Dou, Chen and Yang25] introduced a hybrid method that combines GA for task scheduling and Reinforcement Learning for path planning, evaluated based on travel time, cost, and workload balance. However, these metrics are merged into a single fitness function, precluding proper multi-objective trade-off analysis.
Zhuang et al. [Reference Zhuang, Huang, Sun and Qin26] proposed a mixed-integer model with a Hybrid Artificial Bee Colony (HABC) heuristic for order-picking tasks. The formulation handles sequence-dependent constraints but lacks scalability and comparative evaluation with other metaheuristics.
Wang et al. [Reference Wang, Pan, Li, Sang and Wang27] presented a multi-objective teaching–learning-based optimizer (MOTLBO) for cooperative task allocation between weeding robots and spraying drones in smart farms. Their methodology uses heuristic initialization, multi-teacher learning, and multi-neighborhood local search to optimize completion time and resource utilization, showing convergence and solution diversity. However, they did not consider online reallocation or fleet heterogeneity in industrial settings.
Recent studies have addressed new operational constraints, such as energy harvesting. Mokhtari et al. [Reference Mokhtari, Haji Ali Mohamadi, Aernouts, Singh, Vanderborght, Weyn and Famaey28] developed an APSO-based scheduler that minimizes makespan for robots powered by ambient energy sources. Their job-shop formulation includes sequence-dependent setups, but the model remains single-objective and does not consider Pareto-optimal fronts or reallocation policies.
In the domain of distributed systems, Kattepur et al. [Reference Kattepur, Rath, Simha and Mukherjee29] proposed an agent-based decentralized optimization framework for Industry 4.0 warehouses. While promoting scalability and fault tolerance, their method lacks quantitative benchmarking and does not incorporate multi-objective considerations.
A growing number of recent works have adopted multi-objective evolutionary strategies to better handle the inherent trade-offs in MRTA. Peng et al. [Reference Peng, An, Li and Peng30] applied NSGA-II to balance total and maximum travel cost per robot using a dynamic bidding mechanism. Despite showing good adaptability, their method does not explore hybridization or alternative initialization schemes.
Zhao et al. [Reference Yu, Tang, Jiang and Fan31] proposed a bi-level framework integrating DRL with local search for multimodal MRTA. Their formulation minimizes makespan and energy consumption but omits Pareto post-analysis and uses only two objectives.
Garcia Gonzalez et al. [Reference González, Villar, Chira, de la Cal, Sánchez and Sedano32] utilize NSGA-III to minimize path lengths and reduce collision risk in warehouse navigation. Similarly, Shen and Meng [Reference Shen and Meng33] combine NSGA-II and MOPSO to allocate inspection tasks in railway scenarios while minimizing makespan and travel.
These works give an overall idea of the recent shift toward Pareto-based, multi-objective MRTA optimization, emphasizing robustness, flexibility, and real-time feasibility. Table I provides a structured overview of representative MRTA methods, highlighting their problem models, optimization techniques, objective structures, and adaptability. Although recent studies have improved performance through evolutionary optimization, key limitations remain. Few methods combine Pareto-based strategies with reallocation and navigation, and fewer still consider heterogeneous robot capabilities at scale.
Comparison of MRTA approaches in smart warehouses.

Table I. Long description
A table comparing various MRTA approaches in smart warehouses, detailing problem models, optimization techniques, objective structures, and adaptability. The table has 11 rows and 9 columns. Column headers are Reference, Problem model, Stat/Dyn, Hom., Cap., Allocation technique, Multi-obj., Criteria, Realloc., Navigation. Row 1: Reference, Problem model, Stat/Dyn, Hom., Cap., Allocation technique, Multi-obj., Criteria, Realloc., Navigation. Row 2: [7], CVRP, Static, Yes, Yes, Clustering + Routing Heuristic, No, Distance, No, -. Row 3: [23], Greedy Assignment, Static, Yes, Yes, Greedy, No, Distance, No, -. Row 4: [25], GA + RL, Dynamic, Yes, Yes, Genetic + Learning, No, TTC, TT, BU, No, -. Row 5: [34], ILP + GA (OP-MATSP), Static, Yes, Yes, ILP + GA, Yes, Distance, No, -. Row 6: [28], APSO + JSSP, Static, Yes, Yes, Particle Swarm, No, Makespan, No, -. Row 7: [31], Bi-Level + DRL, Dynamic, Yes, Yes, DRL + Local search, Yes, Makespan, Energy, Yes, -. Row 8: [32], NSGA-III, Static, Yes, Yes, Evolutionary algorithm, Yes, Path, Collision, No, -. Row 9: [33], NSGA-II + MOPSO, Dynamic, Yes, Yes, Hybrid EA + PSO, Yes, Time, Distance, No, -. Row 10: [30], NSGA-II + Auction, Dynamic, Yes, Yes, Evolutionary + Market, Yes, MINISUM, MINIMAX, Yes, -. Row 11: [26], MILP + HABC, Static, No, Yes, MILP + Metaheuristic, No, Execution Time, No, -. Row 12: [29], Distributed Optimization, Dynamic, No, No, Distributed agents, No, Execution Time, Yes, -. Row 13: This article, MOVNS-AINS + NSGA-II, Dynamic, Yes/No, Yes, Hybrid Heuristic + Metaheuristic, Yes, Time, Distance, Balance, Yes, A*.
As shown in Table I, most existing approaches rely on either evolutionary algorithms or fixed local search strategies, without incorporating adaptive mechanisms to guide the search process. In particular, VNS-based and hybrid metaheuristics typically employ deterministic and often exhaustive neighborhood exploration schemes, which may limit efficiency and scalability in dynamic environments. This suggests that the integration of adaptive, feedback-driven neighborhood selection within multi-objective MRTA frameworks remains limited in the current literature. To address this limitation, the proposed MOVNS-AINS departs from traditional MOVNS approaches by introducing an adaptive, non-exhaustive local search mechanism, thereby enabling a more efficient balance between intensification and diversification.
3. Methodology
This section provides a detailed description of the methodology used to solve the MRTA problem in smart warehouses. The proposed approach includes defining warehouse scenarios, mathematical modeling of robots and tasks, establishing mathematical formulations, and implementing optimization algorithms for task allocation.
3.1. Definition of simulation scenarios
To evaluate the effectiveness of our proposed framework, multiple warehouse configurations, robot models, and task distributions were considered. The warehouse environments are designed to simulate real-world logistics operations, incorporating both static and dynamic task assignments. In static scenarios, all tasks are known in advance, whereas in dynamic scenarios, new tasks emerge over time, necessitating adaptive allocation strategies to optimize system performance [Reference Li, Barenji, Jiang, Zhong and Xu35]. Robots operate in a structured grid layout, where shelves form small aisles with three levels of storage. The task execution follows a pick-and-place operation where robots collect items from specific storage locations and transport them to designated delivery stations. The number of delivery stations varies, considering both single-depot and multi-depot configurations.
The fleet of robots is modeled to include both homogeneous and heterogeneous configurations. In a homogeneous fleet, all robots have identical specifications regarding load capacity, velocity, and battery autonomy. In contrast, in a heterogeneous fleet, robots exhibit different load capacities and speeds, which introduces additional complexity to the task allocation process. It is important to note that all robots are capable of handling any box, limited only by their current carrying capacity.
Once the warehouse layout and robot types are established, task modeling defines how robots interact with storage corridors and shelves. Unlike traditional MRTA formulations, this article proposes defining the tasks at the granularity of corridors rather than individual items (boxes). Each task thus corresponds to the retrieval operation along an entire corridor. Tasks are defined by their entry and exit points, which are dynamically determined based on the sequence of tasks assigned to each robot. This approach ensures that each task contains multiple boxes located along the corridor, optimizing the robot’s retrieval path, as illustrated in Figure 1.
Example of task generation from a corridor. Each task aggregates multiple boxes from a single corridor, taking into account entry and exit points, as well as a pickup route.

Defining tasks at the corridor level rather than the individual box level strategically reduces computational complexity while preserving operational realism, ensuring that the simulation aligns with practical warehouse workflows. This abstraction offers several advantages:
-
• Reduced Complexity: Handling fewer but more comprehensive tasks simplifies the allocation problem significantly, reducing computational complexity.
-
• Increased Efficiency: Grouping boxes along corridors allows robots to collect multiple items in a single trip, minimizing the total distance traveled and time spent.
-
• Better Workload Balance: Corridor-level tasks help distribute workload more evenly among robots, as each task inherently has multiple items, thereby promoting balanced utilization.
Each task, therefore, comprises specific characteristics, including:
-
• Corridor Cells: A sequence of grid cells representing the physical layout of the corridor.
-
• Entry and Exit Points: Points located at opposite ends of the corridor, dynamically assigned depending on the previous task executed by the robot.
-
• Boxes per Corridor: A set of items to be retrieved, each identified by their exact position on the racks and corresponding shelf level.
-
• In-corridor Service Time
 $I_t$
: A task-level parameter representing the expected time required to traverse the corridor and retrieve all associated boxes. This value is proportional to the number of boxes and the length of the aisle and includes an averaged overhead for unload trips when the robot reaches its carrying capacity. The parameter
$I_t$
formally captures all intra-corridor operations that contribute to the execution time of task
$t$
. This includes walking inside the aisle, stopping at each box location, picking items from the racks, and the amortized cost of unload cycles when necessary. As detailed later in the makespan formulation (Subsection 3.2),
$I_t$
is explicitly incorporated into the time objective
$f_2$
, ensuring that tasks with higher internal workload are not underestimated in the optimization.


The navigation of robots is constrained by the warehouse layout, where narrow aisles introduce restrictions on movement. To ensure feasible path planning and avoid collisions, we employ the A
 $^{\star }$
algorithm [Reference Hart, Nilsson and Raphael36], which dynamically computes the shortest path between locations while taking obstacles into account. This enables robots to navigate the environment efficiently while minimizing congestion and deadlocks.
3.2. Mathematical formulation of MRTA
The formulation considers three main objectives: (i) route efficiency, (ii) makespan minimization, and (iii) workload balance, subject to operational capacity constraints. Accordingly, the MRTA problem is expressed as a multi-objective optimization problem, where the goal is to minimize the total travel distance, balance the workload across robots, and ensure efficient task completion. Let
 $R$
be the set of robots and
 $T$
be the set of tasks. We define a binary decision variable
 $x_{rt}$
, which takes the value 1 if robot
 $r$
is assigned to task
 $t$
and 0 otherwise:
 \begin{equation} x_{rt} = \begin{cases} 1, & \text{if robot } r \text{ is assigned to task } t, \\ 0, & \text{otherwise}. \end{cases} \end{equation}
Three objective functions are considered in this formulation:
The first objective minimizes the overall distance traveled by all robots, promoting route efficiency:
 \begin{equation} f_1 = \sum _{r \in R} \sum _{t \in T} d_{rt} \cdot x_{rt}, \end{equation}
where
 $ d_{rt}$
represents the estimated distance from the current position of robot
 $ r$
to the location of task
 $ t$
.
The second objective seeks to minimize the maximum execution time among all robots, thereby avoiding excessive workload concentration on any single robot. This is commonly referred to as makespan, and it is formulated as:
 \begin{equation} f_2 = \max _{r \in R} \sum _{t \in T} x_{rt} \left ( \frac {d_{rt}}{V_r} + I_t \right ), \end{equation}
where
 $V_r$
denotes the constant velocity of robot
 $r$
,
 $d_{rt}$
is the travel distance associated with serving task
 $t$
in the route of robot
 $r$
, and
 $I_t$
is the expected in-corridor service time of task
 $t$
. The term
 $I_t$
aggregates the time spent walking inside the corridor, picking all boxes associated with that corridor-task, and the average overhead of unload trips when the robot reaches its carrying capacity.
The third objective addresses the equitable distribution of workload among robots. In the proposed framework, the workload of each robot is defined as the cumulative execution effort associated with its assigned route, combining both task execution time and travel cost throughout mission execution.
Let
 $W_r$
denote the workload of robot
 $r$
, which aggregates (i) the time required to execute tasks (including in-corridor service time) and (ii) the cost of traveling between task locations along the robot’s route.
To encourage fair task assignment, the workload balance objective minimizes the dispersion of workloads among robots. We adopt the standard deviation of
 $\{W_r\}_{r \in R}$
as the imbalance metric:
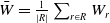
 \begin{equation} f_3 = \sqrt {\frac {1}{|R|}\sum _{r \in R} (W_r - \bar {W})^2}, \end{equation}
where
 $\bar {W} = \frac {1}{|R|}\sum _{r \in R} W_r$
denotes the average workload across all robots.
Minimizing
 $f_3$
drives the optimization process to allocate tasks such that execution effort is more evenly distributed across the fleet, preventing overloading of specific robots and promoting more synchronized mission completion.
This definition is consistent with the implementation used in the experiments, where each robot workload aggregates both travel-related cost and task execution effort along the assigned route.
To improve the clarity of the proposed methodology, Algorithm 1 summarizes the overall workflow of the MRTA optimization framework. The subsequent subsections describe in detail each stage of the proposed approach, including problem formulation, initialization strategies, and the optimization procedures.
MRTA optimization framework workflow

Algorithm 1 Long description
An equation describing the workflow of an MRTA optimization framework. The algorithm starts with inputs W, R, T, M, and tau. It precomputes a distance matrix Drt using A* for all robots r in R and tasks t in T. It initializes P0 using RandomAllocation and RandomizedGreedy functions. The algorithm then iterates over each solution s in P0, computing schedules and objectives via UnloadPointCalc. It identifies the non-dominated subset of P0 and checks if the method M is NSGA-II. If true, it initializes P with P0 and enters a loop that continues while the elapsed time is less than tau. Inside this loop, it initializes an empty set C and enters another loop that continues while the size of C is less than the size of P. It selects p1 and p2 via Tournament, mutates and crosses over them, and evaluates the objectives. It updates P and A using the crowding-distance and UpdateArchive functions. If the method M is MOVNS-AINS, it enters a loop that continues while the elapsed time is less than tau. It shakes s from A with k equals 3, selects N from 9 operators, and repeats until no improvement is made. It updates A with the improved solution s prime. Finally, it returns the updated archive A.
3.3. Initial task allocation strategies
The initial assignment of tasks establishes the foundation for subsequent optimization. In this article, two strategies are adopted: a purely random allocation, which provides a baseline by distributing tasks without any spatial consideration; and a randomized greedy method, which uses A
 $^{\star }$
distances between robots and task entry points to guide assignments, while still incorporating stochastic elements to maintain diversity and avoid deterministic patterns.
After assigning tasks, an auxiliary step checks when each robot must unload to comply with its capacity limits. This ensures feasibility before any refinement or evaluation takes place.
3.3.1. Random allocation
The random allocation method serves as a baseline strategy in which tasks are assigned to robots without considering any optimization criteria. The algorithm begins by randomly shuffling the list of tasks to eliminate any inherent ordering bias. Subsequently, each task is sequentially assigned to a randomly selected robot, continuing this process until all tasks are distributed.
This approach offers the advantage of being extremely fast and straightforward to implement. Moreover, by introducing randomness in both task order and robot assignment, it enables the generation of a wide variety of initial solutions, which can be beneficial for metaheuristic frameworks that rely on population diversity.
However, the main limitation of this method lies in its lack of awareness of optimization. Since task assignments are performed arbitrarily, the resulting solutions tend to exhibit poor performance in terms of travel distance and workload distribution. Consequently, random allocation is typically used only for comparison purposes or as an initial population generator for more sophisticated optimization techniques.
3.3.2. Randomized greedy allocation
The randomized greedy allocation method aims to combine informed task assignment with solution diversity. For each task, the algorithm calculates the distance from all robots to the task’s entry point using the A
 $^{\star }$
path planner. Based on these distances, a restricted candidate list (RCL) is formed, containing the robots that are closest to the task. One robot is then selected at random from this list to execute the task, introducing controlled randomness into the decision process.
After a robot is assigned a task, its position is updated to the exit point of that task, ensuring that subsequent assignments account for realistic routing. This process continues iteratively until all tasks are distributed. Finally, a feasibility check is conducted to determine when each robot must unload, taking into account capacity limits and ensuring that the resulting plan is executable.
3.3.3. Unload point calculation
After the task allocation process is complete, each robot’s route is further processed to determine when unloading actions are necessary. For each robot, the number of boxes carried is cumulatively tracked along its task sequence. Whenever the accumulated load exceeds the robot’s transport capacity, an unloading operation is scheduled at the nearest unload station. The robot then proceeds to this point, resets its load to zero, and resumes execution starting from the exit point of the last completed task. This logic guarantees that each task sequence remains feasible to the robot’s load constraints, incorporating necessary detours for unloading while preserving the execution order of tasks.
3.3.4. Metric computation
Once the initial task allocation and unload schedule are determined, we compute the solution’s performance metrics:
-
• Total travel distance: The sum of distances traveled by all robots, considering their assigned tasks and unloading trips.
-
• Total execution time: The time required for the last robot to complete its route.
-
• Workload balance: The variability in cumulative workload across robots.
These metrics enable the comparison of different allocation strategies and serve as a reference for further refinement of metaheuristics.
3.4. Metaheuristic optimization strategies
Once the initial set of solutions is generated, two metaheuristic approaches are applied to refine the initial task allocations and enhance overall system performance. The optimization process follows two primary approaches:
-
• NSGA-II: A multi-objective evolutionary algorithm that iteratively improves task assignments through crossover, mutation, and selection mechanisms.
-
• MOVNS-AINS: A local search-based metaheuristic that combines randomized neighborhood selection and systematic improvement. Instead of relying on random mutations, it applies structured VND operations to escape local optima and improve the dominance quality of solutions.
3.4.1. Generation of the initial population
The initial population consists of multiple task allocation solutions that serve as input for the metaheuristic algorithms. Two types of populations are considered:
-
• Fully random population: Composed entirely of solutions generated using the Random Allocation strategy.
-
• Hybrid population: Contains a mix of solutions, with half generated randomly and half generated using the Randomized Greedy Allocation strategy.
This hybrid approach ensures diversity in the search space while maintaining a certain level of quality from the outset.
3.4.2. NSGA-II optimization
To refine the initial solutions, this article employs NSGA-II, a well-established multi-objective genetic algorithm introduced by Deb et al. [Reference Deb, Pratap, Agarwal and Meyarivan37]. The optimization process follows these steps:
-
1. Crossover: In the crossover phase, new candidate solutions are created by combining segments of task assignments from two parent solutions. A portion of tasks from the first parent is directly inherited by the child, while the remaining tasks are completed based on their order of appearance in the second parent. This process helps preserve important structural elements from both parents while introducing new permutations. A second child solution is also generated by reversing the roles of the parents, promoting diversity within the population.
-
2. Mutation: To promote diversity and enable the exploration of new regions in the solution space, mutation operations are applied to the offspring. These operations include swapping the order of tasks assigned to a specific robot and reallocating a task to a different robot, provided that feasibility constraints are respected. As a result of the crossover and mutation steps, the population size temporarily doubles, making a selection phase necessary to retain only the most promising individuals.
-
3. Selection via crowding distance: NSGA-II employs non-dominated sorting, followed by crowding distance selection, to filter out inferior solutions. The best individuals are retained based on their Pareto dominance and their distribution in the objective space, ensuring a diverse and high-quality set of solutions for the next iteration. This process is repeated until the convergence criteria are met.
Multi-objective genetic optimization

Algorithm 2 NSGA-II: Long description
An equation describing a multi-objective genetic optimization algorithm. The algorithm starts with an initial population P zero, number of generations G, and population size N. It ensures the final non-dominated solution set P. The steps include evaluating all individuals in the initial population, iterating through generations, selecting parents, applying crossover and mutation, evaluating combined populations, and extracting non-dominated solutions. The algorithm uses functions like SegmentCrossover and FastNonDominatedSort to process the population and select individuals based on crowding distance.
3.4.3. Proposed strategy: MOVNS-AINS
In contrast to evolutionary approaches such as NSGA-II, local search-based metaheuristics offer an alternative path for solution refinement by systematically exploring neighborhoods to intensify the search around local optima while incorporating mechanisms to escape them. Among these, VNS and its variants are widely recognized for their simplicity and effectiveness in combinatorial optimization problems [Reference Mladenovic and Hansen38].
VNS is built upon the principle that a local optimum with respect to one neighborhood structure is not necessarily a local optimum with respect to another. It, therefore, alternates between exploration and exploitation through two complementary phases:
-
• Shake (Perturbation): A solution is perturbed to escape local optima by moving to a different region in the search space.
-
• Local search: A local improvement method is applied to the perturbed solution to exploit promising areas.
A common implementation of the local search phase in VNS is the VND, which explores a predefined sequence of neighborhood structures
 $\{\mathcal{N}_1, \mathcal{N}_2, \ldots , \mathcal{N}_k\}$
in a deterministic fashion [Reference Hansen, Mladenovic and Pérez39]. If an improvement is found in neighborhood
 $\mathcal{N}_i$
, the search returns to
 $\mathcal{N}_1$
; otherwise, it progresses to
 $\mathcal{N}_{i+1}$
.
In multi-objective problems such as MRTA, the VNS framework is extended to form Multi-Objective Variable Neighborhood Search (MOVNS), where the acceptance criterion is based on Pareto dominance [Reference Dahite, Kadrani, Benmansour, Guibadj and Fonlupt40]. That is, a new solution
 $s''$
replaces the current one
 $s'$
if it dominates it. An external archive is typically used to maintain a set of non-dominated solutions found during the search.
Despite the robustness of MOVNS, variants relying on deterministic local search, like VND, may suffer from rigidity due to fixed neighborhood order and exhaustive search patterns. In conventional VND, the algorithm explores all neighborhood operators in a fixed, sequential order until no further improvement occurs. Although this exhaustive search increases reliability, it can also lead to redundant evaluations and longer computation times in large-scale MRTA scenarios. Classical MOVNS implementations typically extend this principle to multi-objective contexts but still rely on exhaustive traversal and static neighborhood probabilities, which can lead to unnecessary evaluations and slower convergence in large-scale instances. To overcome these limitations, this article proposes the MOVNS-AINS, a hybrid metaheuristic designed to promote both intensification and diversification through an adaptive strategy.
Rather than attempting an exhaustive local optimization, MOVNS-AINS adopts a fast and opportunistic local improvement strategy. At each iteration, the choice of neighborhood is dynamically adjusted according to two factors: (i) the historical success rate of operators and (ii) the magnitude of the improvement achieved in previous iterations. This adaptive feedback mechanism concentrates the search on the most productive neighborhoods while retaining stochastic exploration, which accelerates convergence and reduces computational overhead compared to deterministic MOVNS or VND variants. The detailed procedure is summarized in Algorithm 3, outlining the core steps of the MOVNS-AINS solution:
-
1. Shake (Solution diversification): The incumbent solution
$s$
is perturbed via a shake operation, producing
$s'$
in a new region of the search space. -
2. Adaptive local search: While improvements are found:
-
(a) Randomly select a neighborhood operator
$\mathcal{N}_i \in \mathcal{N}$
. -
(b) Apply
$\mathcal{N}_i$
to
$s'$
to produce a candidate
$s''$
. -
(c) If
$s''$
dominates
$s'$
, update
$s' \leftarrow s''$
and continue. -
(d) If no improvement is found, terminate the local search.
-
-
3. Archive update: Add
$s'$
to the external Pareto front if it is non-dominated.


This adaptive mechanism differs from traditional VND by allowing the algorithm to terminate the local search early if no improvement is detected, thus conserving computational resources and enabling broader exploration. By alternating between exploratory shakes and focused improvements, MOVNS-AINS provides a flexible search process suited to the dynamic and multi-objective nature of MRTA, balancing convergence speed with solution diversity.
Adaptive intensification and diversification

Algorithm 3 MOVNS-AINS: Long description
An algorithm for improving a solution pool through adaptive intensification and diversification. The algorithm starts with an initial solution pool P and a set of neighborhoods N. The goal is to produce an improved solution pool P prime. The algorithm initializes P prime as an empty set. For each solution s in P, it performs a shake operation to perturb the solution, resulting in s prime. It then enters a while loop that continues as long as improvements are found. Within this loop, it selects a random neighborhood N from the set of neighborhoods, applies this neighborhood to s prime to produce a candidate solution s double prime. If s double prime dominates s prime, it updates s prime to s double prime and continues the loop. If no improvement is found, it sets improved to false and exits the loop. After exiting the loop, it adds s prime to P prime. This process repeats for each solution in the initial pool, and finally, the improved solution pool P prime is returned.
3.4.4. Pareto front maintenance
After each optimization step, the algorithm updates the Pareto front by comparing the newly generated solution with the existing set of non-dominated solutions. If the new solution dominates any current members of the front, those dominated solutions are removed. Conversely, if the new solution is dominated by any existing one, it is discarded. In cases where there is no dominance relation between the new solution and the existing ones, it is added to the Pareto front.
This procedure, which allows the algorithm to progressively refine the set of trade-off solutions while preserving both quality and diversity, is consistent with methodologies found in the literature. A notable example is the addSolution method proposed by Lust and Teghem [Reference Lust and Teghem41], which incorporates weak dominance to ensure robust Pareto front maintenance in multi-objective local search algorithms.
This ensures that the algorithm maintains a diverse and high-quality set of trade-off solutions throughout its execution.
3.5. Neighborhood structures for VND and MOVNS-AINS
To improve the solutions obtained in the initial allocation phase, we apply VND and MOVNS-AINS. These approaches explore different neighborhood structures to iteratively enhance solutions by performing task reassignments within and between robots.
The choice of neighborhoods follows a structured approach to avoid premature convergence while balancing exploration and exploitation. Below, we describe the different types of neighborhood operations considered in our framework.
3.5.1. Intra-robot task swaps
These operators modify the task sequence within a single robot’s route, aiming to reduce travel distance, improve workload balance, or optimize the use of available capacity.
(1) Swapping two nearby tasks within the same robot: In this operation, two consecutive tasks assigned to the same robot are swapped to verify whether a small reordering improves efficiency. The goal is to minimize local inefficiencies due to suboptimal sequencing. Formally, given a robot
 $r$
assigned to tasks
 $\{t_1, t_2, \ldots , t_n\}$
in order, we evaluate:
 \begin{equation} \text{swap}(t_i, t_{i+1}) \quad \text{for} \quad i = 1, \ldots , n-1 \end{equation}
where
 $d_{t_i, t_{i+1}}$
is the distance between the exit of
 $t_i$
and the entry of
 $t_{i+1}$
. The swap is accepted if it improves one of the three metrics.
(2) Swapping two distant tasks within the same robot: While the previous operator focuses on consecutive tasks, this operation swaps tasks that are far apart within the same robot’s sequence. The objective is to detect and resolve inefficiencies where a robot visits two distant locations early and late in its route, instead of grouping them closer.
Given a robot
 $r$
assigned to
 $\{t_1, t_2, \ldots , t_n\}$
, we evaluate:
 \begin{equation} \text{swap}(t_i, t_j) \quad \text{for} \quad i,j \in \{1, \ldots , n\}, \quad i \neq j, \quad d_{t_i, t_j} \gt d_{\text{avg}} \end{equation}
where
 $d_{\text{avg}}$
is the average task distance within the robot’s allocation. In case the swap is accepted, it reduces the total travel cost or improves workload balance.
(3) Reordering blocks based on capacity constraints: Tasks are grouped into blocks such that each block fits within the robot’s capacity. Each block is reordered using a nearest-neighbor heuristic, starting from the current robot position. This improves local routing efficiency.
(4) Optimizing capacity before unloading: When a robot unloads before reaching full capacity, this neighborhood searches for small additional tasks that fit in the remaining space before the unload point:
 \begin{equation} \text{insert}(t_k) \quad \text{if} \quad D_{t_k} \leq C_r^{\text{left}}, \quad d_{t_i, t_k} + d_{t_k, t_{i+1}} \lt d_{t_i, t_{i+1}} \end{equation}
(5) Reallocating the best nearby task before unloading: Instead of reordering internal tasks, this operator searches among tasks from other robots for a small task that fits before an unload and is geographically close. The task is inserted if it fits the capacity and improves performance.
(6) Reallocating a task with high transition cost: This operator identifies a task that is part of a costly transition (i.e., a ”jump”) between tasks and attempts to reallocate it to another robot where it fits better. The reallocation is accepted if it reduces the total cost.
3.5.2. Inter-robot task operations
These operators involve transferring or exchanging tasks between robots to improve global performance.
(7) Swapping tasks between two robots: Two tasks are selected from different robots and swapped if the overall system cost is reduced:
 \begin{equation} \text{swap}(t_{r_1}, t_{r_2}) \quad \text{if} \quad \Delta f_1 + \Delta f_2 + \Delta f_3 \lt 0 \end{equation}
(8) Moving a task between robots: A task is moved from one robot to another if the move leads to a better balance or lower total cost, considering robot capacity and insertion feasibility.
(9) Moving a task to balance the load: The most overloaded robot donates a task to the least loaded robot if it helps balance task distribution:
 \begin{equation} \text{load}(r_1) - \text{load}(r_2) \gt \delta , \quad \delta = \frac {1}{|R|} \sum _{r \in R} \text{load}(r) \end{equation}
As already explained, the MOVNS-AINS approach randomly selects one of the above neighborhoods, rather than following a deterministic sequence. If an improvement is found, the process continues randomly within available neighborhoods, ensuring a better balance between exploration (diversification) and exploitation (intensification). The overall optimization process is illustrated in the task allocation flowchart shown in Figure 2, where each stage contributes to refining solution quality across different warehouse scenarios.
Detailed flowchart representing the complete task allocation process, from initial task generation to final refined allocation.

From a computational perspective, the runtime of the proposed MOVNS-AINS framework is dominated by the neighborhood exploration process within the VND procedure and the evaluation of candidate solutions. Each iteration involves the application of a selected neighborhood operator followed by a full evaluation of the resulting allocation. The evaluation cost scales approximately linearly with the number of tasks, as it requires computing route costs for each robot. To mitigate the overhead associated with path planning, shortest paths between relevant nodes are precomputed and stored, allowing constant-time retrieval during optimization.
4. Results
4.1. Overview of experimental settings and algorithms
For evaluating the performance of the proposed methods in MRTA, we conducted a comprehensive set of experiments considering a diverse range of instance configurations. Specifically, the tests were performed on six scenarios with increasing complexity, ranging from small-scale problems involving three robots and 51 tasks (3R-51T) to the largest evaluated setting with 15 robots and 216 tasks (15R-216T).
Three approaches were evaluated: NSGA-II, MOVNS, and a baseline greedy heuristic designed to generate fast feasible solutions. While NSGA-II and MOVNS aim to explore the Pareto front by balancing multiple conflicting objectives, the greedy method serves as a reference point for the quality and efficiency of the metaheuristic-based solutions. Each solution was evaluated according to three operational performance metrics: total execution time (makespan), total travel distance, and load balance among robots (measured as the standard deviation of the cumulative workload assigned to each robot). In addition to these, four Pareto-based quality indicators were used to assess the multi-objective performance of each algorithm: Hypervolume (HV), Inverted Generational Distance (IGD), IGD+, and Spacing. These indicators offer a quantitative view of the convergence, diversity, and distribution of solutions on the approximated Pareto fronts. Lower values of IGD and IGD + indicate better performance, as they reflect how close the obtained solutions are to the reference Pareto-optimal front. Intuitively, IGD measures how well the generated solutions “cover” the ideal trade-offs: if parts of the Pareto front are not well approximated, the IGD value increases.
However, IGD may penalize solutions that are close to the reference front but do not strictly dominate it. IGD + addresses this limitation by considering only distances in directions that correspond to true improvements in the objective space. As a result, IGD + provides a more reliable assessment of solution quality, avoiding misleading evaluations when solutions are near but not properly aligned with the Pareto front.
In the context of MRTA, these metrics indicate how the algorithms approximate optimal trade-offs between execution time, travel distance, and load balancing. Lower IGD and IGD + values, therefore, suggest that the algorithm is capable of producing solutions that better balance these competing objectives.
For the computation of HV, a dominated-safe reference point
 $\mathbf{r}^{\text{ref}} = [30000, 30000, 8000]$
was adopted for all experiments. This value is component-wise worse than every objective vector observed in any configuration, ensuring that all non-dominated solutions dominate the reference point and enabling consistent HV comparisons across methods and instance sizes. To facilitate cross-scenario interpretability, the HV values reported in Table VIII are normalized by the global maximum HV observed across all runs and all configurations.
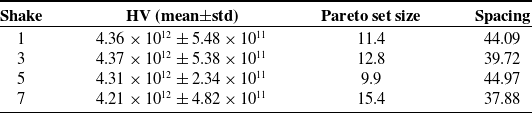
All algorithms were independently executed 10 times for each configuration, and each run was limited to a maximum runtime of 100 s. The experiments were performed on a machine equipped with an Intel Core i7 processor (2.60 GHz, 8 cores), 32 GB of RAM, and running Ubuntu 22.04 LTS. These settings ensure a consistent computational environment for fair comparison across all methods. Table II presents clearly the parameters used specifically for the NSGA-II algorithm, ensuring methodological transparency and reproducibility of the results. To ensure a fair comparison and avoid unnecessary model complexity, both NSGA-II and MOVNS-AINS were designed to operate with minimal parameterization. For MOVNS-AINS, the only configurable elements are the execution time limit and the predefined set of neighborhood operators (see Table III). The shake amplitude is primarily structural, as it must enforce a nontrivial perturbation before local search to avoid immediate reversal by the first intra-route improvement moves. Nevertheless, since shake can influence exploration strength, we performed a small sensitivity sanity-check on a representative instance (5 robots, 150 tasks) under the same time budget used throughout the experiments. We evaluated shake
 $\in$
1, 3, 5, 7 over 10 independent runs and computed mean
 $\pm$
std of final HV, Pareto set size, and spacing. Results indicate stable performance for small shakes (1 and 3 yield comparable HV), whereas larger shakes do not improve performance and may reduce convergence quality. These results are reported in Appendix A (Table XI). Therefore, we adopt shake = 3 as a minimal structural value verified empirically, balancing diversification and stability. As detailed in Table II, NSGA-II also operates with a minimal set of parameters. Before experiments, we ran small preliminary tests across 10, 20, 30, 40, 50, 70, 90, and 100. A population of 50 individuals consistently produced the best compromise between runtime and Pareto-front quality, which is why this value was adopted.
NSGA-II parameters used in the experiments.

Table II. Long description
An equation describing the NSGA-II algorithm parameters. The equation starts with the initial population P zero, the number of generations G, and the population size N. The algorithm evaluates all individuals in the initial population P zero. It then iterates for each generation from 1 to G. Within each generation, it initializes an empty set C g. While the size of C g is less than N, it selects parents p 1 and p 2 from the previous generation P g minus 1 using a selection method like tournament. It then applies segment crossover to produce children c 1 and c 2, followed by mutation. The children are added to C g. After the loop, it combines the previous generation and the current set C g into P combined. It evaluates all individuals in P combined and performs a fast non-dominated sort to get the set F. From F, it selects N individuals using crowding distance to form the new generation P g. After all generations, it extracts the non-dominated solutions from P g to get the final set P star.
MOVNS-AINS parameters used in the experiments.

Table III. Long description
An equation representing an algorithmic process. The equation starts with P prime being assigned to an empty set. It then iterates over each solution s in the initial solution pool P. For each solution, it perturbs the solution to get s prime. It sets improved to true and enters a while loop that continues as long as improved is true. Inside the loop, it selects a random neighborhood N from the set of neighborhoods N and perturbs s prime to get s double prime. If s double prime dominates s prime, it updates s prime to s double prime. Otherwise, it sets improved to false. After the loop, it adds s prime to P prime. This process repeats for all solutions in P, and finally, it returns the improved solution pool P prime.
From a runtime perspective, all methods are evaluated under a fixed execution budget of 100 s, ensuring a consistent and comparable experimental setting across configurations. As the problem size increases, the computational effort required per iteration increases due to the higher cost of neighborhood evaluations and solution assessment as the number of tasks grows. Consequently, the number of iterations that can be performed within the time limit decreases for larger instances, which is consistent with the empirical scalability behavior observed in Table IV. This behavior is consistent with the expected increase in computational cost as a function of the number of tasks and robots and aligns with the algorithmic structure described in the previous section. Although the evaluated range does not fully establish large-scale scalability in absolute terms, it provides empirical evidence of stable computational behavior as instance size increases.
Auxiliary scalability analysis of MOVNS-AINS under a fixed time budget (100 s) with 10 robots. Reported values are mean
 $\pm$
std over independent runs.

Table IV. Long description
A table with three columns and eight rows. The columns are labeled Parameter, Value, and Rationale. The rows detail the parameters for a scalability analysis. Row 1: Parameter, Population size; Value, 50; Rationale, Balances solution diversity and computational cost. Row 2: Parameter, Maximum execution time; Value, 100 s; Rationale, Ensures fair comparison with MOVNS method. Row 3: Parameter, Crossover probability; Value, 100 percent; Rationale, Maximizes solution exploration and diversity. Row 4: Parameter, Mutation rate; Value, 3 tasks altered; Rationale, Small empirical perturbation balancing exploration/exploitation. Row 5: Parameter, Parent selection method; Value, Random; Rationale, Enhances initial diversity and avoids premature convergence. Row 6: Parameter, Survival (elitism); Value, Crowding-distance; Rationale, Maintains diversity and quality within the Pareto front. Row 7: Parameter, Reference point (Hypervolume); Value, [30,"000","30","000","8",000]; Rationale, Defined clearly for reproducible hypervolume analysis.", "EDH": "
Scalability under a fixed runtime budget.
To provide additional empirical evidence regarding scalability beyond the largest configuration evaluated in the main experiments (15 robots, 216 tasks), we conducted an auxiliary throughput analysis under the same fixed time budget of 100 s. Rather than extending the benchmark suite, this analysis aims to quantify how the computational throughput of MOVNS-AINS evolves as problem size increases under a constant runtime constraint. We fixed the number of robots to 10 and evaluated instances with increasing numbers of tasks (95, 150, and 216). For each configuration, we report the mean
 $\pm$
standard deviation of the number of iterations per second (iters/s) and Pareto front updates per second (updates/s) over independent runs. The results are summarized in Table IV.
Overall, computational throughput decreases moderately as the number of tasks increases, which is expected due to the higher cost of evaluating neighborhood moves and maintaining the Pareto archive. Importantly, the rate of Pareto front updates remains stable across tested scales, indicating that the search continues to discover improving non-dominated solutions even as instance size grows. This behavior suggests a graceful degradation under increasing problem complexity rather than a collapse in search efficiency. These results are consistent with the algorithmic design of MOVNS-AINS, which relies on corridor-level task abstraction and localized neighborhood exploration to constrain per-iteration computational cost.
4.2. Operational performance analysis: Time, distance, and load balance
The comparative analysis of the proposed algorithms reveals consistent differences in operational behavior and Pareto quality across the tested configurations. Through six configurations ranging from small (3R–51T) to the largest evaluated scenarios (15R–216T), we observed how each method handles increasing complexity in multi-objective task allocation. In what follows, we present a threefold analysis encompassing (i) operational efficiency through execution time, travel distance, and load balancing, (ii) the structure and quality of the Pareto fronts, and (iii) a critical discussion of trade-offs and practical implications. Figures 3, 4, and 5 show the distribution of time, distance, and load balance, respectively, across different configurations. Each plot compares NSGA-II, MOVNS, and Greedy.
Boxplot of total execution time across configurations.

Figure 3. Long description
A box-and-whisker plot comparing total execution time across different configurations for various algorithms. The plot includes multiple grouped box plots arranged horizontally. The horizontal axis represents different configurations labeled as 3R-51T, 3R-95T, 5R-95T, 10R-95T, 10R-216T, and 15R-216T. The vertical axis represents total execution time in seconds, ranging from 500 to 3000 seconds. The plot includes data for three algorithms: NSGA-II (blue boxes), MOVNS (orange boxes), and Greedy (red diamonds). Each box plot shows the minimum, maximum, median, lower quartile, and upper quartile values. Outliers are indicated by small circles. The NSGA-II algorithm generally shows higher execution times compared to MOVNS and Greedy across most configurations. The Greedy algorithm consistently has the lowest execution times. The MOVNS algorithm shows intermediate execution times, often overlapping with the NSGA-II algorithm but generally lower. The plot highlights the variability in execution times across different configurations and algorithms.
Boxplot of total travel distance across configurations.

The statistical results are presented in Tables V, VI, and VII, separately for execution time, distance traveled, and load balance. Each table includes the mean, median, standard deviation, minimum, and maximum, enabling a detailed comparison across algorithms and configurations.
Statistical summary – execution time (s).

Table V. Long description
A table with three columns: Parameter, Value, and Rationale. The table has eight rows, each detailing a specific parameter, its value, and the rationale behind it. Row 1: Parameter: Maximum execution time, Value: 100 s, Rationale: Ensures fair comparison with NSGA-II. Row 2: Parameter: Neighborhood selection strategy, Value: Random adaptive selection, Rationale: Balances diversification and intensification during search. Row 3: Parameter: Neighborhood structures, Value: 9 distinct structures, Rationale: Provides a comprehensive search across intra-robot and inter-robot moves. Row 4: Parameter: Initial perturbation (shake), Value: 3 tasks altered, Rationale: Empirically chosen small perturbation to escape local optima. Row 5: Parameter: Acceptance criterion, Value: Pareto dominance, Rationale: Maintains only non-dominated high-quality solutions. Row 6: Parameter: Reference point (Hypervolume), Value: [30,"000","30","000","8",000], Rationale: Defined clearly for reproducible hypervolume analysis.", "EDH": "
Boxplot of load balance (Standard deviation of cumulative robot workloads) across configurations.

Statistical summary – distance traveled (m).

Table VI. Long description
A table with three rows and three columns. The columns are labeled Tasks, iters/s, and updates/s. The rows are as follows: Row 1: Tasks, 95; iters/s, 22.70 ± 2.38; updates/s, 0.83 ± 0.27. Row 2: Tasks, 150; iters/s, 11.35 ± 0.48; updates/s, 1.28 ± 0.34. Row 3: Tasks, 216; iters/s, 8.41 ± 0.76; updates/s, 1.23 ± 0.33.
Statistical summary – load balance.

Table VII. Long description
A table comparing performance metrics of different algorithms across various configurations. The table has 18 rows and 7 columns. The columns are labeled Algorithm, Config, Mean, Median, Std, Min, and Max. The row labels are NSGA-II, MOVNS, and Greedy with different configurations. Each row provides specific values for Mean, Median, Std, Min, and Max for the given algorithm and configuration. Notable trends include varying performance metrics across different algorithms and configurations, with some configurations showing higher mean and median values while others exhibit lower standard deviations.
The operational results reveal a clear distinction between the performance of the evaluated algorithms, i.e., NSGA-II, MOVNS, and Greedy, across the tested configurations. Overall, MOVNS provided the most consistent compromise among execution time, travel distance, and workload balance across the evaluated configurations.
In terms of execution time, MOVNS shows improvements compared to NSGA-II and Greedy. This is particularly evident in mid- and large-scale configurations. For example, in the 10R-95T instance, MOVNS achieved an average execution time of 558 s, representing a 17% reduction compared to NSGA-II (668s), and more than 26% faster than Greedy (761s). This trend held across larger configurations as well; in 15R-216T, MOVNS maintained the lowest execution time (approximately 1548 s), whereas NSGA-II and Greedy required 1771 s and 1672 s, respectively. Moreover, MOVNS presented significantly lower standard deviations in most scenarios, indicating not only faster but also more consistent performance across repeated runs.
The analysis of travel distance indicates that MOVNS achieves competitive performance across most configurations. While improvements are observed in some instances, Table VI shows that the Greedy heuristic produces shorter routes in specific cases. These counter-examples occur because Greedy deterministically assigns each task to the closest robot, which may incidentally generate a spatially efficient route in compact or highly clustered scenarios. For instance, in the 5R-95T configuration, MOVNS reduced the average travel distance by over 32% compared to NSGA-II. Similar gains were observed in some larger configurations: in 10R-216T, MOVNS achieved a mean travel distance of 12,357 units, while NSGA-II required over 15,443 units. These results highlight that, although Greedy may achieve a lower travel distance in certain scenarios due to its single-objective nature, MOVNS provides a more balanced performance when multiple objectives are considered jointly. In particular, the proposed approach seeks to optimize travel distance alongside execution time and workload balance, leading to solutions that better reflect the overall system performance in MRTA.
Regarding load balancing, measured as the standard deviation of robot workloads, the results do not indicate a uniform dominance of a single method across all configurations. In smaller instances, MOVNS achieved slightly lower mean imbalance values than NSGA-II in cases such as 3R-51T (7.66 vs. 10.45) and 3R-95T (18.76 vs. 19.27). In intermediate and larger instances, the relative performance of MOVNS and NSGA-II varied depending on the configuration. For example, in 15R-216T, NSGA-II achieved a slightly lower mean imbalance value (160.45 vs. 163.12), whereas MOVNS exhibited lower variability across runs (35.29 vs. 74.05). In all configurations, Greedy produced the highest imbalance values. These results indicate that MOVNS remains competitive in terms of workload balance while showing more stable behavior in several scenarios.
It is important to note that the workload metric used in the experiments is consistent with the formulation of
 $f_3$
, since each robot workload aggregates both travel-related cost and task execution effort along the assigned route.
Greedy, while deterministic and computationally inexpensive, showed limitations in execution time and workload balance, although it achieved shorter travel distances in some configurations. In contrast, NSGA-II produced more diverse Pareto fronts and remained competitive in workload balance across several scenarios, but generally required longer execution times and exhibited higher variability across runs. MOVNS, on the other hand, delivered a favorable compromise between solution quality and runtime efficiency, excelling in both average performance and stability, particularly as problem complexity increased.
These observations reinforce the relevance of metaheuristic approaches for operational optimization in MRS. While Greedy strategies can be useful in simple or highly constrained settings, they do not capture the trade-offs required in multi-objective task allocation. MOVNS, through its adaptive local search, shows strong potential for jointly handling execution time, travel distance, and workload balance, making it a promising approach for warehouse-oriented MRTA scenarios and future real-world validation.
4.3. Pareto front quality analysis (Multi-objective metrics)
This section evaluates the quality of the Pareto fronts generated by NSGA-II and MOVNS through established multi-objective performance indicators. Four key metrics are employed: HV, IGD, IGD
 $^{+}$
, and Spacing. The analysis is divided into three parts: (A) quantitative metric comparison, (B) 3D visualization of the Pareto fronts, and (C) qualitative discussion.
The HV measures the volume of the objective space dominated by the Pareto front with respect to a predefined reference point. A higher HV indicates better convergence and diversity. The IGD calculates the average distance from points on the true Pareto front to the nearest point on the obtained front, reflecting both convergence and coverage. IGD + is a variation of IGD that incorporates dominance in the distance computation, making it more robust for comparing solutions in non-convex or irregular fronts. Finally, Spacing assesses the distribution uniformity of solutions along the Pareto front; lower values indicate more evenly spaced solutions and thus better diversity. Table VIII presents the average and standard deviation values for each metric across all tested configurations. Each row corresponds to a configuration, comparing NSGA-II and MOVNS. As shown in Table VIII, MOVNS and NSGA-II exhibit divergent behaviors in IGD and IGD
 $^{+}$
. While MOVNS achieves substantially lower IGD
 $^{+}$
values, which indicate a stronger convergence toward the dominant region of the Pareto surface, it simultaneously presents higher IGD values. This occurs because IGD penalizes the distance to all points of the reference set, including extreme and less dominant regions, favoring algorithms such as NSGA-II that provide broader coverage. In contrast, IGD
 $^{+}$
penalizes only from dominated directions; hence MOVNS, which concentrates solutions in well-dominated areas of the objective space, obtains better IGD
 $^{+}$
despite a narrower global spread. This explains the reason that the two proximity metrics diverge in our results and highlights their complementary nature.
Multi-objective Pareto front metrics per configuration (Mean
 $\pm$
Std). HV values are normalized by the global maximum (
 $4.34433\times {10}^{9}$
).

Table VIII. Long description
The table presents the performance metrics of different algorithms across various configurations. It includes columns for the algorithm name, configuration, mean, median, standard deviation (Std), minimum (Min), and maximum (Max) values. The table has 18 rows and 7 columns. Each row represents a specific configuration of an algorithm, and the columns provide the corresponding performance metrics. The algorithms compared are NSGA-II, MOVNS, and Greedy. The configurations vary in terms of the number of objectives and the size of the instances. The table provides a detailed comparison of the mean, median, standard deviation, minimum, and maximum values for each configuration.
Figures 6–8 illustrate the 3D Pareto fronts for selected configurations, plotted in the objective space (execution time, travel distance, and load balance). The Greedy solution is represented as a red diamond for baseline reference.
Pareto front: 3R-95T configuration.

Pareto front: 10R-95T configuration.

Figure 7. Long description
A 3D scatter plot representing the relationship between distance, balance load, and time for different optimization techniques. The horizontal axis represents distance, the vertical axis represents balance load, and the depth axis represents time. The plot includes hundreds of data points. The data points are color-coded: blue for NSGA-II, orange for MOVNS, and red for Greedy. The blue data points show a trend of decreasing balance load with increasing distance and time. The orange data points show a similar trend but with higher balance load values. The red data point, labeled Greedy, is an outlier with a higher balance load and lower distance compared to the other data points.
Pareto front: 15R-216T configuration.

3D Pareto fronts for all configurations. Each dot represents a non-dominated solution in the space of (Distance, balance, time). NSGA-II (blue), MOVNS (orange), and greedy (red diamonds).

Figure 9. Long description
A 3D scatter plot representing the Pareto fronts for various configurations. The plot shows the relationship between distance, balance load, and time. Each dot represents a non-dominated solution in the space of these three variables. The horizontal axis represents distance, the vertical axis represents balance load, and the depth axis represents time. The data points are color-coded: blue for NSGA-II, orange for MOVNS, and red diamonds for greedy configurations. The plot includes several clusters of data points, with some configurations showing tighter clusters and others more spread out. The overall trend indicates varying trade-offs between distance, balance load, and time across different configurations.
In addition to individual plots, Figure 9 provides a comprehensive 3D visualization that consolidates all configurations. It highlights the distribution patterns of NSGA-II (blue), MOVNS (orange), and Greedy (red diamonds). From this aggregated view, one can observe that MOVNS consistently concentrates solutions in the dominant region of the objective space. The NSGA-II solutions tend to be more dispersed and less uniformly spread, particularly in higher-dimensional cases. Greedy solutions, on the other hand, appear as isolated red points, consistently dominated and far from the main fronts, reaffirming their suboptimality in multi-objective trade-offs.
To evaluate the quality of the Pareto fronts generated by each algorithm, we rely on four widely adopted multi-objective performance indicators: Hypervolume (HV), IGD, IGD+ (a Pareto-compliant variant of IGD), and Spacing. These metrics collectively capture different aspects of solution quality, such as convergence to the optimal front (IGD, IGD+), spread and diversity (Spacing), and overall dominance in the objective space (HV). Across nearly all configurations, MOVNS achieved higher HV values than NSGA-II, suggesting broader coverage and better convergence to the true Pareto frontier. For instance, in the large-scale instance 15R-216T, MOVNS achieved a HV of over 3.8 billion, compared to 1.8 billion for NSGA-II, indicating nearly twice the coverage of the objective space. These results are consistent across other complex instances such as 10R-216T and 10R-95T, further reinforcing MOVNS’s capacity to explore well-dominated and extreme regions of the search space.
Concerning proximity-based metrics, MOVNS consistently achieved substantially lower IGD
 $^{+}$
values across configurations, indicating stronger convergence in Pareto-dominant directions. However, IGD values are higher for MOVNS, suggesting a narrower global coverage of the reference set when compared to NSGA-II. This divergence is expected because IGD penalizes distances to all regions of the reference set, including extreme trade-offs, whereas IGD
 $^{+}$
penalizes only dominated directions, favoring methods that concentrate solutions in well-dominated areas.
However, when analyzing Spacing, NSGA-II demonstrated a key advantage in several configurations. In smaller or intermediate instances, such as 3R-51T and 5R-95T, NSGA-II produced more uniformly distributed solutions across the front, achieving lower spacing values than MOVNS. For example, in 3R-51T, NSGA-II achieved a spacing of 21.82, while MOVNS showed a higher variance (44.95). This suggests that NSGA-II may be better suited for applications where solution diversity and uniformity are critical. As the problem scale increases, however, the spacing values of MOVNS tend to approach those of NSGA-II, showing improved distribution in addition to its gains in convergence.
The 3D Pareto plots support these findings. MOVNS fronts tend to occupy larger volumes in the objective space, particularly in configurations such as 10R-216T and 15R-216T, where the solutions dominate a significant region in terms of time, distance, and load balance. NSGA-II, while competitive, often produced more dispersed or irregularly spaced fronts, which may reflect less efficient convergence mechanisms or a tendency to preserve diversity at the cost of optimality.
The Greedy baseline, as expected, was consistently dominated in all multi-objective scenarios. While it occasionally produced solutions that were not drastically worse in individual metrics, it failed to approach the Pareto frontier in any instance. This behavior highlights the limitations of deterministic heuristics in multi-objective settings, reinforcing the relevance of metaheuristic strategies when optimizing conflicting objectives.
The Greedy heuristic, although computationally efficient, consistently yielded inferior performance in all operational metrics. Its rigid, myopic allocation strategy failed to consider global trade-offs, leading to significant imbalances in task distribution and inflated travel distances. This is consistent with previous findings in static warehouse allocation problems [Reference Pinkam, Bonnet and Chong23], where greedy methods are adequate only for trivial or highly constrained scenarios. The dominance plots confirm that greedy solutions are consistently Pareto-dominated, reinforcing their limited applicability to complex, multi-objective MRTA settings.
NSGA-II demonstrated strong diversity in smaller scenarios, especially in configurations such as 3R-51T and 5R-95T. Its evolutionary design, particularly the crowding-distance selection, favors well-distributed solutions across the Pareto front. However, its performance declined in larger instances. This degradation can be attributed to two main factors: (i) the computational burden of non-dominated sorting in high-dimensional objective spaces, which grows quadratically with the population size [Reference Deb, Pratap, Agarwal and Meyarivan37]; and (ii) its lack of problem-specific exploitation mechanisms, which limits convergence speed when the search space becomes highly combinatorial, as in warehouse environments with corridor-level tasks and capacity constraints.
MOVNS, by contrast, emerged as the most robust and scalable approach. Its iterative refinement mechanism, grounded in problem-aware neighborhood structures, enabled more efficient navigation of the solution space. Unlike NSGA-II, which relies on population-wide exploration, MOVNS performs localized, targeted improvements guided by Pareto dominance. This explains its superior performance in execution time and total travel distance, especially in large-scale configurations such as 10R-216T and 15R-216T. The adaptive neighborhood selection also allowed MOVNS to escape local optima more effectively, corroborating results observed in similar adaptive local search frameworks [Reference Braga and Lima12].
Nonetheless, MOVNS showed higher spacing values in some configurations, particularly in smaller or intermediate instances. This indicates a lower uniformity in the distribution of Pareto-optimal solutions, an expected limitation of neighborhood-based methods that prioritize convergence over diversity. Unlike NSGA-II, MOVNS does not maintain an explicit diversity preservation mechanism, which may limit its ability to approximate evenly distributed trade-offs in some objective spaces. Hybrid approaches such as NSGA-II + MOPSO [Reference Shen and Meng33] or NSGA-III [Reference González, Villar, Chira, de la Cal, Sánchez and Sedano32] attempt to address this by combining global diversity with local convergence, but often at the cost of increased runtime and computational complexity.
The results also highlight the importance of scaling strategies. MOVNS maintained stable performance as the number of tasks and robots increased, while NSGA-II exhibited greater variance and sensitivity to instance size. This suggests that structured local search methods, when combined with domain knowledge (e.g., unloading behavior, dynamic entry/exit point definition, and capacity-aware neighborhoods), offer a more practical solution for real-time deployment in smart warehouses and inspection tasks. It also reinforces recent insights from the literature that emphasize the potential of hybrid metaheuristics with adaptive search control in dynamic logistics scenarios [Reference Dou, Chen and Yang25, Reference Mokhtari, Haji Ali Mohamadi, Aernouts, Singh, Vanderborght, Weyn and Famaey28].
As can be seen in this article, the comparative evaluation is designed to provide two complementary reference points: a well-established multi-objective evolutionary algorithm (NSGA-II) and a lightweight heuristic baseline (Greedy). This choice allows for a controlled and interpretable assessment of the proposed MOVNS-AINS framework under a consistent experimental setting, particularly with respect to solution quality, runtime behavior, and multi-objective trade-offs. In summary, while Greedy serves as a useful baseline and NSGA-II provides substantial diversity in smaller cases, MOVNS offers a favorable compromise between quality, scalability, and runtime efficiency. Its ability to incorporate domain-specific operators and adapt dynamically to the problem structure makes it particularly suited for large-scale MRTA problems in structured environments. Future improvements may focus on hybridizing MOVNS with explicit diversity management mechanisms or integrating predictive components to anticipate task interdependencies and dynamically adapt the search trajectory.
4.4. Dynamic replanning in MRTA: Execution failures and online task insertion
The proposed framework incorporates dynamic replanning mechanisms to address two critical disruptions in real-world MRTA scenarios: (i) robot failures during execution; and (ii) arrival of new tasks during mission runtime. Inspired by recent literature [Reference Choudhury, Gupta, Kochenderfer, Sadigh and Bohg42–Reference Otte, Kuhlman and Sofge45], our approach is designed to preserve mission robustness by combining fast-response heuristics with global reoptimization strategies. To better illustrate this process, Figure 10 presents a flowchart of the full replanning pipeline. Upon detection of a dynamic event during execution, the system captures the current mission state and triggers either a local greedy heuristic or a global MOVNS-AINS reoptimization, depending on the selected strategy. The framework handles robot failures and new task arrivals through a unified structure that allows for a comparative evaluation of response effectiveness.
Flowchart of the dynamic replanning process triggered by robot failures or new task arrivals. The system distinguishes the event type, captures the current state, and applies two alternative strategies, greedy reallocation or global reoptimization via MOVNS-AINS, before executing the updated plan.

Comparative performance under robot failure for small, medium, and large scenarios.

Table IX. Long description
The table compares the performance of different algorithms under robot failure for small, medium, and large scenarios. It has four rows and three columns. The column headers are Scenario, Metric, Remaining, Greedy, MOVNS-AINS, and original plan replanning replanning. The row labels are Small, Medium, and Large. Each row contains values for Time (s), Distance, and Load balance (). Row 1: Small, Time (s), 688, 863 (+25.4%), 789 (+14.7%), Distance, 1,027, 905, 833.5, Load balance (), 68.23, 55.10, 2.10. Row 2: Medium, Time (s), 845, 1,025 (+21.3%), 878 (+3.9%), Distance, 2,237, 2,383.5, 1834.5, Load balance (), 44.98, 41.46, 24.28. Row 3: Large, Time (s), 1594, 2,058 (+29.1%), 1849 (+16.0%), Distance, 4,343, 4,569, 4,385.5, Load balance (), 158.18, 243.47, 70.31.
4.4.1. Replanning pipeline
At an interruption point
 $t = T/3$
, the system captures the current execution state: robot positions, unfinished tasks, and newly introduced tasks (if any). Two strategies are evaluated: Greedy Reallocation and MOVNS-AINS Reoptimization. In the first one, the Greedy Reallocation, a local strategy that preserves ongoing plans and integrates disruptions incrementally. The second strategy, MOVNS-AINS Reoptimization, a global strategy that redefines the entire task allocation using multi-objective metaheuristics. In case a robot becomes inoperative:
-
1. The failed robot is excluded, and all unfinished tasks it held are identified.
-
2. These tasks are reassigned greedily to the remaining active robots based on the shortest graph-based distance (via cached A* paths) and current robot workload.
-
3. The original task sequences of the active robots are preserved, and the reassigned tasks are appended at the end.
-
4. This patched plan is optionally reoptimized using MOVNS-AINS, which reevaluates all allocations and path segments holistically.
In scenarios where a new wave of tasks arrives:
-
1. Robots execute their current routes until
$t = T/3$
. -
2. A new set of tasks is instantiated and first analyzed for corridor redundancy.
-
3. Tasks with identical corridor_cells are aggregated into a single task to reduce spatial and computational complexity [Reference Aşık and Akın46, Reference Ma and Koenig47].
-
4. The new tasks are then greedily assigned to the most suitable robots, extending their current routes.
-
5. MOVNS-AINS is finally applied over the unified set of remaining and new tasks, producing a globally optimized task allocation.

4.4.2. Experimental results
Tables IX and X summarize the performance for each scenario. Greedy reallocation introduces notable delays, up to + 29.1% in large-scale scenarios, due to unbalanced task accumulation and route extension. MOVNS-AINS, in contrast, mitigates the operational delay caused by the failure by up to 81.7% (e.g., reducing the delay from 180s to 33s in the medium scenario). Notably, in the small and medium scenarios, the total distance traveled after MOVNS-AINS replanning was even less than in the original remnant plan. This seemingly paradoxical result highlights that the reoptimization process is powerful enough to prune spatial inefficiencies present in the initial static allocation. Moreover, MOVNS-AINS can outperform even the original plan in balance. This occurs because the static plan, while globally optimal for
 $N$
robots, may contain local inefficiencies. By treating the failure as a trigger for a new, holistic optimization problem for
 $N-1$
robots, MOVNS-AINS is free to discover a superior equilibrium, eliminating outdated constraints and adapting to the system’s new reality.
Performance comparison when handling new task arrivals (medium scenario).

Table X. Long description
A table with 7 rows and 6 columns comparing the performance metrics of NSGA-II and MOVNS algorithms across different configurations. The columns are labeled Configuration, Algorithm, HV_norm, IGD, IGD+, and Spacing. The row labels include configurations such as 3R-51T, 3R-95T, 5R-95T, 10R-95T, 10R-216T, and 15R-216T. Each configuration is evaluated using both NSGA-II and MOVNS algorithms. The table presents mean values and standard deviations for HV_norm, IGD, IGD+, and Spacing metrics. Notable trends include varying performance across different configurations and algorithms, with some configurations showing significantly higher values for certain metrics.
When facing the sudden arrival of 91 new tasks, the greedy strategy led to uncoordinated extensions of robot routes, causing a spike in load imbalance from
 $\sigma = 63.19$
to
 $\sigma = 93.15$
. In contrast, MOVNS-AINS integrated the new tasks into a globally rebalanced allocation, reducing the imbalance to
 $\sigma = 29.92$
. It also shortened total mission time by 268 s (–18.2%) and saved 585 units of distance (–16.1%) over the greedy strategy.
By treating dynamic events not as local problems to be patched, but as triggers for holistic re-optimization, the MOVNS-AINS framework embodies a shift from static planning to true adaptiveness. This approach guarantees not only solution quality and load balance, but also the operational resilience required to handle uncertainty, perturbations, and real-time workload scalability in modern logistics environments.
Taken together with the results obtained across increasingly large static configurations (Subsection 4.1), these findings indicate that the proposed framework maintains stable runtime and solution quality as the number of robots and tasks grows, supporting its expected scalability in larger warehouse deployments.
While broader benchmarking against additional recent MRTA methods would be valuable, the present study prioritizes a controlled and consistent evaluation setting based on NSGA-II and a Greedy baseline as complementary reference points. Many state-of-the-art approaches rely on problem-specific assumptions or learning-based frameworks, which makes direct comparison under a unified experimental setting non-trivial.
5. Experimental setup and validation in a physically realistic simulation environment
This section provides an overview of the implementation pipeline, detailing the simulation architecture, control logic, integration strategies, and performance monitoring tools that enable the reliable execution of MRTA in structured warehouse environments. It details the technologies and tools employed, the structure and logic behind the developed modules, and the strategies used to ensure scalability, physical realism, and seamless integration. Emphasis is placed on generating the virtual environment using Isaac Sim, organizing and modeling data, controlling and coordinating robots through the Robot Operating System (ROS2) and its distribution Humble, and operationalizing MRTA solutions via optimized waypoint navigation and box manipulation. Additionally, this section discusses the visual tools and metrics used to evaluate system performance, ensuring reproducibility and analytical depth across experimental scenarios.
The simulation environment employed in this article is NVIDIA Omniverse Isaac Sim, a state-of-the-art robotics platform designed for physically and visually realistic virtual experimentation. Its native support for ROS2, high-fidelity physics engine, and extensibility through Python scripting make it particularly well-suited for developing and testing MRS in warehouse scenarios.
The virtual warehouse is constructed programmatically using USD (Universal Scene Description) primitives, enabling procedural generation of structural elements such as racks, corridors, and floors. Racks are arranged to form narrow aisles and are composed of multiple vertically stacked shelves. Each shelf contains boxes with unique identifiers, positioned based on their coordinates and the associated rack geometry. The layout is designed to mimic realistic logistics environments, with constraints on robot maneuverability and line of sight. Boxes are defined as rigid bodies with collision boundaries, instantiated via Python scripts that also assign them hierarchical USD paths reflecting their spatial relationship to racks. Each box includes a computed pickup location, positioned adjacent to the rack face (either front or back) depending on the defined navigation direction. This setup ensures realistic physical interactions during manipulation tasks and enables consistent linkage between simulation entities and their corresponding representations in the task allocation logic.
Isaac Sim’s simulation engine ensures the enforcement of physics constraints, including collision dynamics and gravity, allowing for accurate testing of navigation, docking, and manipulation behaviors. Combined with its ROS2 bridge and scripting flexibility, the environment offers a powerful foundation for validating the proposed MRTA methodology under complex, reproducible conditions. Figure 11 illustrates the warehouse configuration generated within Isaac Sim, and Figure 12 the robot used in the simulation.
Simulated warehouse environment in Isaac Sim, showcasing procedurally generated racks and shelves.

Robot used for the simulation.

To enhance simulation realism, robots are equipped with realistic odometry sensors, enabling precise position estimations. Future integrations may incorporate additional sensors, such as LiDAR or cameras, to support realistic obstacle and object detection. Note that collision simulation, acceleration modeling, and physical constraints are fully supported by Isaac Sim’s advanced physics engine, ensuring reliable validation of experimental results and enhancing the practical applicability of the findings.
5.1. Data modeling and structure
To ensure seamless integration between the simulated environment and the task allocation algorithms, a consistent and extensible data modeling strategy was developed using a structured JSON format. This file serves as the digital twin of the simulation, encapsulating metadata for all relevant elements, including racks, shelves, and individual boxes.
Each rack is associated with a set of three-dimensional coordinates and a unique hierarchical identifier based on its USD path. Boxes are represented with precise positional data, their vertical level (shelf), and a direct reference to their simulation prim path. This enables the MRTA algorithm to interact with simulation objects in a clear and programable manner, facilitating dynamic updates and traceability across components.
Tasks are not assigned to individual boxes but are abstracted at the corridor level to balance complexity and realism. A task encompasses all boxes located along a particular aisle, treating the corridor as a spatial unit of work. This approach reduces the computational burden of the allocation process while preserving enough granularity for meaningful navigation and collection behaviors.
Entry and exit points for each task are calculated automatically based on the rack layout and the predefined navigation side (e.g., top or bottom of the aisle), ensuring that robots approach shelves from feasible directions. Additionally, distances between tasks and execution durations are derived based on the number of assigned boxes and their locations, enabling the task planner to make informed, context-aware decisions.
This modeling architecture provides a scalable interface between the physical simulation and the multi-robot planning layer, supporting heterogeneous robot capabilities, dynamic scenario changes, and reproducible experimentation.
5.2. ROS2 integration and communication
ROS2 serves as the primary middleware for enabling communication and control across the MRS. Each robot in the simulation operates under a dedicated, decentralized ROS2 node, written in Python, which manages its individual perception, control, and actuation processes. This architecture supports full scalability, allowing the framework to accommodate an arbitrary number of robots without centralized bottlenecks.
Communication between nodes is structured through well-defined ROS2 topics. Each robot publishes its odometry data to a unique topic, enabling real-time tracking of position and orientation. Correspondingly, control commands, comprising linear and angular velocities, are published to robot-specific topics, allowing continuous, closed-loop navigation. Additional communication channels support higher-level interactions, such as box detection events and task notifications, facilitating coordination with external systems like the box transfer controller.
Navigation is waypoint-based, relying on paths computed by the MRTA planner. Upon receiving a path, the robot node employs a proportional control strategy to guide movement. The control logic performs angle correction to align with the target direction, followed by smooth linear motion regulated based on the robot’s distance to the goal. This behavior ensures precision in narrow corridors and avoids abrupt or unsafe maneuvers near shelves or obstacles.
The modular design of ROS2 nodes allows for seamless extension to incorporate additional sensors or behaviors. Furthermore, integration with the Isaac Sim physics engine ensures that all control outputs are grounded in physically realistic responses, bridging high-level task planning with low-level motion execution in a robust and scalable manner.
A detailed diagram of the communication flow is presented in Figure 13, showing the interaction between ROS2 nodes responsible for robot navigation and the BoxTransferNode script running within Isaac Sim. The diagram illustrates the separation of concerns between control logic and simulation behavior, as well as the modularity of the framework for scaling to multiple agents.
Communication flow between ROS2 nodes and the Isaac Sim behavior script. The architecture supports distributed navigation and visual box manipulation.

Figure 13. Long description
A diagram of the communication flow between ROS2 nodes and the Isaac Sim behavior script. The diagram represents the structure and interaction of nodes involved in distributed navigation and visual box manipulation. The diagram is divided into two main sections: ROS2 Nodes and Isaac Sim. In the ROS2 Nodes section, each robot i subscribes to the /robot_i/odom node and publishes to the /robot_i/cmd_vel and /box_transfer nodes. The RobotNavigator i node is central to this section, handling the subscription and publication processes. In the Isaac Sim section, the BoxTransferNode Behavior Script subscribes to the /box_transfer node. This script reads the pose from the /World/Robot_i node and moves the CardBoxes. The arrows indicate the direction of data flow and interaction between the nodes.
5.3. Box pickup via behavior script
A key component is the BoxTransferNode, implemented as a BehaviorScript in Isaac Sim. This node subscribes to the /box_transfer topic, which receives messages indicating that a robot has reached a box. Upon receiving such a message, the script retrieves the robot’s current position and moves the corresponding box slightly above the robot’s base.
The transformation is applied in simulation coordinates using a consistent offset. Importantly, the script preserves the original scale and rotation of the box, avoiding the visual and physical anomalies often introduced by direct manipulation. Additionally, the system supports multiple robots by maintaining an association between each robot and its collected boxes, which are updated dynamically based on robot odometry.
Robot 1 routes segmented by wave (with offset).

5.4. Waypoint-based navigation and box detection
Navigation within the warehouse environment is governed by a waypoint-based strategy derived from the output of the MRTA algorithm. Each robot receives a precomputed path consisting of discrete waypoints, which define its trajectory through the environment. These paths are generated using the A* algorithm on a topologically consistent navigation graph that encodes the spatial layout of the warehouse, including corridors, shelf alignments, and collision zones.
During execution, each robot continuously compares its real-time odometry with the current waypoint target, employing a proportional control scheme for orientation and translation. Upon reaching a waypoint associated with a box pickup position, the robot triggers a message on the /box_transfer ROS2 topic. This message contains the unique identifier (USD prim path) of the box and the robot ID, initiating a scripted animation in Isaac Sim that visually simulates the loading of the box onto the robot.
Each task is marked as complete when the robot reaches the designated task exit point, allowing the system to transition seamlessly to the next task in its assigned route. The design ensures that all coordination between robots and the environment is handled implicitly through asynchronous ROS2 communication, eliminating the need for centralized synchronization. This autonomy, coupled with accurate proximity detection and structured waypoint planning, enables reliable and scalable operation of multiple agents in dynamic industrial environments.
5.5. Executed route visualization
This subsection presents the graphical visualization of the routes that will be executed by the robots during simulation, as defined by the waypoint-based navigation strategy described in Section 5.4. These trajectories are directly derived from the MRTA algorithm and translated into navigable paths over the topologically consistent warehouse graph. Each robot receives a sequence of tasks organized into waves, which represent sets of boxes to be picked up and delivered during a single mission. For each wave, the planned path includes navigation to the corresponding pickup locations, triggering a loading animation in Isaac Sim via the /box_transfer ROS 2 topic, and returning to the delivery point.
Figures 14, 15, and 16 illustrate the actual paths assigned to each robot, segmented by wave and color-coded for clarity. These paths were extracted directly from the simulation data and are consistent with the planning outcomes, reinforcing the integration between the MRTA algorithm, the ROS 2 communication layer, and the Isaac Sim execution environment. A small visual offset was applied to each robot’s path to ensure that overlapping trajectories remain distinguishable in the plots. This visualization provides an intuitive understanding of the spatial distribution of robot operations, facilitating the validation of the correctness of the generated routes. The wave sequence is presented in chronological order, and the legend indicates the color assigned to each wave. The drop point is highlighted in gold.
Robot 2 routes segmented by wave (with offset).

Robot 3 routes segmented by wave (with offset).

Figure 16. Long description
A diagram of the routes of Robot 3 segmented by wave with offset. The diagram is divided into a grid with coordinates labeled X and Y. Various rectangles represent different tasks or locations, each containing numbers. The diagram includes colored lines indicating different waves: blue for Wave 1, orange for Wave 2, purple for Wave 3, and cyan for Wave 4. Green dots mark drop points. The routes of Robot 3 are shown as lines connecting these tasks or locations, segmented by the different waves. The diagram illustrates the flow and sequence of tasks handled by Robot 3 across different waves.
The trajectories presented in this section directly reflect the optimized task allocations discussed in Section 4, demonstrating how the proposed MRTA strategy, based on multiple waves, organizes robot routes in a structured and efficient manner. The graphical representation of each robot’s path provides a visual understanding of task balancing and spatial coverage within the environment.
Moreover, the plotted paths confirm that the routes were indeed executed in the Isaac Sim simulation, using a waypoint-based control strategy and asynchronous message passing via ROS 2. This pipeline validates the feasibility of the proposed method in a realistic robotic simulation.
Therefore, the visual analysis of executed paths, combined with the previously discussed performance metrics, confirms that the proposed framework produces viable, balanced, and execution-ready trajectories that integrate multi-objective optimization and real-time multi-robot coordination.
Although the proposed framework was validated in Isaac Sim, which provides a high-fidelity digital-twin environment, several real-world aspects remain to be addressed for full physical deployment. These include sensor noise, actuation delays, intermittent communication, and hardware faults that may influence perception and coordination. The proposed framework is designed to be compatible with ROS 2 (Humble) as middleware, facilitating future integration with physical robotic systems. The communication interfaces defined in Isaac Sim, such as /ugv/cmd_vel, /perception/lidar, and /task_allocation/action, follow standard ROS-based abstractions and can be adapted to hardware drivers on mobile ground robots. Velocity commands can be interfaced with motor controllers through the ros2_control framework, while real LiDAR and RGB-D sensors may provide data via velodyne_driver and image_transport nodes. In this context, synthetic perception data used in simulation can be replaced by real sensor streams without requiring modifications to the high-level coordination or task-allocation components. An additional middleware layer, based on rclcpp::Executor and DDS QoS policies, is intended to support message synchronization and latency handling in distributed MRS. These design choices indicate that the proposed MOVNS-AINS framework can be extended toward real-world deployment, although experimental validation on physical robotic platforms remains part of future work.
6. Conclusion and future work
This research presented a robust and adaptable framework for MRTA in smart warehouse environments, leveraging the MOVNS-AINS metaheuristic to address both static and dynamic scheduling challenges. While the results demonstrate the framework’s effectiveness and operational robustness across various simulated scenarios, several limitations have been identified, highlighting potential avenues for further improvement and investigation.
A notable limitation is the lack of extensive evaluation of simultaneous failures of multiple robots. Although individual robot failures were considered, scenarios involving concurrent robot malfunctions were not systematically tested, potentially impacting the robustness and practical applicability of the proposed approach. Another limitation pertains to scalability; while the framework exhibited strong performance in tested configurations with up to 15 robots and 216 tasks, the upper scalability bounds were not thoroughly explored, leaving unanswered questions about performance in larger deployments. Nevertheless, the observed results indicate that the proposed framework exhibits stable computational behavior within the evaluated range, supported by the throughput analysis and by the gradual degradation in iteration rate observed as problem size increases.
Additionally, the framework currently assumes moderate heterogeneity among robot capabilities. Evaluations with highly heterogeneous robot teams, involving significant differences in speed, payload, and operational constraints, have not been extensively conducted, potentially limiting the generalizability of the results. Furthermore, comprehensive tests of critical congestion scenarios, common in narrow-aisle warehouse environments, were not included, which might affect the real-world performance and operational efficiency.
Another aspect that warrants attention is the absence of detailed sensitivity and stability analyses concerning varying initial conditions, such as robot starting positions and initial task sequencing. Such analyses could enhance confidence in the robustness of the proposed solutions. Finally, the lack of direct comparisons against internationally recognized benchmarks limits the external validation and comparative performance assessment of the proposed method.
Acknowledging these limitations opens clear pathways for future exploration. One promising direction is integrating predictive models to anticipate events such as task surges or simultaneous robot failures. By incorporating demand forecasting or learning-based anomaly detection mechanisms, the system could transition from reactive to proactive replanning strategies. Additionally, advancing toward real-time distributed optimization could distribute computational demands across the robot fleet, thereby improving scalability, responsiveness, and fault tolerance.
An important extension would involve accommodating highly heterogeneous robot teams, including aerial vehicles, manipulators, or robots with specialized capabilities. This adaptation would enable task allocation strategies to explicitly account for diverse operational constraints and capabilities, broadening the applicability of the framework across various industrial contexts. Moreover, incorporating Human-in-the-Loop mechanisms during critical decision-making points may enhance safety and reliability and allow expert intervention in scenarios where full autonomy might not be optimal.
From an optimization perspective, future research could explicitly integrate energy awareness by modeling battery constraints, charging schedules, and energy management strategies. Such considerations would be particularly relevant for long-duration missions or scenarios involving energy constraints. Furthermore, hybridizing MOVNS-AINS with learning-based methodologies, such as reinforcement learning or neural-guided neighborhood selection, could improve adaptability and performance in highly dynamic or partially observable environments.
To address real-world deployment aspects, future extensions will include noise-injected sensor models, network latency emulation, and fault-detection layers to evaluate the robustness of the coordination strategy on real robot teams, thereby validating the scalability and reliability of the proposed approach under realistic operating conditions.
Finally, transitioning from simulation-based validation to physical deployment remains an essential objective. Although the proposed framework was validated in a high-fidelity simulation environment (NVIDIA Isaac Sim), real-robot experiments were not conducted in this study. The framework has been designed with real-world deployment in mind, relying on ROS 2 communication and modular system integration, which facilitates future integration with physical robotic platforms. Validating the proposed framework using real robots in prototype warehouses or controlled industrial environments would shed light on timing accuracy, robustness under real-world uncertainties, and hardware-in-the-loop dynamics.
Sensitivity sanity-check for the shake amplitude on a representative instance (5 robots, 150 tasks, 10 independent runs).

Table XI. Long description
The table compares performance metrics for different replanning methods across small, medium, and large scenarios. It has three columns labeled Metric, Remaining original plan, Greedy replanning, and MOVNS-AINS replanning, and three rows labeled Scenario, Small, Medium, and Large. Each scenario includes metrics for Time (s), Distance, and Load balance (σ). Row 1: Scenario, Small. Row 2: Metric, Time (s), 688, 863 (+25.4 percent), 789 (+14.7 percent). Row 3: Metric, Distance, 1027, 905, 833.5. Row 4: Metric, Load balance (σ), 68.23, 55.10, 2.10. Row 5: Scenario, Medium. Row 6: Metric, Time (s), 845, 1025 (+21.3 percent), 878 (+3.9 percent). Row 7: Metric, Distance, 2237, 2383.5, 1834.5. Row 8: Metric, Load balance (σ), 44.98, 41.46, 24.28. Row 9: Scenario, Large. Row 10: Metric, Time (s), 1594, 2058 (+29.1 percent), 1849 (+16.0 percent). Row 11: Metric, Distance, 4343, 4569, 4385.5. Row 12: Metric, Load balance (σ), 158.18, 243.47, 70.31.
Appendix A. Sensitivity sanity-check for the shake amplitude
This appendix reports a small empirical sanity-check conducted to assess the sensitivity of the shake amplitude parameter in MOVNS-AINS. The goal is not to conduct an exhaustive sensitivity analysis but to verify that the algorithm is not critically dependent on this parameter.
A representative medium-sized instance (5 robots and 150 tasks) was selected, using the same execution time budget adopted in the main experimental study. Four values of the shake amplitude were evaluated, namely shake
 $\in \{1, 3, 5, 7\}$
, with 10 independent runs for each configuration.
For each setting, we report the mean and standard deviation of the final hypervolume (HV), the average size of the Pareto set, and the spacing metric.
Acknowledgements
We thank the following Brazilian Federal Agencies, CAPES, CNPq, FAPERJ, and CEFET/RJ for supporting this research work. This article was carried out with the support of the Coordenação de Aperfeiçoamento de Pessoal de Nível Superior - Brasil (CAPES) - Finance Code 001.
Declarations
To ensure objectivity and transparency in research and that accepted principles of ethical and professional conduct have been followed, all authors provide these declarations statements below.
Ethical Approval
The authors have nothing to report.
Consent to participate
All authors are consent to participate.
Consent to publish
All authors are consent to publish.
Authors contributions
Conceptualization and Methodology, Tatiana M.B. Santos and Milena Faria Pinto; Validation and Investigation, Tatiana M.B. Santos; writing – original draft preparation, Tatiana M.B. Santos and Milena Faria Pinto; writing – review and editing, Tatiana M.B. Santos, Milena Faria Pinto, Igor Coelho, and Esteban W.G. Clua. All authors have read and agreed to submit the current manuscript version.
Funding
The authors have nothing to report.
Competing interests
The authors have no competing interests.
Availability of data and materials
All codes are available at https://github.com/tatianambsantos/movns_warehouse.
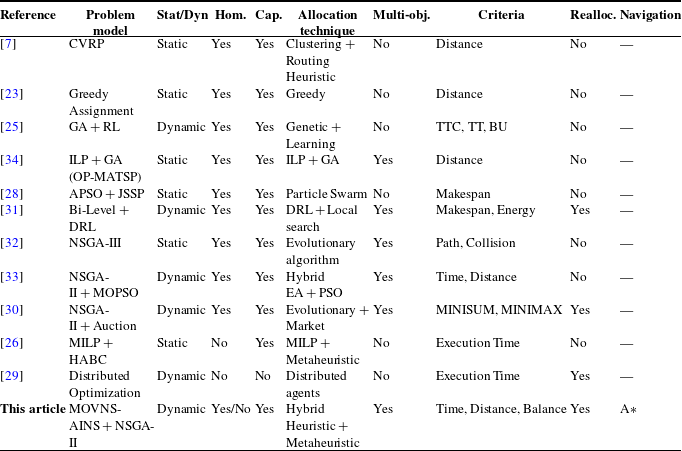

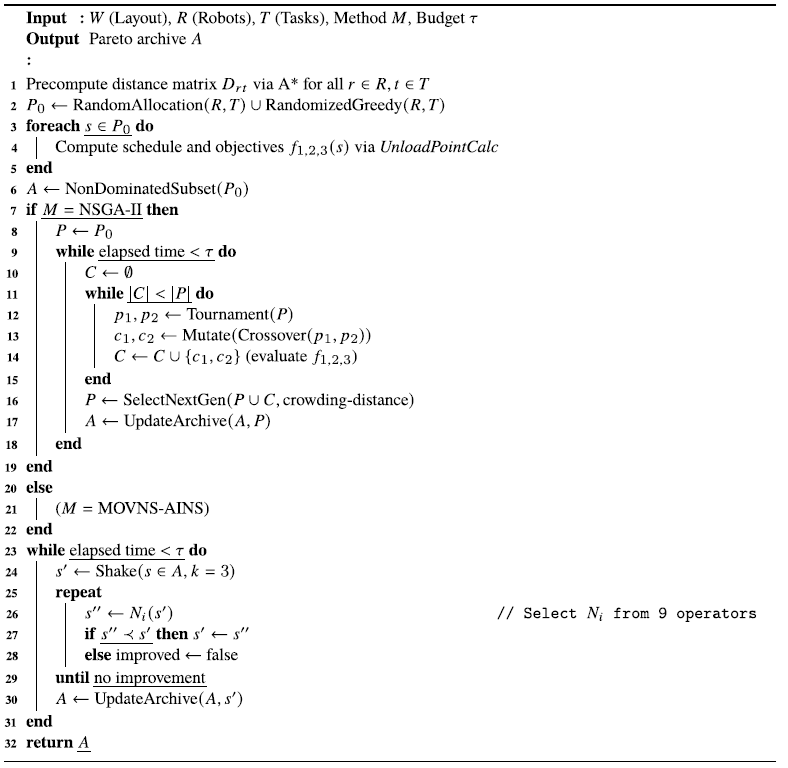
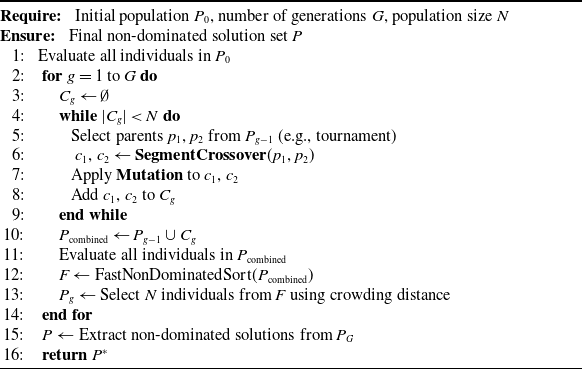
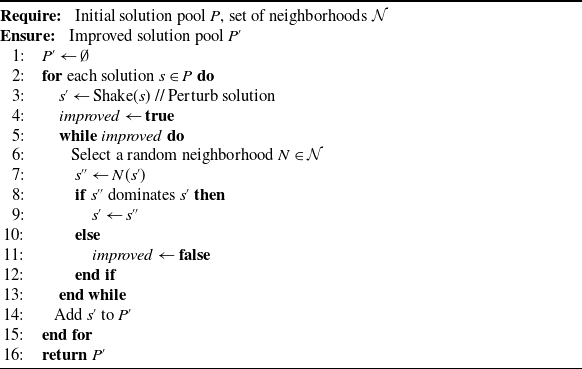

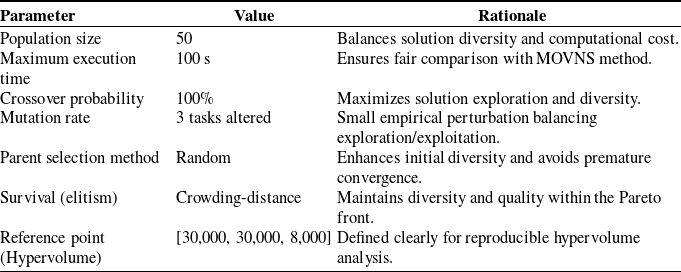
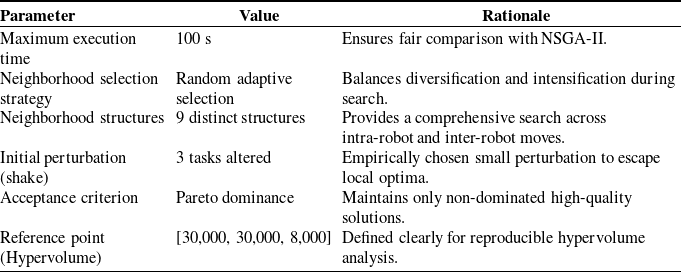
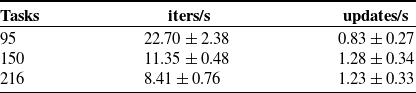
 ±


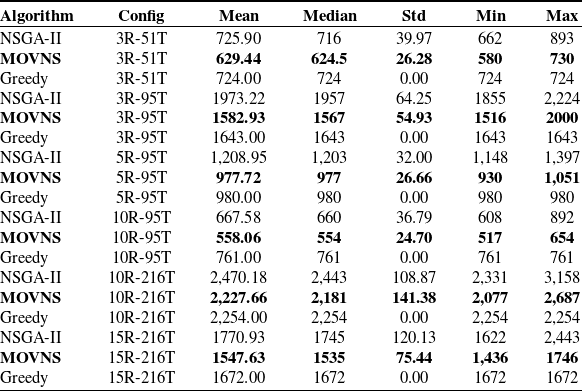

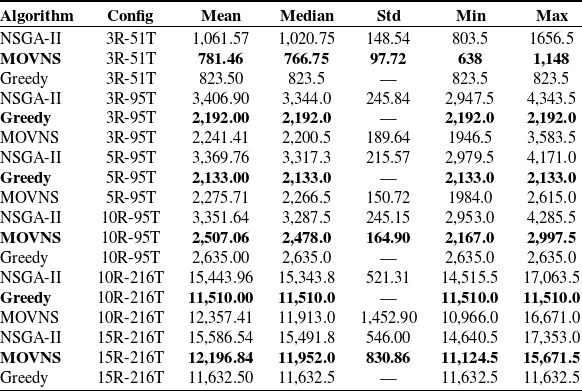
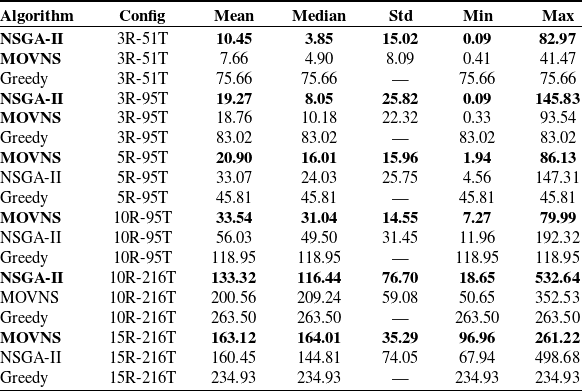
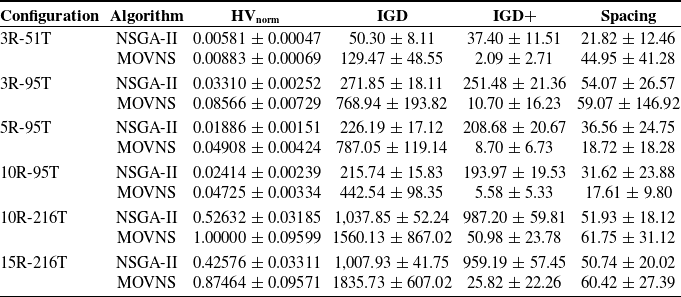
 ±
 4.34433×10⁹