





1. Introduction
The added mass force has been of fundamental interest in fluid dynamics for over a century (Lamb Reference Lamb1924). This force was originally derived in potential flow, where an accelerating sphere in an unbounded quiescent fluid experiences a retarding force proportional to the product of the acceleration and half the mass of fluid displaced. Since this force is proportional to acceleration, it appears as an additional mass in Newton's second law of motion for the sphere. Over the years, other authors have extended this idea to other geometries (Brennen Reference Brennen1982, Reference Brennen2005; Newman Reference Newman2018), as well as studied the neighbour influence of other spheres on the added mass force (Zuber Reference Zuber1964; Helfinstine & Dalton Reference Helfinstine and Dalton1974; Wijngaarden & Jeffrey Reference Wijngaarden and Jeffrey1976; Kok Reference Kok1988; Biesheuvel & Spoelstra Reference Biesheuvel and Spoelstra1989; Cai & Wallis Reference Cai and Wallis1994; Park, Klausner & Mei Reference Park, Klausner and Mei1995; Bremond et al. Reference Bremond, Arora, Dammer and Lohse2006; Pope et al. Reference Pope, Babul, Pavlovski, Bower and Dotter2010; Lavrenteva, Prakash & Nir Reference Lavrenteva, Prakash and Nir2016). The shape effect contributes to significant oscillations in the paths of rising bubbles (Miksis, Vanden-Broeck & Keller Reference Miksis, Vanden-Broeck and Keller1982; Meiron Reference Meiron1989; Ellingsen & Risso Reference Ellingsen and Risso2001; Mougin & Magnaudet Reference Mougin and Magnaudet2002; De Vries, Biesheuvel & Van Wijngaarden Reference De Vries, Biesheuvel and Van Wijngaarden2003; Ohl, Tijink & Prosperetti Reference Ohl, Tijink and Prosperetti2003), and the general finding has been that both the shape effect and the neighbour influence are significant.
Regarding the added mass influence of neighbours, Zuber (Reference Zuber1964) used the potential flow of two concentric spheres to approximate the volume fraction effect on added mass. This approximation was recovered in the more involved work of Sangani, Zhang & Prosperetti (Reference Sangani, Zhang and Prosperetti1991), who used small-amplitude oscillatory motion to rigorously derive the correction. Cai & Wallis (Reference Cai and Wallis1994) generalized the approach of Zuber (Reference Zuber1964) by considering a continuum of boundary conditions on the outer concentric sphere parameterized by the ‘external impedance’. This formulation has an upper bound corresponding to the result of Zuber (Reference Zuber1964), and a lower bound with an ‘ideally compliant pressure release surface’. These upper and lower bounds have been shown to reasonably approximate various structured configurations of particles (Simcik, Ruzicka & Drahoš Reference Simcik, Ruzicka and Drahoš2008; Béguin & Étienne Reference Béguin and Étienne2016). Recently Béguin & Étienne (Reference Béguin and Étienne2016), Béguin, Étienne & Pettigrew (Reference Béguin, Étienne and Pettigrew2017) and Zoghlami et al. (Reference Zoghlami, Béguin, Teyssedou, Scott, Bornard and Etienne2021) proposed a binary model to account for the neighbour influence in addition to examining structured arrays of particles.
In the past, several physical interpretations have been proposed for the added-mass effect. A force proportional to acceleration mathematically appears as additional mass in Newton's second law, which has led many to posit the interpretation that the added mass force arises from accelerating nearby fluid. More recently, Limacher, Morton & Wood (Reference Limacher, Morton and Wood2018) presented a generalized derivation of the added mass and circulatory force decomposition, and addressed added mass force in the presence of vorticity generation and finite Reynolds number effects (Wu Reference Wu1981; Lighthill Reference Lighthill1986; Magnaudet, Rivero & Fabre Reference Magnaudet, Rivero and Fabre1995; Noca, Shiels & Jeon Reference Noca, Shiels and Jeon1999; Bagchi & Balachandar Reference Bagchi and Balachandar2002; Wakaba & Balachandar Reference Wakaba and Balachandar2007).
In this work, we extend the past studies by considering the added mass force of a random distribution of spheres through a computational approach. We consider the spheres to be rigid and non-deformable and therefore will refer to them as particles, henceforth. However, the results are fully applicable to non-deformable spherical bubbles (Prosperetti Reference Prosperetti2004; Lohse Reference Lohse2018) and droplets as well. We use the method of images (Helfinstine & Dalton Reference Helfinstine and Dalton1974) to generate the complete potential flow solution around many particles randomly distributed within triply periodic domains. We then use the potential flow solution to obtain the added mass force of all the individual particles within the periodic domain. Our interest is to develop a better understanding of how a particle's acceleration influences other particles in its neighbourhood as mediated by the surrounding fluid and translate this understanding to improved models of the added mass force that can be used in Euler–Lagrange (EL) and Euler–Euler (EE) simulations.
A number of recent particle-resolved simulations have considered steady flows over a random distribution of particles driven by a spatially uniform streamwise pressure gradient (Beetstra, van der Hoef & Kuipers Reference Beetstra, van der Hoef and Kuipers2007; Tenneti, Garg & Subramaniam Reference Tenneti, Garg and Subramaniam2011; Tang et al. Reference Tang, Peters, Kuipers, Kriebitzsch and van der Hoef2015; Akiki & Balachandar Reference Akiki and Balachandar2016; He, Tafti & Nagendra Reference He, Tafti and Nagendra2017; Seyed-Ahmadi & Wachs Reference Seyed-Ahmadi and Wachs2020). The key findings of relevance to the present work are as follows: (i) the average steady drag on the random array of particles is substantially larger than that of an isolated particle for the same Reynolds number, and the difference increases with volume fraction. (ii) There is substantial particle-to-particle variation in the drag force, with the drag force of some particles being significantly higher or lower than the average. (iii) Even though the average transverse force on the array as a whole is zero, each particle within the array is subjected to substantial transverse force. (iv) The departure of drag and transverse forces on an individual particle from their average values can be deterministically predicted by knowing the relative location of the nearest few neighbours (Akiki, Jackson & Balachandar Reference Akiki, Jackson and Balachandar2016, Reference Akiki, Jackson and Balachandar2017; Moore, Balachandar & Akiki Reference Moore, Balachandar and Akiki2019).
In the present context, we consider a random distribution of particles. But, instead of a steady viscous flow, we consider an unsteady potential flow due to the acceleration of the particles. Let us first restrict to the limit when all the particles are accelerating together (or the particles can be considered stationary and the surrounding fluid to be accelerating, which introduces an additional pressure gradient force). The four analogous questions that arise are: (i) How does the average added mass force of the random array differ from the added mass force of an isolated particle, for the same acceleration? (ii) What is the level of particle-to-particle variation in the added mass force? (iii) Can the added mass force on the individual particles in the transverse direction normal to the direction of acceleration be quantified? (iv) Can the streamwise and transverse added mass forces on individual particles be accurately predicted in an efficient manner?
We attempt to answer these questions under a more general situation where each particle within the random distribution is accelerating differently (i.e. all the particles are not restricted to moving with a common acceleration). This generalization raises additional questions such as: (v) What is the effect of acceleration variation among the randomly distributed particles on the average added mass force as well as the level of particle-to-particle variation? Answering these questions will be the focus of this work. We answer these questions by solving the potential flow under the general condition of randomly positioned and accelerating particles to obtain the complete added mass tensor of the system and analyse its properties.
We envision such a detailed understanding of the added mass force to help in the development of more accurate EL and EE approaches. In the context of EL simulations, the motion of all the particles within the system is tracked. Despite the knowledge of all the neighbours’ positions and motion, and their importance in dictating the added mass force, existing force models generally calculate the added mass force on each particle by assuming it to be either isolated or taking into the collective effect of neighbours through a volume fraction correction, without accounting for the specific influence of neighbours. This simplification is due to the lack of a reliable added mass force model that will accurately and efficiently account for the influence of neighbours. A deterministic model that can accurately predict the added mass force of a particle based on its acceleration, as well as the acceleration of all its neighbours, will be very useful. In the context of the EE approach, individual particles are not tracked and as a result, we cannot, and do not need to, deterministically predict the added mass force on each particle. However, statistical properties such as the mean and standard deviation of the added mass force of a distribution of particles will be of great value to accurate EE simulations.
The potential flow solution offers ground truth information on the added mass force (and the added mass tensor) of a random distribution of accelerating particles. By analysing the statistical properties, we first extract the statistics of the added mass force as a function of local volume fraction. The mean statistics provided may be useful as a simple model for EE simulations. In an EL approach, such statistical information may be used as a mean model, but cannot correctly identify particles that have higher or lower than average added mass force due to variance of their neighbour's relative arrangement.
For this reason, we proceed to develop a deterministic model where the added mass tensor of each particle within the random distribution can be accurately calculated. This will be achieved with a hierarchical approach, where the added mass effect of neighbours is expanded as a series of progressively more complex inter-particle interactions. In this hierarchical model, the leading-order term is the added mass force of an isolated particle. At the next order, we have the effect of all binary interactions between pairs of particles, which is followed by trinary interactions between the particles, and so on. We observe the performance of the binary model to be adequate except in situations when two particles approach very close to each other, consistent with the findings of Béguin & Étienne (Reference Béguin and Étienne2016). We evaluate the accuracy of the binary model by comparing its predictions against the exact potential flow results.
Evaluation of the trinary and higher-order interactions is computationally expensive. Therefore, we provide a simple physics-inspired correction to the binary model to approximately account for the trinary and other higher-order effects in an average sense. This correction naturally emerges from the method of images solution to the potential flow. The corrected binary model is observed to correctly predict the added mass force on a random distribution of particles provided we include all the neighbours within a neighbourhood of approximately 10 particle radii. However, the binary model suffers in accuracy when fewer neighbours are considered. This source of error is reduced by accounting for the effect of far-field neighbours statistically, while considering the effect of nearby neighbours deterministically.
The performance of the corrected binary model for the deterministic prediction of the added mass force of a particle within a random distribution can be compared with the corresponding performance of analytical pairwise interaction extended point-particle model (Akiki et al. Reference Akiki, Jackson and Balachandar2017; Moore et al. Reference Moore, Balachandar and Akiki2019) and machine learning binary models (Seyed-Ahmadi & Wachs Reference Seyed-Ahmadi and Wachs2022; Cheng & Wachs Reference Cheng and Wachs2023; Siddani & Balachandar Reference Siddani and Balachandar2023; Siddani et al. Reference Siddani, Balachandar, Zhou and Subramaniam2024) developed for the deterministic prediction of the quasi-steady drag and lift forces. We find the deterministic prediction of the corrected binary added mass force model to be excellent for all volume fractions considered, far better in performance than the binary quasi-steady force models. The difference in performance is perhaps due to the faster decay of the potential flow compared with the finite Reynolds number counterpart. This allows accurate closures of the added mass force in incompressible multiphase flows.
The present manuscript is organized as follows. The theoretical derivation of the added mass force for a system of spherical particles is outlined in § 2. Subsequently, the computational method is outlined in § 3. In § 4, results are presented for random arrays of particles, which may be used as a mean added mass model. Afterward, the hierarchical model is developed in § 5. Finally, conclusions are drawn in § 6.
2. General formulation of the added mass force
2.1. Governing equations
As derived originally by Milne-Thompson (Reference Milne-Thompson1960), and later stated by Helfinstine & Dalton (Reference Helfinstine and Dalton1974), the potential flow over a random distribution of spheres moving arbitrarily may be found using the method of images. We summarize this method beginning with a single moving sphere in a quiescent flow which can be described by a single doublet yielding the velocity potential
 \begin{equation} \phi ={-}\frac{1}{2}\frac{a^3 V_i ( x_i - \zeta_i)}{[(x_j - \zeta_j) (x_j - \zeta_j)]^{3/2}}, \end{equation}
where  $\phi$ is the velocity potential,
 $a$ is the radius,
 $\boldsymbol{x}$ is the position vector where the potential is being evaluated,
 $\boldsymbol{\zeta}$ is the centre and
 $\boldsymbol{V}$ is the velocity of the sphere. The subscripts indicate index notation and the sum over repeated indices is implied. Since the doublet velocity decays as the cube of position, if two spheres are sufficiently far from one another they may each be represented by a single doublet. However, if their separation distance is sufficiently small, the potential perturbation from the neighbouring doublet will modify the streamsurface of the other sphere thereby invalidating the solution. The method of images proposes to rectify this conundrum by iteratively adding doublets of smaller amplitude to the flow to reform the boundary streamlines to spherical geometry. For instance, in a two-sphere system, the first two doublets are initialized according to (2.1) and denoted as
 $\tilde {\zeta }^{11}$ and
 $\tilde {\zeta }^{21}$ in figure 1. The doublet of sphere 2 invalidates the solution of sphere 1 by creating a non-zero normal velocity on the surface of sphere 1. This is compensated for by adding another doublet within sphere 1 to repair the streamlines. This of course, must also be done in sphere 2 as well. This second pair of doublets are denoted as
 $\tilde {\zeta }^{12}$ and
 $\tilde {\zeta }^{22}$ in figure 1. However, after this procedure has been carried out, the secondary doublets once again create a distortion on the surface of their neighbouring spheres. Therefore, a third pair of doublets counteracting the second pair must be added (denoted as
 $\tilde {\zeta }^{13}$ and
 $\tilde {\zeta }^{23}$ in figure 1), and so on until convergence is obtained.
Two particles of unit radius at positions  $\zeta ^p=\tilde {\zeta }^{11}$ and
 $\zeta ^p=\tilde {\zeta }^{21}$ shown as red spheres, which correspond to the initial doublets. The reflected doublets are also shown as spheres with their radius equivalent to an isolated sphere with the same
 $\beta$ value as in (2.3a–c). Their centres are located at
 $\tilde {\zeta }^{12}$ and
 $\tilde {\zeta }^{22}$ for the first reflection and so on.

Helfinstine & Dalton (Reference Helfinstine and Dalton1974) generalized this process for a system of  $N$ spheres. Their formulation is the basis of this work and may be used to derive a potential function
 $\phi$ as a summation of doublets
 \begin{equation} \phi(\boldsymbol{x}) ={-}\sum_{p=1}^{N} \sum_{m=1}^{N_d} \phi^{pm} ={-}\sum_{p=1}^N \sum_{m=1}^{N_d} \beta^{pm} \frac{\tilde V_i^{pm} \tilde x_i^{pm}}{(\tilde x_j^{pm} \tilde x_j^{pm})^{3/2}}, \end{equation}
where  $\tilde x_i^{pm} = x_i - \tilde \zeta ^{pm}_i$, and
 $\boldsymbol{\tilde \zeta }^{pm}$ is the doublet position as shown in figure 1. Each term
 $\phi ^{pm}$ is the potential field of a doublet. The first superscript,
 $p$, indicates the particle in which the doublet centre is placed. The second superscript,
 $m$, indicates the index of the doublet belonging to particle
 $p$. Here,
 $N_d$ is the number of reflected doublets in each particle, such that the exact solution is recovered as
 $N_d \to \infty$. All subscripts are Cartesian indices. Conversely, superscripts are non-Cartesian indices that do not sum. It should be noted that a summation over infinite series of reflected doublets is sufficient to exactly recover the potential flow solution, whereas for the corresponding Stokes flow, a higher-order multipole expansion is required (Kim & Karrila Reference Kim and Karrila2013).
The base doublets (i.e.  $m=1$ doublets), corresponding to the potential field of isolated spheres, are given by the parameters
 \begin{equation} \beta^{p1} = \tfrac{1}{2} (a^{p})^3,\quad \tilde V^{p1}_i = V^{p}_i,\quad \tilde \zeta^{p1}_i = \zeta^{p}_i. \end{equation}
Here,  $a^p$ is the radius,
 $\boldsymbol{V}^p$ is the velocity and
 $\boldsymbol{\zeta}^p$ is the position of particle
 $p$. For the reflected doublets (
 $m>1$), the parameters are given by
 \begin{equation} \left.\begin{gathered} \xi^{pm}_i = \tilde \zeta^{qn}_i - \zeta^{p}_i \\ \tilde \zeta^{pm}_i = \zeta^p_i + \frac{(a^p)^2}{\xi^{pm}_k\xi^{pm}_k }\xi^{pm}_i \\ \beta^{pm} = \frac{1}{2} \beta^{qn} \frac{(a^p)^3}{(\xi^{pm}_k \xi^{pm}_k)^{3/2}} \\ \tilde V^{pm}_i = \left(\delta_{ik} - \frac{3 \xi^{pm}_i \xi^{pm}_k}{\xi^{pm}_f \xi^{pm}_f}\right) \tilde V^{qn}_k, \end{gathered}\right\},\quad m > 1,\enspace p \neq q, \end{equation}
where  $\delta _{ij}$ is the Kronecker delta (note that this formula in the work of Helfinstine & Dalton (Reference Helfinstine and Dalton1974) contains a typo). Here, the
 $m$th doublet of the
 $p$th particle is a reflection of the
 $n$th doublet of the
 $q$th particle. The pair
 $(q,n)$ is selected to maximize the doublet strength,
 $\beta ^{pm}$, with the condition that the
 $(q,n)$ doublet has not already been reflected at the
 $p$th particle. Formally this implicit dependence of
 $(q,n)$ on
 $(p,m)$ can be expressed as
 \begin{align} & \beta^{pm}(q(p, m), n(p, m)) \nonumber\\ &\quad =\max_{r, l} \{\beta^{pm}(r=q, l=n) \,|\, (q(p, h), n(p, h)) \neq (q(p, m), n(p, m)) \forall (h < m)\}. \end{align}
This method converges because the doublet strengths,  $\beta ^{pm}$, are guaranteed to decay with increasing order of reflection, due to the condition
 $(a^{pm}/\sqrt {\xi ^{pm}_i \xi ^{pm}_i})^3 < 1$ (Helfinstine & Dalton Reference Helfinstine and Dalton1974). The velocity is then given as the gradient of the potential
 \begin{equation} u_i = \frac{\partial \phi}{\partial x_i}. \end{equation}
Notation: We will use  $i, j, k, f = 1, 2, 3$ as Cartesian index subscripts,
 $p, q, r, s = 1, \ldots, N$ as superscripts to indicate particles and
 $l, m, n, h = 1, \ldots, N_d$ as superscripts to denote a doublet. Where appropriate, we will also use subscripts
 $i, j$ to denote matrix elements.
2.2. Force derivation
Only a pressure integral on the surface is required to determine the force experienced by the  $s$th sphere (Helfinstine & Dalton Reference Helfinstine and Dalton1974)
 \begin{equation} F^s_i ={-}{\unicode{x222F}}_{\partial s} p n_i \,{\rm d} A, \end{equation}
where the integral is over the surface of sphere  $s$, and
 $\boldsymbol{n}$ is the outward pointing normal vector. Furthermore, the pressure is given by the unsteady Bernoulli equation
 \begin{equation} \frac{\partial \phi}{\partial t} + \frac{p - p^{ref}}{\rho} + \frac{u_i u_i - u^{ref}_j u^{ref}_j}{2} = f(t), \end{equation}
where  $p^{ref}$ and
 $\boldsymbol{u}^{ref}$ are the reference pressure and velocity,
 $\rho$ is the fluid density and
 $f(t) = 0$ is an arbitrary function of time. Therefore, the force may be written as
 \begin{equation} F^s_i = \rho {\unicode{x222F}}_{\partial s} \frac{\partial \phi}{\partial t} n_i \,{\rm d} A + \frac{\rho}{2} {\unicode{x222F}}_{\partial s} u_j u_j n_i \,{\rm d} A. \end{equation}
The second integral on the right-hand side of (2.9) contributes only to the quasi-steady force and the first integral is the sole contributor to the added mass force. For the case when all the particles are moving together with a common velocity and acceleration (or equivalently a fixed assembly of particles subjected to a uniform accelerating flow), the first integral is the sum of the added mass and pressure gradient forces. However, as the forthcoming analysis will show, with relative motion between the particles, a contribution to the quasi-steady force also arises from this term. We may write the time derivative of the potential as
 \begin{align} \frac{\partial \phi^{pm}}{\partial t} = \beta^{pm} \frac{{\rm d} \tilde V^{pm}_i}{{\rm d} t} \frac{\tilde{x}_i^{pm}}{(\tilde{x}_l^{pm} \tilde{x}_l^{pm})^{3/2}} + \frac{{\rm d} \beta^{pm}}{{\rm d} t} \tilde V^{pm}_i \frac{\tilde{x}_i^{pm}}{(\tilde{x}_l^{pm} \tilde{x}_l^{pm})^{3/2}} + \beta^{pm} \tilde V_i^{pm} \frac{\partial}{\partial t} \left[\frac{\tilde{x}_i^{pm}}{(\tilde{x}_l^{pm} \tilde{x}_l^{pm})^{3/2}}\right]. \end{align}
Only the first term on the right-hand side contributes to the added mass force since it can be shown to linearly depend on particle acceleration. The other two terms do not involve particle acceleration, therefore they contribute to the quasi-steady force. We aim to derive a formula for the added mass tensor, since it is agnostic to the acceleration of the particles and depends only on the relative configuration of the particles.
With this goal in mind, we first note that the strength  $\beta ^{pm}$ of the imaged doublet is independent of the particle velocity. Additionally, the formulation for
 $\boldsymbol{\tilde V}^{pm}$ in (2.4) refers back to the velocity of an earlier defined doublet, which can be referred back to an even earlier doublet, and so on. This telescopic process can be continued for each doublet, so that each image doublet can be connected to an original doublet associated with one of
 $N$ particles in the system. Thus, we may write the velocity associated with the
 $m$th doublet of the
 $p$th particle as a recurrence relation
 \begin{equation} \tilde V^{pm}_i = G^{pm}_{ij} V^{b^{pm}}_j, \end{equation}
where  $b^{pm}$ is its associated original doublet and we have the condition
 $b^{pm} \leq N$. This is a crucial step because it allows us to express every doublet velocity,
 $\tilde V^{pm}_i$, in terms of a physical particle velocity,
 $V^{b^{pm}}_j$. Recall that each image doublet is an image of another doublet, which is the image of another doublet and so on until the base doublets are reached. In the above relation, the recurrence matrix is given by
 \begin{equation} G^{pm}_{ij} = \left(\delta_{ik} - \frac{3 \xi^{pm}_i \xi^{pm}_k}{\xi^{pm}_f \xi^{pm}_f}\right) G^{qn}_{kj} \quad \mbox{for}\ m > 1 , \end{equation}
with the starting condition
 \begin{equation} G^{p1}_{ij} = \delta_{ij}. \end{equation}
The time derivative of  $\tilde V^{pm}_i$ in the first term on the right-hand side of (2.10) may be expressed as
 \begin{equation} \frac{{\rm d} \tilde V^{pm}_i}{{\rm d} t} = G^{pm}_{ij} \frac{{\rm d} V^{b^{pm}}_j}{{\rm d} t} + V^{b^{pm}}_j \frac{{\rm d} G^{pm}_{ij}}{{\rm d} t}. \end{equation}
Because  $G^{pm}_{ij}$ is not a function of
 $\tilde V^{rl}_k\ \forall r,l,k$, the second term only contributes to the quasi-steady portion of the force. Thus, the added mass force on the
 $s$th particle is given by substituting the first term on the right-hand side of (2.14) into the first term on the right-hand side of (2.10), and then substituting into the first integral on the right-hand side of (2.9)
 \begin{equation} F^{AM,s}_i ={-}\rho {\unicode{x222F}}_{\partial s} n_i \sum_{p=1}^N \sum_{m=1}^{N_d} \beta^{pm} \frac{\tilde x^{pm}_k}{(\tilde x^{pm}_f \tilde x^{pm}_f)^{3/2}} G^{pm}_{kj} \frac{{\rm d} V^{b^{pm}}_j}{{\rm d} t} {\rm d} A. \end{equation}
This summation may be re-grouped to define a single added mass tensor,  $C^{sp}_{ij}$, corresponding to each particle acceleration
 \begin{equation} F^{AM,s}_i ={-}\rho {V \kern-8pt -}^s \sum_{p=1}^N C^{sp}_{ij} \frac{{\rm d} V^p_j}{{\rm d} t}, \end{equation}
where  ${V \kern-8pt -} ^s$ is the volume of the
 $s$th particle, and
 \begin{equation} C^{sp}_{ij} = \frac{1}{{V \kern-8pt -}^s} {\unicode{x222F}}_{\partial s} n_i \sum_{r=1}^N \sum_{\substack{m=1 \\ b^{rm} = p}}^{N_d} \beta^{rm} G^{rm}_{kj} \frac{\tilde x^{rm}_k}{(\tilde x^{rm}_f \tilde x^{rm}_f)^{3/2}} {\rm d} A. \end{equation}
The interpretation of  $C^{sp}_{ij}$ is that it is the added mass coefficient of the
 $i$th component of force on the
 $s$th particle resulting from the acceleration along the
 $j$th direction of the
 $p$th particle. With this expression, we see that the acceleration of a particle generates added mass force not only on that particle but on all the particles. If we set
 $p=s$, then we obtain
 $C^{ss}_{ij}$ as the added mass tensor of the
 $s$th particle due to its own acceleration. Note that
 $C^{ss}_{ij} = \delta _{ij}/2$ only in the limit of an isolated particle. In the presence of other nearby particles, their effect will substantially alter
 $C^{ss}_{ij}$. For
 $p \ne s$,
 $C^{sp}_{ij}$ corresponds to the added mass effect of one particle's (
 $p$th particle's) acceleration on another particle (
 $s$th particle). This is sometimes referred to as the induced added mass tensor.
The added mass tensors can then be assembled into a resistance matrix analogous to Stokesian dynamics (Jeffrey & Onishi Reference Jeffrey and Onishi1984; Brady & Bossis Reference Brady and Bossis1988)
 \begin{equation} R_{3(s-1)+i,3(p-1)+j} = C_{ij}^{sp}. \end{equation}
Now the added mass force on all the particles may be written as linearly related to the particle accelerations as
 \begin{equation} \begin{bmatrix} \boldsymbol{F}^1 \\ \boldsymbol{F}^2 \\ \vdots \\ \boldsymbol{F}^N \end{bmatrix} ={-}\rho \underline{\underline{{V \kern-8pt -}}}\underline{\underline{R}} \frac{{\rm d}}{{\rm d} t} \begin{bmatrix} {\boldsymbol{V}}^1 \\ {\boldsymbol{V}}^2 \\ \vdots \\ {\boldsymbol{V}}^N \end{bmatrix}, \end{equation}
where the forces and velocities are represented as column vectors. In this notation,  $\underline {\underline {R}}$ is a
 $N \times N$ block matrix, with each block consisting of a
 $3 \times 3$ tensor. The diagonal blocks are the added mass contribution of each particle's acceleration to its own force. The off-diagonal blocks correspond to the induced mass tensors. Here, we refer to all the blocks as part of the added mass effect of the system. Similarly, the normalization is with respect to the individual particle volume such that
 $\underline {\underline {{V \kern-8pt -} }}$ is a block matrix where the diagonal blocks are identity matrices multiplied by the volume of the forced particle and the off-diagonal blocks are 0
 \begin{equation} \underline{\underline{{V \kern-8pt -}}} = \begin{bmatrix} {V \kern-8pt -}^1 \underline{\underline{I}} & \underline{\underline{0}} & \ldots & \underline{\underline{0}} \\ \underline{\underline{0}} & {V \kern-8pt -}^2\underline{\underline{I}} & \ldots & \underline{\underline{0}} \\ \vdots & \vdots & \ddots & \vdots \\ \underline{\underline{0}} & \ldots & \underline{\underline{0}} & {V \kern-8pt -}^N \underline{\underline{I}} . \end{bmatrix} \end{equation}
Furthermore, in this work, we are concerned with monodisperse systems, where  ${V \kern-8pt -} = {V \kern-8pt -} ^s \forall s$.
3. Computational method
A computational method was devised to evaluate the added mass tensors that are part of the matrix  $\underline {\underline {R}}$. When considering a very large random distribution of
 $N$ particles, two truncations are necessary. For each particle, only the nearest
 $N_n$ neighbours are considered for creating image doublets. Additionally, each particle is limited to
 $N_d$ doublets including its base doublet and additional image doublets. The image doublets to be included in the summation are selected to have the maximum values of
 $\beta ^{pm}$ as adumbrated in (2.5) while restricting the search to the
 $N_n$ nearest neighbours.
We consider a random distribution of  $N$ particles in a triply periodic box. Due to translational invariance implied by the periodicity, every particle within the primary triply periodic box is surrounded by infinite other particles. When computing the added mass tensors, it is sufficient to consider only the
 $27N$ particles within the primary and immediately neighbouring triply periodic boxes. The double summation given in (2.17) is then performed for each combination of
 $s$ and
 $p$ particle. Surface integration is carried out numerically using a Lebedev quadrature scheme of order
 $N_I$ (Lebedev Reference Lebedev1975; Becke Reference Becke1988).
3.1. Convergence and verification
The above-presented computational method involves three numerical parameters  $\{N_n, N_d, N_I\}$, which must be carefully chosen to obtain fully converged results. We have tested the numerical method for a system of
 $N=1000$ particles in a periodic unit by systematically varying
 $\{N_n,N_d,N_I\}$. The different resolutions considered are listed in table 1. They were compared with a very high-resolution case labelled ‘Reference Resolution’.
Numerical parameters used for the convergence study. Each parameter was varied systematically while maintaining the highest resolution for the other two parameters. These were then compared with a high-resolution case labelled ‘Reference Resolution’. A sufficient resolution was then determined to run the remaining cases labelled ‘Used Resolution’. The test case was run with  $\alpha =0.4$ since this is the case requiring the highest resolution.

To quantify the error relative to the reference case, we define two error metrics  ${\underline {\underline {E}}} = {\underline {\underline {R}}}_{RE1} - {\underline {\underline {R}}}_{REF}$, where the subscripts
 $REF$, and
 $RE1$ indicate the reference and the other resolution. The maximum and root-mean-square (r.m.s.) errors are defined to be
 \begin{equation} E_{L_\infty} = \max_{ij} \frac{|E_{ij}|}{1/2} \quad \mbox{and} \quad E_{rms} = \frac{\sqrt{E_{ij}E_{ij}}}{3N/2}, \end{equation}
where the maximum error has been normalized by the added mass of an isolated particle and the r.m.s. has been normalized such that  $E_{rms} \leq E_{L_\infty } \forall \underline {\underline {E}}$. Calculations at the resolutions listed in table 1 were run for a realization of 1000 particles at the highest particle volume fraction presently considered of 0.4. At this volume fraction, the neighbour distances are small and the neighbour influences are strong. As displayed in figure 2, the results become nearly identical in terms of the r.m.s. error as the refinement of each numerical parameter increases. In interpreting the maximum error, it should be noted that the resistance matrix is large with
 $1000 \times 1000$ blocks of
 $3 \times 3$ tensors (9 million total values). The worst-case error of a couple per cent is observed in an isolated element of the resistance matrix. Informed by figure 2, the resolution listed as ‘Used Resolution’ in table 2 was determined to be sufficient for the remainder of the cases. When compared with the reference case, the used resolution had a maximum error of 2.2 % and an r.m.s. error of
 $4.1\times 10^{-4}$, indicating that the combined effect of reducing the resolution for several parameters does not disproportionately increase the error. Most importantly, statistical quantities, such as mean and standard deviation of added mass force, to be reported in this work have been verified to be insensitive to the two resolutions and thus confirmed to be fully converged. Therefore, the resolution utilized presently is adequate.
Two different error measures for the various resolutions listed in table 1 for a random array of particles within a triply periodic box at  $\alpha =0.4$ measured against the ‘Reference Resolution’.

The present method of computing the potential flow closely follows that outlined in Helfinstine & Dalton (Reference Helfinstine and Dalton1974) and differs from that used by Béguin & Étienne (Reference Béguin and Étienne2016). As verification, we have reproduced the results presented in Helfinstine & Dalton (Reference Helfinstine and Dalton1974) and here we compare with those of Béguin & Étienne (Reference Béguin and Étienne2016) in figure 3. The first case examined was that of a line of 7 particles along the  $x_1$ axis accelerating in unison in the
 $x_1$ direction and then in the
 $x_2$ direction. As shown in figure 3(a), the resulting added mass coefficient for the central particle is in excellent agreement with the literature. The second validation case was that of a
 $7 \times 7$ plane of particles accelerating normal to the plane. This result, which is displayed in figure 3(b), also exhibits good agreement with the results of Béguin & Étienne (Reference Béguin and Étienne2016).
Verification of the present computational method against the approach of Béguin & Étienne (Reference Béguin and Étienne2016). (a) The added mass coefficient for the centre particle of a line of 7 particles accelerating along ( $x_1$) and perpendicular (
 $x_2$) to the line. (b) The added mass coefficient of a
 $7\times 7$ plane of particles accelerating in the normal direction of the plane. In (a,b) all the particles accelerate together and only a few particles are shown in the schematic for brevity.

We then verify the present approach for a randomly distributed cloud of particles. For instance, Béguin & Étienne (Reference Béguin and Étienne2016) examined a cloud of particles around a central particle located at the origin. The surrounding particles were selected randomly such that their centres were within a distance of  $5$ radii of the central particle. This configuration corresponds to approximately 22 neighbours at 10 % volume fraction and 87 neighbours at 40 % volume fraction. They then calculated the added mass coefficient on the central particle assuming that all the particles accelerate rigidly together. The problem can be reduced to added mass coefficient along the acceleration direction (parallel component) and an orthogonal component (perpendicular component) defined as
 \begin{equation} C_{M\parallel}^s = \frac{\boldsymbol{F}^s \boldsymbol{\cdot} \boldsymbol{\hat t}}{\rho {V \kern-8pt -} |{\rm d} \boldsymbol{V}^s/{\rm d} t|} \quad \mbox{and} \quad C_{M\perp}^s = \frac{|\boldsymbol{F}^s - (\boldsymbol{F}^s \boldsymbol{\cdot} \boldsymbol{\hat t}) \boldsymbol{\hat t}|}{\rho {V \kern-8pt -} |{\rm d} \boldsymbol{V}^s/{\rm d} t|}. \end{equation}
Here,  $\boldsymbol {\hat t} = (\textrm {d} \boldsymbol {V}^s/\textrm {d} t) / |\textrm {d} \boldsymbol {V}^s/\textrm {d} t|$, is the unit vector along the acceleration. In a monodisperse system, the volume of each particle is
 ${V \kern-8pt -}$. Béguin & Étienne (Reference Béguin and Étienne2016) then proposed a mean model of
 $C_{M\parallel } = 0.5 + 0.34 \alpha ^2$, where
 $C_{M\parallel }$ is the coefficient of added mass in the direction parallel to the flow. Presently, we replicated the results of Béguin & Étienne (Reference Béguin and Étienne2016) finite clouds of particles similar to theirs. We also compared the results with the present approach of generating much larger random clouds of particles. The results are presented in figure 4. The overall good agreement provides strong verification of the present computation methodology and convergence. It should be stressed that the above definition of
 $C_{M\parallel }^s$ differs from some other sources in the literature that use the acceleration relative to the mixture average instead of the acceleration relative to the continuous phase alone (Sangani et al. Reference Sangani, Zhang and Prosperetti1991). If figure 4 is replotted with normalization modified to acceleration relative to the mixture average, then the results are in good agreement with classical results (Zuber Reference Zuber1964).
The streamwise component of the added mass coefficient of a central particle surrounded by neighbours within a small cloud of radius  $5a$. The scatter plot shows the data of Béguin & Étienne (Reference Béguin and Étienne2016), generated by considering an ensemble of realizations and volume fractions,
 $\alpha$. The mean value of streamwise added mass coefficient, calculated presently, as a function of
 $\alpha$ is also shown with the error bars marking the 95 % confidence interval assuming the values are normally distributed at each volume fraction. The curve fit given in Béguin & Étienne (Reference Béguin and Étienne2016) is also plotted. Also shown in the figure are the average added mass coefficient calculated using a much larger triply periodic array of particles.

4. Added mass of a random distribution of particles
4.1. Characterization of the distribution of particle positions
The problem of interest is the evaluation of the added mass tensor of a large random distribution of particles. It is important to first characterize the precise nature of the random distribution of particles, since the statistical properties of added mass will depend on the nature of the distribution. Here we generate the random array in the following way. A triply periodic box is initially filled with a structured array of particles at the desired volume fraction. The particles are given initial random motion and allowed to undergo perfectly elastic collisions. We allow the random collisional process to evolve for some time and freeze the particles at some later time when the distribution has reached a statistical equilibrium. This process of collisional equilibrium works well at modest to large particle volume fraction. However, at lower volume fractions, the collisional algorithm takes much longer to reach statistical equilibrium, due to the infrequent nature of inter-particle collision. Instead, a random sequential insertion algorithm may be sufficient to generate the random distribution of particles. Here we use the collisional equilibrium approach to generate the random particle distribution for  $\alpha > 0.1$.
The statistical properties of the resulting random distributions of particles were examined. The probability density function (PDF) of free Voronoi volumes associated with the random distribution of particles was calculated, where the free Voronoi volume of a particle is defined as  ${V \kern-8pt -} _f = {V \kern-8pt -} _v - (3\sqrt {2}{V \kern-8pt -} /{\rm \pi} )$, with
 ${V \kern-8pt -} _v$ being the Voronoi volume of the particle and
 ${V \kern-8pt -}$ being the volume of the particle. The computed PDF of free Voronoi volume scaled by the mean free Voronoi volume is plotted in figure 5 for five different volume fractions. Also plotted in the figure are the 3
 $\varGamma$ distributions which have been shown to accurately characterize random uniform distributions of particles (Senthil Kumar & Kumaran Reference Senthil Kumar and Kumaran2005). The agreement is very good, indicating well-characterized random distributions of particles to be used in the present potential flow computations.
Distributions of Voronoi free volume for five different mean volume fraction values. The data (symbols) are plotted alongside the 3 $\varGamma$ distributions (lines) with parameters taken from Senthil Kumar & Kumaran (Reference Senthil Kumar and Kumaran2005).

4.2. Characterization of the distribution of particle accelerations and resulting forces
In studying the added mass of a random distribution of  $N$ particles we are first faced with the challenge of analysing
 $N^2$ added mass tensors that fully encode the force experienced by each particle due to any arbitrary acceleration configuration of itself and its neighbours. To simplify matters, it is often assumed that all the particles have a common acceleration. In which case, the problem simplifies to one added mass tensor for each of the
 $N$ particles, and each tensor further reduces to a component along the acceleration direction (parallel component) and an orthogonal component (perpendicular component). The parallel and perpendicular added mass coefficients were defined in (3.2a,b).
As stated in the introduction, the objective of this work has been to aid in better modelling of the added mass force to be used in the EL and EE simulations. In a real application, although the acceleration of a particle and its neighbours may likely have similar values, dictated by the acceleration of the surrounding fluid, there is likely to be some particle-to-particle variation in acceleration due to the random distribution of particles. It is therefore important to assess the added mass effect of such particle-to-particle variation in acceleration.
We account for the particle-to-particle variation in acceleration in the following way. We assume the acceleration of the  $N$ randomly distributed particles to be
 \begin{equation} \frac{{\rm d} \boldsymbol{V}^s}{{\rm d} t} = \boldsymbol{e}_1 + \boldsymbol{e}_{ran} \sigma_{\dot{V}} \mathcal{N}(0, 1). \end{equation}
Due to linear dependence, without loss of generality, the mean acceleration,  $\boldsymbol{e}_1$, of all the particles is taken to be a unit vector in the
 $x_1$ direction,
 $\boldsymbol{e}_{ran}$ is a random unit vector and
 $\mathcal {N}(0, 1)$ is a random number from the standard normal distribution. Therefore, the parameter
 $\sigma _{\dot {V}}$ is the standard deviation of particle acceleration variation. Here,
 $\sigma _{\dot {V}}$ is somewhat analogous to granular temperature, which measures particle velocity variation. This generalization recovers the limit of a rigidly accelerating cloud for
 $\sigma _{\dot {V}}=0$. A similar approach was taken in the modelling of the effect of particle-to-particle velocity variation on the quasi-steady force (Balachandar Reference Balachandar2020). It must be emphasized that the above expression is only to serve as a simple model of the statistical distribution of particle acceleration. In reality, the acceleration of individual particles will be correlated to the forces acting on them.
The parallel and perpendicular components of added mass coefficient were computed for all the  $N$ particles and the results are plotted as PDFs in figures 6 and 7, respectively for
 $C_{M\parallel }$ and
 $C_{M\perp }$. The results are presented for several different values of volume fraction and for
 $\sigma _{\dot {V}} = 0.0, 0.05, 0.1, 0.15$ and 0.2. Several points can be observed. Even at a very low volume fraction of 0.1 %, there is noticeable particle-to-particle added mass interaction, where the standard deviation of
 $C_{M\parallel }$ can be up to approximately 18 % of the mean and 50 % for
 $C_{M\perp }$. This is because of the fact that inter-particle distance scales as the cube root of volume fraction and as a result, inter-particle influence is important even at
 $\alpha = 0.001$. At low volume fractions, the PDFs of
 $C_{M\parallel }$ are substantially peaked. The PDFs change to normal-like distributions at higher volume fractions. The acceleration variation among the particles does not have a strong influence. However, at
 $\alpha = 0.4$ we observe that the added mass coefficient of the individual particles can substantially vary from around 0.25 to 0.75. By definition,
 $C_{M\perp }$ is non-negative and therefore its PDF is one sided. Again the effect of
 $\sigma _{\dot {V}}$ is not strong. Furthermore, the plots for
 $\alpha = 0.4$ show that the perpendicular component of the added mass coefficient can be as large as 50 % of the mean parallel component. Thus, the added mass force in the direction perpendicular to the direction of acceleration cannot be ignored in a random distribution of particles.
The PDFs of the parallel component of the added mass coefficient plotted as points. The empirical fit of the generalized normal distribution given in Appendix A is shown as lines. Here,  $\alpha$ is the particle volume fraction, and
 $\sigma _{\dot {V}}$ is the standard deviation of particle acceleration. Panels show (a)
 $\sigma _{\dot {V}}=0$, (b)
 $\sigma _{\dot {V}}=0.05$, (c)
 $\sigma _{\dot {V}}=0.1$, (d)
 $\sigma _{\dot {V}}=0.15$, (e)
 $\sigma _{\dot {V}}=0.2$.

The PDFs of the perpendicular component of the added mass coefficient plotted as points. The empirical fit of the Weibull distribution given in Appendix A is shown as lines. Here,  $\alpha$ is the particle volume fraction, and
 $\sigma _{\dot {V}}$ is the standard deviation of particle acceleration. Panels show (a)
 $\sigma _{\dot {V}}=0$, (b)
 $\sigma _{\dot {V}}=0.05$, (c)
 $\sigma _{\dot {V}}=0.1$, (d)
 $\sigma _{\dot {V}}=0.15$, (e)
 $\sigma _{\dot {V}}=0.2$.

Statistics of these PDFs are shown in figure 8, where the mean, standard deviation, skewness and kurtosis are reported for the parallel and perpendicular components at various values of particle volume fraction,  $\alpha$, and acceleration standard deviation,
 $\sigma _{\dot {V}}$. The points in figure 8 represent the data, while the lines represent the empirical fit to be presented in Appendix A. Clearly, figure 8(a) indicates that the mean is strongly a function of volume fraction and weakly a function of standard deviation in the state space considered. Notice that the parallel mean increases by roughly 7 % as the volume fraction increases to 0.4. Unlike the parallel component, which increases monotonically over the domain studied, the perpendicular mean reaches a maximum value at approximately
 $\alpha =0.27$ for
 $\sigma _{\dot {V}} = 0$. The standard deviation of the added mass coefficient is shown in figure 8(b), where the variance in the parallel component is shown to be significantly larger than the variance of the perpendicular component. Both components reach a maximum and begin to slowly decrease with increasing volume fraction for most
 $\sigma _{\dot V}$ cases. Since the perpendicular component is non-negative, it is non-normally distributed as exhibited by the non-zero skewness and a kurtosis much larger than 3, as shown in figure 8(c,d). The parallel component is also not normally distributed since it has significant kurtosis in the dilute limit, although it is much less skewed than the perpendicular component.
Statistics of parallel (drag-like) and perpendicular (lift-like) added mass coefficients as a function of volume fraction,  $\alpha$, and standard deviation of acceleration,
 $\sigma _{\dot {V}}$. The statistics reported are (a) mean, (b) standard deviation, (c) skewness and (d) kurtosis. The points plotted are the data, while the lines are from the functional fit given in Appendix A.

4.3. Statistics of parallel and perpendicular components
We now investigate the level of correlation between the fluctuations in the parallel and perpendicular added mass components. In other words, it is of interest to know if a particle's parallel added mass is higher than the average does it imply larger or smaller magnitude of perpendicular component. Scatter plots of the perpendicular magnitude vs the parallel component for all the particles are shown in figure 9(a–e) for the different volume fractions. The scatter plots suggest negligible correlation between the components. Quantitatively, figure 9(f) shows that the Pearson r (Asuero, Sayago & González Reference Asuero, Sayago and González2006) correlation coefficient is small. It should be noted that this lack of correlation between the parallel and perpendicular fluctuations of the added mass force is somewhat a surprise, since in the context of quasi-steady force, a sustained correlation was observed between the parallel and perpendicular fluctuations about the mean (Osnes et al. Reference Osnes, Vartdal, Khalloufi, Capecelatro and Balachandar2023).
(a–e) The perpendicular component of added mass,  $C_{M\perp }$, plotted as a function of the parallel component,
 $C_{M\parallel }$. Each point represents the components of a single particle. The correlation appears to be negligible. (f) Pearson r correlation coefficient. Panels show (a)
 $\alpha =0.001$, (b)
 $\alpha =0.05$, (c)
 $\alpha =0.1$, (d)
 $\alpha =0.2$, (e)
 $\alpha =0.4$, (f) correlation.

The distributions of the parallel and perpendicular components were found to be reasonably well approximated by the generalized normal distribution (Nadarajah Reference Nadarajah2005), and the Weibull distribution (Rinne Reference Rinne2008), respectively. In figure 6, the points indicate the computed results and the lines represent the generalized normal distribution fit derived from a numerical algorithm for error minimization. It appears that the PDF is well captured by the fit which accounts for the higher-order statistics reasonably well, as shown in figure 8(c,d). The details of the generalized normal distribution of  $C_{M\parallel })$ are given in Appendix A. Similarly, in figure 7 the perpendicular component of added mass coefficients obtained from the potential flow are displayed as symbols and the Weibull distribution fits are shown as lines for all values of
 $\alpha$, and
 $\sigma _{\dot {V}}$. Notice that the PDFs are for the magnitude and as a result distributions are non-negative. he details of the Weibull distribution of
 $C_{M\perp })$ are also given in Appendix A.
5. Hierarchical deterministic added mass model
In this section, we present a hierarchical deterministic model for predicting the added mass force on individual particles given self- and neighbour acceleration information. In this approach, we attempt to account for all the interactions between the particles in an  $N$-body system, and thereby deterministically evaluate the added mass force of a particle with precise knowledge of the neighbours’ positions and accelerations. Hierarchical representations of
 $N$-body interactions have been considered in statistical physics (Mazur & van Saarloos Reference Mazur and van Saarloos1982; Cisneros et al. Reference Cisneros, Wikfeldt, Ojamäe, Lu, Xu, Torabifard, Bartók, Csányi, Molinero and Paesani2016; Paesani Reference Paesani2016), in the modelling of quasi-steady force in the Stokes limit (Ma, Ye & Pan Reference Ma, Ye and Pan2022) and at finite Reynolds numbers (Akiki et al. Reference Akiki, Jackson and Balachandar2017; Seyed-Ahmadi & Wachs Reference Seyed-Ahmadi and Wachs2022; Siddani & Balachandar Reference Siddani and Balachandar2023). Applying this hierarchical expansion to the modelling of added mass force we obtain
 \begin{align} F^s_i &=
\underbrace{\rho {V \kern-8pt -}^s \frac{1}{2} \delta_{ij}
\dot{U}^s_j}_{Unary} + \underbrace{\rho {V \kern-8pt -}^s
\sum_{\substack{p=1\\ p\neq s}}^N (B^{A}_{ij}
(\boldsymbol{r}^{ps}) \dot{U}^s_j + B^{I}_{ij} (\boldsymbol{r}^{ps})
\dot{U}_j^p)}_{Binary} \nonumber\\ &\quad +\underbrace{\rho
{V \kern-8pt -}^s \sum_{\substack{p=1 \\ p\neq s}}^N
\sum_{\substack{r=1 \\ r\neq s,p}}^N (T^{A}_{ij}
(\boldsymbol{r}^{ps},\boldsymbol{r}^{rs}) \dot{U}^s_j + T^{I}_{ij}
(\boldsymbol{r}^{ps},\boldsymbol{r}^{rs}) \dot{U}_j^p)}_{Trinary} +
\ldots . \end{align}
In the above, the relative acceleration of the fluid seen by the particle is  $\dot {\boldsymbol{U}}^s = [\textrm {D}\boldsymbol{u}/\textrm {D} t]^s - \textrm {d}\boldsymbol{V}^s/\textrm {d} t$. In the binary term,
 ${\underline {\underline {B}}}^A$ is the binary contribution to added mass tensor of the
 $s$th particle due its own acceleration in the presence of the
 $p$th particle, which is located at a distance
 $\boldsymbol{r}^{ps} = \boldsymbol{\zeta }^p - \boldsymbol{\zeta }^s$. Whereas
 ${\underline {\underline {B}}}^I$ is the binary contribution to the induced mass tensor of the
 $s$th particle due to the acceleration of the
 $p$th particle. In the trinary term,
 ${\underline {\underline {T}}}^A$ is the trinary contribution to added mass tensor of the
 $s$th particle due to its own acceleration in the presence of the
 $p$th and
 $r$th particles, which are located at
 $\boldsymbol{r}^{ps}$ and
 $\boldsymbol{r}^{rs}$ from the
 $s$th particle. Similarly,
 ${\underline {\underline {T}}}^I$ is the trinary contribution to the induced mass tensor of the
 $s$th particle due to the acceleration of the
 $p$th particle, in the presence of the
 $r$th particle. Higher-order effects can be included in a hierarchical fashion to recover the perfect
 $N$-body solution. The above formulation when truncated to the binary term is the same as that employed by Béguin & Étienne (Reference Béguin and Étienne2016).
The above deterministic model involves a pre-processing step where the binary and trinary added mass and induced mass tensor maps are constructed and stored. The binary maps  ${\underline {\underline {B}}}^A$ and
 ${\underline {\underline {B}}}^I$ are tensors that are functions of the separation vector between a pair of particles. These maps are constructed by considering the added mass of only a pair of particles, in the absence of influence from any other particle. As will be shown below, using symmetry arguments the binary maps can be considerably reduced to only four scalar functions that are dependent on the separation distance.
The trinary maps can be constructed by systematically considering all possible configurations of three particles. From symmetry, the trinary maps  ${\underline {\underline {T}}}^A$ and
 ${\underline {\underline {T}}}^I$ can be simplified as well, although not to the same extent. During the implementation of the deterministic model, the added mass force of the
 $s$th particle is evaluated using the above formula by taking into account the binary and trinary effects of all the neighbours, by carrying out the summations. As will be seen below, the binary approximation provides an adequate description. Our investigation also shows that there is a slight improvement in prediction accuracy with the inclusion of the trinary terms. However, the improvement is often modest and limited to situations when neighbours are very close. Therefore, we will limit the primary discussion to the binary model. In Appendix B, we will discuss the trinary maps and their inclusion in three and four-particle systems.
5.1. Binary added mass tensor maps
The binary maps are constructed by considering a two-particle system, whose added mass influence has been extensively studied in the past (e.g. Helfinstine & Dalton Reference Helfinstine and Dalton1974; Béguin & Étienne Reference Béguin and Étienne2016). Without loss of generality, the first particle is placed at the origin and the second particle is some distance  $d$ along the
 $x_1$ axis from the first particle. We wish to consider the added mass effect on particle-1, due to the arbitrary acceleration of both particles 1 and 2. This problem considerably simplifies due to the linear and axisymmetric nature of the configuration about the
 $x_1$ axis. There are only four independent acceleration configurations that need to be considered, which can be suitably combined to construct the entire binary tensor maps. In all four configurations, the quantity of interest is the added mass coefficient of particle-1 located at the origin and the four configurations shown in figure 10(c–f) are as follows: (i) the change (from the standard value of 1/2) in
 $x_1$-component of added mass coefficient arising from the
 $x_1$-acceleration of particle-1 due to the added presence of particle-2 (
 $\mathcal {B}_{11}^{11}$), (ii) the change (from the standard value of 1/2) in the
 $x_2$-component added mass coefficient arising from the
 $x_2$-acceleration of particle-1 due to the added presence of particle-2 (
 $\mathcal {B}_{22}^{11}$), (iii)
 $x_1$ added (induced) mass coefficient due to
 $x_1$ acceleration of particle-2 (
 $\mathcal {B}_{11}^{12}$), (iv)
 $x_2$ added (induced) mass coefficient due to
 $x_2$ acceleration of particle-2 (
 $\mathcal {B}_{22}^{12}$). Here,
 $\underline {\underline {\mathcal {B}}}$ is the added mass tensor
 $\underline {\underline {B}}$ for the two-particle system with the
 $x_1$ axis aligned with the particle positions.
(a) Present results of the four binary configurations compared with the results of Béguin & Étienne (Reference Béguin and Étienne2016). The results of Béguin & Étienne (Reference Béguin and Étienne2016) are the points and the lines are the present results. (b) Results plotted on a log–log scale to show the decay rate of the induced mass contributions match the leading-order terms of the solution of Béguin & Étienne (Reference Béguin and Étienne2016). In all configurations, the reference (first) particle is at the origin,  $d$ is the separation distance, and
 $a$ is the particle radius. (c–f) Graphical representation of the meaning of the four curves showing directions of particle acceleration and force.

With these definitions, the first two configurations that yield  $\mathcal {B}_{11}^{11}$ and
 $\mathcal {B}_{22}^{11}$ are the added mass effects of a particle's acceleration on itself, with the influence of an inline or transverse neighbour, respectively. The latter two configurations that yield
 $\mathcal {B}_{11}^{12}$ and
 $\mathcal {B}_{22}^{12}$ are the induced mass effects of an inline or transverse neighbour's acceleration on a particle, respectively. It is important to note that the added mass force is only in the direction of acceleration, with zero force in the direction perpendicular to acceleration. These results are shown in figure 10(a). The agreement between the present results and those of Béguin & Étienne (Reference Béguin and Étienne2016) is excellent. At large separation distances, the added mass force reduces to the isolated particle case. The induced mass effect of a neighbour is stronger than its effect on added mass. The log–log plot of panel (b) shows that the largest components approach their asymptotic value as
 $1/d^3$.
The binary tensor maps given in (5.1) can be constructed with the four added mass coefficient functions in the following way:
 \begin{equation} \underline{\underline{B}}^A = \underline{\underline{Q}}^\top \underline{\underline{\mathcal{B}}}^{11} \underline{\underline{Q}}\quad \mbox{and}\quad \underline{\underline{B}}^I = \underline{\underline{Q}}^\top \underline{\underline{\mathcal{B}}}^{12} \underline{\underline{Q}}, \end{equation}
where
 \begin{equation}
\left.\begin{gathered}
\underline{\underline{\mathcal{B}}}^{11} = \begin{bmatrix}
\mathcal{B}_{11}^{11}({r}^{ps}) & 0 & 0\\ 0 &
\mathcal{B}_{22}^{11}({r}^{ps}) & 0 \\ 0 & 0 &
\mathcal{B}_{22}^{11}({r}^{ps}) \end{bmatrix} \\
{\mbox{and}}\quad \underline{\underline{\mathcal{B}}}^{12}
= \begin{bmatrix} \mathcal{B}_{11}^{12}({r}^{ps}) & 0 & 0\\
0 & \mathcal{B}_{22}^{12} ({r}^{ps}) & 0 \\ 0 & 0 &
\mathcal{B}_{22}^{12} ({r}^{ps}) \end{bmatrix}
\end{gathered}\right\},
\end{equation}
with  ${r}^{ps} = |\boldsymbol{r}^{ps}|$. Furthermore,
 ${\underline {\underline {Q}}}(\boldsymbol{r}^{ps})$ is the rotation matrix that will transform the laboratory
 $(x_1,x_2,x_3)$ coordinate centred about the
 $s$th particle so that the rotated
 $x_1$-coordinate aligns along the vector
 $\boldsymbol{r}^{ps}$. This rotation is applied in reverse in (5.2a,b). Due to the axisymmetric nature of the coefficient, there is flexibility in the choice of the rotated
 $x_2$ and
 $x_3$ coordinates. In the binary model, the
 $N^2$ binary tensors can then be combined to construct the added mass resistance matrix as follows:
 \begin{equation}
\tilde{R}_{3(s-1)+i,3(p-1)+j} = C_{ij}^{sp} = \begin{cases}
\dfrac{1}{2} \delta_{ij} + \displaystyle\sum_{\substack{r=1
\\ r\neq s}}^N B^{A}_{ij} (\boldsymbol{r}^{rs}) &
\mbox{if}\ p=s \\ B^{I}_{ij} (\boldsymbol{r}^{ps}) &
\mbox{if}\ p \ne s, \end{cases}
\end{equation}
where  $\tilde {R}$ indicates that it is the binary approximation to the exact added mass matrix.
The  $1/d^3$ decay rate of the transverse component in general leads to well-known non-absolute convergence and this will invalidate any finite level of truncation. Fortunately, faster convergence is achieved in isotropic distributions of neighbours, considered in this study. In an isotropic configuration, the average effect of all the neighbours located at a distance,
 $d$, from the reference particle is obtained by integrating the binary tensor
 \begin{equation} \oint \underline{\underline{Q}}^\top \underline{\underline{\mathcal{B}}}^{12} \underline{\underline{Q}} \,{\rm d} A = \frac{4 {\rm \pi}}{3}[\mathcal{B}_{11}^{12} (d/a, \alpha) + 2 \mathcal{B}_{22}^{12} (d/a, \alpha)] \underline{\underline{I}}, \end{equation}
over the interval  $2 \le d \le \infty$. In the above,
 $\oint ({\cdot })\,\textrm {d} A$ corresponds to an integral over all solid angles, which yields the trace of
 $\underline {\underline {\mathcal {B}}}^{12}$ (the quantity within the square brackets). As shown in figure 10(b), the leading-order behaviour of
 $\mathcal {B}_{22}^{12}$ is exactly half as that of
 $\mathcal {B}_{11}^{12}$ with an opposite sign. Therefore, to the leading order, the bracketed term decays more rapid as
 $1/d^6$. Thus, distant neighbours can be neglected once numerical convergence is obtained, since the isotropy essentially acts as implicit re-normalization.
5.2. Limitations of the simple binary model
This section evaluates the binary model by comparing its prediction against the exact results obtained from the  $N$-body potential flow. When evaluating the binary model, only neighbours with scaled centre-to-centre distance less than the maximum interaction distance,
 $\mathcal {R}_{max}$, were considered. Therefore
 $\mathcal {R}_{max}$ is a filter width for determining which neighbours are sufficiently near to contribute to perturbing the added mass force. Note that an important strength of the binary model is that it allows each particle to accelerate arbitrarily instead of being limited to the normal distribution as in the stochastic model. Furthermore, the binary model is not limited to the homogeneous random distribution of particles. It applies equally well to inhomogeneous and anisotropic particle distributions. Scatter plots of all the
 $9N^2$ elements of the resistance matrix entries predicted by the binary model,
 $\tilde {R}_{ij}$, against the exact values,
 $R_{ij}$, are shown in figures 11 and 12. In the model, for each particle, since the neighbours are limited to a distance
 $\mathcal {R}_{max}$, the induced mass coefficients of neighbours that are outside the distance are set to zero.
Off-diagonal ( $i \neq j$) entries in the exact resistance matrix
 $R_{ij}$ obtained from the complete potential flow solution plotted against their predicted values in the binary resistance matrix
 $\tilde {R}_{ij}$ as a function of volume fraction,
 $\alpha$, and maximum interaction distance,
 $\mathcal {R}_{max}/a$. Each point represents one entry in the resistance matrix. The vertical lines indicate the maximum and minimum exact values that have been neglected in the binary model due to a neighbour being beyond
 $\mathcal {R}_{max}$. Panels show (a)
 $\alpha =0.001$, (b)
 $\alpha =0.05$, (c)
 $\alpha =0.1$, (d)
 $\alpha =0.2$, (e)
 $\alpha =0.4$.

Diagonal ( $i= j$) entries in the exact resistance matrix
 $R_{ij}$ plotted against their predicted values in the binary resistance matrix
 $\tilde {R}_{ij}$ as a function of volume fraction,
 $\alpha$, and maximum interaction distance,
 $\mathcal {R}_{max}/a$. Each point represents one entry in the resistance matrix. The vertical lines indicate the maximum and minimum exact values that have been neglected in the binary model due to a neighbour being beyond
 $\mathcal {R}_{max}$. Panels show (a)
 $\alpha =0.001$, (b)
 $\alpha =0.05$, (c)
 $\alpha =0.1$, (d)
 $\alpha =0.2$, (e)
 $\alpha =0.4$.

When compared with a mean model, figures 11, and 12 show that the binary model, by using the microstructure information, is able to much better predict the added mass coefficients of individual particles. Close examination of figure 11 shows that the off-diagonal induced added mass terms in the resistance matrix are better predicted by the model. Notice, that a horizontal line of points along  $\tilde {R}_{ij}=0$ appears in each panel, with extreme values marked by vertical lines. These points represent contributions from neighbours that are beyond the maximum interaction distance
 $\mathcal {R}_{max}$ which are not considered in the binary model. The horizontal line of outliers vanishes as
 $\mathcal {R}_{max}\to \infty$ where all the neighbours are considered in the model. The horizontal extent of these outliers offers an estimation of the error incurred in limiting the neighbours. In most cases,
 $\mathcal {R}_{max}/a=6$ is observed to be sufficient to account for the neighbours.
The diagonal components are also well predicted, as displayed in figure 12, which correspond to the parallel self-acceleration component. Each neighbour perturbs the same diagonal block of added mass force components so that there is no horizontal line of outliers in the plot at  $\tilde {R}_{ij}=0.5$, analogous to the off-diagonal results. However, the effect of truncating the number of neighbours appears in a different manner. The binary model systematically underpredicts the self-acceleration added mass coefficient as the particle volume fraction increases. This is clearly seen in figure 12(e), where the point cloud has a negative offset. Also, the slope of the scatter plot is smaller than the 45
 $^\circ$ line, which indicates that the predicted standard deviation of added mass fluctuation is smaller than the exact variation. A similar effect can be seen for the off-diagonal components plotted in figure 11(e) for
 $\alpha = 0.4$.
With the increasing number of neighbours considered, the discrepancy decreases but does not vanish. The sustained discrepancy that remains even when considering a large number of neighbours arises from the neglected trinary and higher-order terms. The error in the binary model leads to the mis-prediction of the key statistics shown in figure 13. The binary model overpredicts the mean parallel component and underpredicts the mean perpendicular component at higher volume fraction values. Since the self-acceleration component is underpredicted (figure 12), this means that the error in the parallel mean is caused primarily by overprediction of the induced component, which becomes relevant when the system is assumed to accelerate rigidly together. Additionally, the standard deviation is underpredicted by the binary model although the higher-order statistics are relatively well captured.
Statistics of parallel (drag-like) and perpendicular (lift-like) added mass coefficients as a function of volume fraction,  $\alpha$. The system is assumed to accelerate rigidly such that
 $\sigma _{\dot {V}}=0$. The statistics reported are (a) mean, (b) standard deviation, (c) skewness and (d) kurtosis. The points plotted are the prediction by the binary model, while the lines represent the results from the
 $N$-body potential flow computation.

5.3. Corrected binary model
The important observation is that the binary model is able to clearly identify those particles that have higher or lower than the mean added mass force based on the location of the neighbours. This observation motivates a correction to the binary model with the twin goals of accurately capturing the mean and standard deviation of the distribution of added mass forces and minimizing the discrepancy in the prediction of the individual components of the resistance matrix.
The correction is developed to compensate for two sources of errors: that arising from neglecting trinary and higher-order interactions and from using a finite filter width  $\mathcal {R}_{max}$ that does not include all significant binary interactions. We will address the first source of error by accounting for the higher-order effects in a statistical sense. This will result in the reformulation of the four binary functions that appear in (5.2a,b) and (5.3a,b). Here, we seek a general formulation of the interaction of two accelerating particles while being surrounded by other particles, whose effects will be accounted for in a statistical sense with volume fraction
 $\alpha$ as the additional parameter. This will result in four pair-interaction functions
 $\mathcal {B}^{c11}_{11}(d,\alpha )$,
 $\mathcal {B}^{c11}_{22}(d,\alpha )$,
 $\mathcal {B}^{c12}_{11}(d,\alpha )$ and
 $\mathcal {B}^{c12}_{22}(d,\alpha )$, which are now functions of the separation distance
 $d$ and
 $\alpha$. Here, ‘
 $c$’ indicates that the function has been
 $\alpha$-corrected. The end members of these functions in the limit
 $\alpha \rightarrow 0$ are presented in figure 10(a).
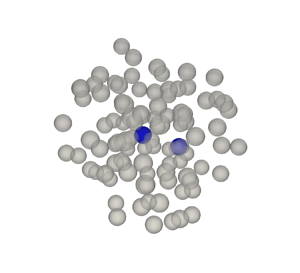
Consider the problem of two particles (denoted 1 and 2) separated by a distance  $d$ along
 $x_1$ and surrounded by other random distribution of particles with uniform probability corresponding to a volume fraction of
 $\alpha$. Given the two particles, there are infinite possibilities for the arrangement of the other particles. Two realizations are shown in figure 14. The velocity potential in realization
 $\omega$ satisfies
 \begin{equation} I_\omega(\boldsymbol{x)} \nabla^2 (\phi_\omega(\boldsymbol{x})) = 0, \end{equation}
where  $I_\omega ({\boldsymbol {x}})$ is the indicator function of that realization and it is unity in regions occupied by the fluid and zero inside particles. We then perform an ensemble average over all realizations similar to those shown in figure 14, which upon manipulation yields (Balachandar Reference Balachandar2024)
 \begin{equation} \nabla^2 (\langle I \rangle (\boldsymbol{x)} \langle \phi \rangle (\boldsymbol{x})) ={-}\nabla^2 (\langle I' \phi' \rangle (\boldsymbol{x})) + \langle \boldsymbol{u} \boldsymbol{\cdot} \boldsymbol{n} \rangle + \boldsymbol{\nabla}\boldsymbol{\cdot} \langle \phi \boldsymbol{n} \rangle = 0. \end{equation}
On the left-hand side,  $\langle I \rangle$ is the ensemble-averaged fluid volume fraction, given the position of the two particles denoted as 1 and 2, and the average volume fraction. This can be shown to be related to the three-particle radial distribution function (Torquato & Haslach Jr Reference Torquato and Haslach2002). On the right-hand side,
 $I'$ and
 $\phi '$ are perturbations away from the mean. The last two terms on the right-hand side are interface terms that are non-zero only on the surface of the particles. Here,
 $\boldsymbol {u} \boldsymbol {\cdot } \boldsymbol {n}$ is the particle velocity along the surface normal
 $\boldsymbol {n}$. Once computed,
 $\langle \phi \rangle$ can be used to calculate the ensemble-averaged velocity and using the Bernoulli equation the ensemble-averaged pressure, which can be integrated to obtain the functions
 $\mathcal {B}^{c11}_{11}(d,\alpha )$,
 $\mathcal {B}^{c11}_{22}(d,\alpha )$,
 $\mathcal {B}^{c12}_{11}(d,\alpha )$ and
 $\mathcal {B}^{c12}_{22}(d,\alpha )$.
Two realizations ( $\omega =1$, and
 $2$), where two particles are held fixed in their position and the location of all other neighbours in blue are randomly varied to follow uniform distribution at the desired volume fraction. Panels show (a)
 $\omega =1$, (b)
 $\omega =2$.

However, it is not easy to solve (5.7) because of the unclosed terms on the right-hand side. Instead, here we obtain the  $\alpha$-corrected functions in the following way using the potential flow we earlier computed for
 $N=1000$ particles. A system of
 $N$ particles randomly distributed in a triply periodic box consists of
 $N(N-1)/2$ unique particle pairs, with each pair surrounded by a unique distribution of neighbours. The distance between the particles within a pair varies between
 $d=2a$ to
 $d = ({\rm \pi} N/(6\alpha ))^{1/3} a$. For each particle pair, by rotating the coordinates so that the particle pair lies along the
 $x_1$-axis, the computed potential flow can be converted to the desired solution of (5.6) for an individual realization of the particle pair. Furthermore, the method of images used to calculate the potential flow allows for the precise extraction of the following two quantities.
Added mass perturbation: for each pair, we seek the potential flow generated at particle-1 because of particle-1's acceleration. Therefore, we restrict to only those doublets whose associated original doublet is that of particle-1 and as a result, their contributions multiply particle-1's acceleration. Furthermore, we want to focus only on those doublets that account for direct modification by particle-2, but in the presence of indirect influence of all other particles. This restriction is accomplished with the following two conditions: (i) the doublet is located within particle-2 or (ii) the doublet is located within particle-1, but its most recent reflection is from particle-2. The added mass tensor of particle-1 evaluated in this manner using (2.17) with the restricted set of doublets. The tensor is then rotated so that the line separating the two particles is oriented along  $x_1$. The rotated added mass tensor will not be perfectly axisymmetric due to the complex indirect interaction of other randomly distributed particles. But the (1,1) element of the tensor can be interpreted as added mass perturbation of
 $x_1$-force of particle-1 due to its
 $x_1$-acceleration due to the direct influence of particle-2. The (2,2) and (3,3) elements of the tensor can be interpreted as the perturbation of particle-1's perpendicular added mass force due to its perpendicular acceleration due to the direct influence of particle-2. They will be denoted as
 $B^{11}_{11}$ and
 $B^{11}_{22}$.
Scatter plots of  $B^{11}_{11}$ and
 $B^{11}_{22}$ as a function of
 $d$ for all particle pair combinations are presented in figure 15(a,b). In the limit of
 $\alpha \rightarrow 0$ (i.e. in the absence of all other particles) the data points lie on a single curve corresponding to that of two isolated particles presented in figure 10. For
 $\alpha \ne 0$, the data points do not fall on a line due to randomness in the distribution of other particles. By taking an ensemble average over all possible arrangements of the other particles we define
 \begin{equation} \mathcal{B}^{c11}_{11} = \langle B^{11}_{11} \rangle \quad \mbox{and} \quad \mathcal{B}^{c11}_{22} = \langle B^{11}_{22} \rangle . \end{equation}
The curve fits representing these ensemble averages are presented in Appendix C and also shown as lines in figure 15. The  $\alpha$ dependence appears to be quite small and hard to discern in the plot. Nevertheless, we observe this small volume fraction correction applies to all binary interactions with neighbours and therefore is necessary to accurately capture the mean binary perturbation.
Binary model as a function of distance,  $d$, and volume fraction,
 $\alpha$, extracted from the exact resistance matrices. The points are the values extracted from the method of images and the lines are empirical curve fits to these data. The panels include the following variables: (a)
 $B^{11}_{11}$, (b)
 $B^{11}_{22}$, (c)
 $B^{12}_{11}$ and (d)
 $B^{12}_{22}$.

Induced mass perturbation: for each pair, we now seek the potential flow generated at particle-1 because of particle-2's acceleration. Therefore we restrict to only those doublets whose associated original doublet is that of particle-2. No further restrictions are necessary. The induced mass tensor of particle-1 is evaluated using (2.17) with the restricted set of doublets. The tensor is then rotated so that the line separating the two particles is oriented along  $x_1$. The rotated tensor is again not perfectly axisymmetric. The (1,1) element can be interpreted as the induced mass perturbation of
 $x_1$-force of particle-1 due to the
 $x_1$-acceleration of particle-2. The (2,2) and (3,3) elements can be interpreted as the perturbation of particle-1's perpendicular added mass force due to the perpendicular acceleration of particle-2. They will be denoted as
 $B^{12}_{11}$ and
 $B^{12}_{22}$.
Scatter plots of  $B^{12}_{11}$ and
 $B^{12}_{22}$ as a function of
 $d$ for all particle pair combinations is presented in figure 15(c,d). In the limit of
 $\alpha \rightarrow 0$, the data points lie on a curve corresponding to that of two isolated particles presented in figure 10. For
 $\alpha \ne 0$, the data points exhibit a scatter due to randomness in the distribution of other particles. Taking an ensemble average over all possible arrangements of the other particles we define
 \begin{equation} \mathcal{B}^{c12}_{11} = \langle B^{12}_{11} \rangle \quad \mbox{and} \quad \mathcal{B}^{c12}_{22} = \langle B^{12}_{22} \rangle. \end{equation}
The curve fits representing these ensemble averages are presented in Appendix C and also shown as lines in figure 15. In these plots, the  $\alpha$-dependence can be readily observed. It should be noted that these
 $\alpha$-dependent pair-interaction functions also depend on the nature of particle distribution. Here, we have obtained them for a uniform random distribution of particles that obey the canonical
 $3\varGamma$ Voronoi volume distribution.
5.4. Improved accuracy of the  $\alpha$-corrected binary model

The four  $\alpha$-corrected binary interaction functions given in (C1), (C2), (C3) and (C4) can now be used in (5.2a,b) and (5.3a,b) to obtain the corrected added and induced mass tensors
 $\underline {\underline {B}}^{cA}$ and
 $\underline {\underline {B}}^{cI}$. This can then be substituted in (5.4) to evaluate the added mass matrix of a random distribution of particles given their position and acceleration. Let us denote the resulting
 $\alpha$-corrected binary added mass matrix as
 $\underline {\underline {\tilde {R}}}^c$. In this subsection, we will assume that the corrected binary model is computed to sufficient accuracy and that the only error committed is in the neglect of trinary and higher-order effects. For this, we observe it is sufficient to consider all the neighbours within a sphere of radius
 $\mathcal {R}_{max} = 10a$.
The  $9N^2$ elements of the added mass matrix
 $\underline {\underline {\tilde {R}}}^c$ were calculated with the corrected binary model. Figures 16 and 17 show the scatter plot of the off-diagonal and diagonal block elements of the
 $\alpha$-corrected model plotted against the exact results of the potential flow solution. The corrected binary model is able to quite accurately predict all the elements of the exact added mass matrix. Especially, the underprediction of both the mean and standard deviation at higher values of
 $\alpha$ has been corrected. In addition to better capturing the individual elements of the resistance matrix, figure 18 shows that the corrected model is able to reproduce the added mass force statistics of a rigidly accelerating cloud. The higher-order moments (not shown) are also reasonably well produced.
Off-diagonal ( $i \neq j$) entries of the resistance matrix predicted by the corrected binary model,
 $\tilde {R}^c_{ij}$, plotted against the entries of the exact resistance matrix,
 $R_{ij}$, as a function of volume fraction,
 $\alpha$, and maximum interaction distance,
 $\mathcal {R}_{max}/a$. Each point represents one entry in the resistance matrix. The vertical lines indicate the maximum and minimum exact values that have been neglected in the binary model due to a neighbour being beyond
 $\mathcal {R}_{max}$. The binary model correction is calculated using the analytic expression for
 $g(r)$ provided by Trokhymchuk et al. (Reference Trokhymchuk, Nezbeda, Jirsák and Henderson2005). Panels show (a)
 $\alpha =0.001$, (b)
 $\alpha =0.05$, (c)
 $\alpha =0.1$, (d)
 $\alpha =0.2$, (e)
 $\alpha =0.4$.

Diagonal ( $i= j$) entries of the resistance matrix predicted by the corrected binary model,
 $\tilde {R}^c_{ij}$, plotted against the entries of the exact resistance matrix,
 $R_{ij}$, as a function of volume fraction,
 $\alpha$, and maximum interaction distance,
 $\mathcal {R}_{max}/a$. Each point represents one entry in the resistance matrix. The vertical lines indicate the maximum and minimum exact values that have been neglected in the binary model due to a neighbour being beyond
 $\mathcal {R}_{max}$. The binary model correction is calculated using the analytic expression for
 $g(r)$ provided by Trokhymchuk et al. (Reference Trokhymchuk, Nezbeda, Jirsák and Henderson2005). Panels show (a)
 $\alpha =0.001$, (b)
 $\alpha =0.05$, (c)
 $\alpha =0.1$, (d)
 $\alpha =0.2$, (e)
 $\alpha =0.4$.

Statistics of parallel (drag-like) and perpendicular (lift-like) added mass coefficients as a function of volume fraction,  $\alpha$. The system is assumed to accelerate rigidly such that
 $\sigma _{\dot {V}}=0$. The statistics reported are (a) mean, and (b) standard deviation. The points plotted are the prediction by the corrected binary model, while the lines represent the results from the
 $N$-body potential flow computation. This version of the corrected model used the relation of Trokhymchuk et al. (Reference Trokhymchuk, Nezbeda, Jirsák and Henderson2005) to calculate
 $g(r)$, as explained in § 5.5.

5.5. Corrected binary model for limited nearby neighbours
On average, a neighbourhood of  $\mathcal {R}_{max} = 10a$ includes roughly 400 neighbours for
 $\alpha =0.4$. To reduce the substantial computational cost of calculating the binary effect of a large number of neighbours, it is desirable to limit the value of
 $\mathcal {R}_{max}$. Tests reveal that the accuracy of the
 $\alpha$-corrected model suffers substantially as
 $\mathcal {R}_{max}$ falls much below
 $10a$. In this section, we present a simple approach that allows for the
 $\alpha$-corrected model to perform accurately even for smaller values of
 $\mathcal {R}_{max}$ without significant loss of accuracy. In this approach, the neighbours will be separated into near-field neighbours whose centres are within the annular region
 $2a \le |\boldsymbol{r}^{p,s}| < \mathcal {R}_{max}$ and far-field neighbours whose centres are within the annular region
 $\mathcal {R}_{max} \le |\boldsymbol{r}^{p,s}|$. The near-field influence will be calculated deterministically with the precise knowledge of all neighbours that lie within a sphere of radius
 $\mathcal {R}_{max}$ using the expression given (5.4). The far-field influence must then be calculated in a statistical sense without the precise knowledge of the outlying neighbours.
According to the binary model, the far-field neighbours’ influence on particle-1 can be separated into (i) the added mass perturbation that gets multiplied by particle-1's acceleration and (ii) the induced mass perturbation that gets multiplied by the acceleration of the far-field particles. Without the knowledge of the exact locations of the far-field neighbours, we assume the particles to be uniformly distributed outside the sphere of radius  $\mathcal {R}_{max}$. With this assumption, the added mass and induced mass effects on particle-1 can be expressed as
 \begin{equation} \underline{\underline{I}}^A = \underline{\underline{I}} \int_{r/a=\mathcal{R}_{max}/a}^\infty (r/a)^2 \alpha g(r/a) [\mathcal{B}_{11}^{c11} (r/a, \alpha) + 2 \mathcal{B}_{22}^{c11} (r/a, \alpha)]\,{\rm d}(r/a), \end{equation}
and
 \begin{equation} \underline{\underline{I}}^I = \underline{\underline{I}} \int_{r/a=\mathcal{R}_{max}/a}^\infty (r/a)^2 \alpha g(r/a) [\mathcal{B}_{11}^{c12} (r/a, \alpha) + 2 \mathcal{B}_{22}^{c12} (r/a, \alpha)]\,{\rm d}(r/a), \end{equation}
where  $\underline {\underline {I}}$ is the identity matrix and
 $g(r/a)$ is the radial distribution function that measures the relative probability of finding a neighbour at a radial distance of
 $r$ from particle-1 compared with the uniform probability. In the above, we have used the relations
 \begin{equation} \left.\begin{gathered} \oint_{S_\mathcal{R}} \underline{\underline{Q}}^\top \underline{\underline{\mathcal{B}}}^{c11} \underline{\underline{Q}} \,{\rm d} A = \frac{4 {\rm \pi}}{3}[\mathcal{B}_{11}^{c11} (r/a, \alpha) + 2 \mathcal{B}_{22}^{c11} (r/a, \alpha)] \underline{\underline{I}} \\ \oint_{S_\mathcal{R}} \underline{\underline{Q}}^\top \underline{\underline{\mathcal{B}}}^{c12} \underline{\underline{Q}} {\rm d} A = \frac{4 {\rm \pi}}{3}[\mathcal{B}_{11}^{c12} (r/a, \alpha) + 2 \mathcal{B}_{22}^{c12} (r/a, \alpha)] \underline{\underline{I}},\end{gathered}\right\} \end{equation}
where the integrations are over a surface of radius  $r$. In figure 10 it was noted that, while
 $\underline {\underline {\mathcal {B}}}^{c11}$ decayed faster, the induced mass effect
 $\underline {\underline {\mathcal {B}}}^{c12}$ decayed only as
 $1/r^3$. Nevertheless, as discussed previously in § 5.1, the leading-order terms in the induced added mass integral cancel exactly so that the integral converges.
In the case of  $\underline {\underline {I}}^A$, it will be multiplied by the acceleration vector of the particle whose added mass force is being evaluated and therefore can be combined with the diagonal blocks of the added mass matrix. In contrast,
 $\underline {\underline {I}}^I$ must be multiplied by the average acceleration of the far-field particles, which is not readily available to the
 $\alpha$-corrected binary model and therefore must be approximated. There are several modelling choices and the best option will depend on the problem. For example, the average acceleration of the far-field particles may be simply taken to be that of the particle whose added mass force is being evaluated. In which case,
 $\underline {\underline {I}}^I$ can also be combined with the diagonal blocks of the added mass matrix. An alternate model will be to assume the average acceleration of the far-field particles to the average of all the near-field neighbours. In this latter approximation
 $\underline {\underline {I}}^I$ will be equally distributed to the blocks that are associated with the near-field neighbours. Here, we will pursue this latter modelling choice and the resulting
 $\alpha$-corrected binary model of the added mass matrix can be expressed as
 \begin{equation} \tilde{R}_{3(s-1)+i,3(p-1)+j}^c = \begin{cases} \dfrac{1}{2} \delta_{ij} + \displaystyle\sum_{\substack{r=1 \\ r\neq s}}^{N_R} B^{cA}_{ij} (\boldsymbol{r}^{rs}) + {I}^A_{ij} & \mbox{if}\ p=s \\ B^{cI}_{ij} (\boldsymbol{r}^{ps}) + \dfrac{1}{N_R} {I}^I_{ij} & \mbox{if}\ p \ne s, \end{cases} \end{equation}
where  $N_R$ is the number of neighbours within a radius of
 $\mathcal {R}_{max}$, and
 \begin{equation} \underline{\underline{B}}^{cA} = \underline{\underline{Q}}^\top \underline{\underline{\mathcal{B}}}^{c11} \underline{\underline{Q}}\quad \mbox{and}\quad \underline{\underline{B}}^{cI} = \underline{\underline{Q}}^\top \underline{\underline{\mathcal{B}}}^{c12} \underline{\underline{Q}}. \end{equation}
Using the analytical expression for  $g(r)$ derived by Trokhymchuk et al. (Reference Trokhymchuk, Nezbeda, Jirsák and Henderson2005) appropriate for uniform distribution of hard spheres,
 $\textrm {tr}\{{I}^A\}/3$ and
 $\textrm {tr}\{{I}^I\}/3$ were evaluated by computing the integrals given in (5.10) and (5.11) and plotted in figure 19. Also shown are analytical expressions obtained assuming
 $g(r)=1$ (see Appendix D). As expected, both
 $\textrm {tr}\{{I}^A\}/3$ and
 $\textrm {tr}\{{I}^I\}/3$ decay with increasing
 $\mathcal {R}_{max}$ and are not needed for
 $\mathcal {R}_{max} \gtrapprox 8a$. Furthermore, as long as
 $\mathcal {R}_{max} \gtrapprox 3.5a$ the analytic expressions given in Appendix D that assume
 $g(r) = 1$ are sufficient.
Integral corrections for the mean added mass force evaluated using the analytical approximation assuming  $g(r)=1$ as outlined in Appendix D compared with the numerically integrated values using
 $g(r)$ from Trokhymchuk et al. (Reference Trokhymchuk, Nezbeda, Jirsák and Henderson2005). The numerically integrated values are shown as points and the approximate analytic values are shown as lines. The panels show (a) the self-acceleration component, and (b) the induced component.

The resistance matrix of the  $\alpha$-corrected binary model
 $\tilde {R}^c_{ij}$ was computed for several values for
 $\mathcal {R}_{max} < 10$ using (5.13). These results are also presented in figures 16 and 17 for the diagonal and off-diagonal terms, which were earlier discussed in the limit
 $\mathcal {R}_{max} = 10$ when the model did not need to include the additional contributions from
 ${I}^A$ and
 ${I}^I$. With decreasing
 $\mathcal {R}_{max}$, the model performance slightly decreases, nevertheless, the performance is quite reasonable for all values considered, especially when compared with that of the uncorrected model results presented in figures 11 and 12. The mean and standard deviation of parallel and perpendicular components of added mass force on a random distribution of particles subjected to uniform acceleration was computed with (5.13) and presented in figure 18 for different values of
 $\mathcal {R}_{max}$. It is quite clear that the
 $\alpha$-corrected model with the inclusion of statistical contribution of far-field neighbours is quite accurate, except perhaps for
 $\mathcal {R}_{max}=3a$ and large volume fraction values. It should be pointed out for
 $\mathcal {R}_{max} \gtrapprox 3.5a$ the analytical expressions given in Appendix D obtained using
 $g(r) = 1$ are quite accurate.
As a further test of the model, the maximum and r.m.s. errors are shown in figure 20 to quantify the error in the  $\alpha$-corrected model. At each volume fraction, ten realizations are considered and the average value of the different error metrics defined in (3.1a,b) are plotted along with their extreme values as error bars. Focusing on the maximum error presented in figure 20(a), we observe that the error increases with volume fraction. This can be expected since more particles will be close to one another at higher volume fractions thereby making the specifics of trinary and higher-order terms more significant than their average effects. Furthermore, increasing
 $\mathcal {R}_{max}/a$ beyond 6 does not yield any additional decrease in maximum error except at very small volume fractions where the maximum error is already low. The maximum error seems to be under 10 % for all the selected interaction distances. Despite this invariance of the maximum error with changing
 $\mathcal {R}_{max}$, figure 20(b) indicates that there is an improvement in the r.m.s. error with increasing
 $\mathcal {R}_{max}$. Here, we notice a consistent improvement in error with increasing interaction distance. As expected, the r.m.s. error is consistently small which indicates that most of the terms in the resistance matrix are well predicted by the
 $\alpha$-corrected binary model.
Maximum (a) and r.m.s. (b) error for predicting a 1000 particle system using the corrected binary model. The points plotted are the mean error for 10 realizations and the error bars indicate the maximum and minimum errors for the 10 realizations. Here,  $\mathcal {R}_{max}/a$ is the maximum radius within which neighbouring particles were considered for evaluating the binary model. The relation for the radial distribution function,
 $g(r)$, provided by Trokhymchuk et al. (Reference Trokhymchuk, Nezbeda, Jirsák and Henderson2005) was used.

6. Conclusion
The accurate prediction of dispersed multiphase flows requires modelling of closure terms that couple the exchange of conserved quantities between the continuous and dispersed phases. The momentum transfer is determined by the force the fluid exerts on each particle and the equal and opposite force each particle exerts on the fluid. In flows where the particle's density is comparable to the fluid density or under conditions of rapid relative acceleration between the phases, the unsteady added mass force can become a significant contributor to the overall momentum exchange. The added mass force of an isolated particle is well known, but the added mass force is modified substantially in the presence of neighbouring particles (Zuber Reference Zuber1964; Helfinstine & Dalton Reference Helfinstine and Dalton1974; Biesheuvel & Spoelstra Reference Biesheuvel and Spoelstra1989; Sangani et al. Reference Sangani, Zhang and Prosperetti1991; Cai & Wallis Reference Cai and Wallis1994). Predicting this neighbour influence is the focus of this work.
We used the method of images to solve for the potential flow over an arbitrarily accelerating cloud of particles to extract the complete added mass resistance matrix for several realizations of random particle distributions of varying volume fractions. Using this method, we have obtained the following answers to the questions we proposed in the introduction: (i) the mean streamwise added mass coefficient of a random distribution of spherical particles is higher than the value of  $1/2$ for an isolated particle and the difference increases with increasing volume fraction. (ii) The level of particle-to-particle variation in the value of streamwise added mass coefficient is significant with a standard deviation of nearly 20 % of the mean. (iii) Although the mean transverse added mass force of a random distribution of particles is zero, due to the influence of the unique distribution of neighbours, each particle experiences a substantial added mass force in the direction perpendicular to the direction of acceleration. The magnitude of this lift-like perpendicular added mass force can be as large as 50 % of the streamwise component. (iv) Statistical results on the PDF of both the parallel and perpendicular components of the added mass force are presented. (v) The effect of particle-to-particle variation in their relative acceleration with respect to the surrounding fluid was considered and found to be small.
We formulated a binary superposition model that is able to deterministically predict the complete resistance matrix of the added mass coefficients, given the random spatial distribution of all the particles within the cloud. This hierarchical model has clear advantages to mean models. First and foremost, it is able to accurately predict the added mass force of each and every particle given the particle's acceleration as well as the position and acceleration of all the neighbours. Two different influences of the neighbours are accounted for in the model: (i) each neighbour modifies the added mass coefficient of a particle that relates its force to its acceleration and (ii) the acceleration of each neighbour contributes to the induced mass force on the particle. The deterministic model is able to account for both these influences accurately and thereby clearly identify those particles whose added mass coefficients are higher or lower than the average. Second, the deterministic hierarchical model can be applied to any distribution of particles (not restricted to uniform random distribution) with any kind of acceleration variation among the particles, unlike the stochastic model which needs to be built for specific distributions of particles and their acceleration variation.
The simplest binary model involves four binary functions that encapsulate the potential flow interaction of a pair of independently accelerating particles embedded in an unbounded flow. For two particles separated along the  $x_1$-axis these binary interactions are (i) the
 $x_1$-component of the added mass coefficient arising from the
 $x_1$-acceleration of particle-1 in the presence of particle-2, (ii) the
 $x_2$-component of the added mass coefficient arising from the
 $x_2$-acceleration of particle-1 in the presence of particle-2, (iii) the
 $x_1$ induced mass coefficient of particle-1 due to the
 $x_1$ acceleration of particle-2, (iv) the
 $x_2$ induced mass coefficient of particle-1 due to the
 $x_2$ acceleration of particle-2. The binary model built upon these four isolated pair-interaction functions was observed to systematically underpredict the added mass tensors of the individual particles as well as the resulting ensemble average.
A volume fraction corrected binary model was then developed to systematically incorporate the trinary and higher-order effects statistically. This was accomplished by obtaining the four binary interaction functions for a pair of independently accelerating particles, now in the statistical presence of all other particles, encoded through the particle volume fraction. As a result, the four binary interaction functions are now dependent on both the separation distance between the particle pair and the volume fraction of the distribution of particles in which the pair is immersed in. The volume fraction corrected binary model is observed to capture the correct mean and standard deviation for the entire particle cloud as an emergent phenomenon obtained by including the trinary and higher-order interactions at the microscale. This correction arises naturally from the method of images since the higher-order effects can be precisely extracted by grouping terms in the series solution.
The volume fraction corrected binary model accurately predicted the added force on individual particles within a random distribution even at large volume fraction values of about 0.4, provided the influence of all the neighbours within a distance of 10 particle radii are taken into account. However, at a volume fraction of  $\alpha = 0.4$ this requires that the influence of approximately 400 neighbours be included in the deterministic binary model, and in practical implementations of the corrected binary model, this can place a substantial computational burden. Here, we present an additional improvement with which the binary model can be employed only with a limited number of neighbours. In this approximate approach, the
 $\alpha$-corrected binary model is deterministically applied only for particles in the immediate neighbourhood of the reference particle on which the force is desired and stochastically applied for neighbours that are outside the immediate neighbourhood using the radial distribution function.
Finally, the volume fraction corrected binary model was shown to be able to capture the statistics of added mass force distribution well and predict the added mass of individual particles accurately. This work has focused primarily on random particle distributions that conform to the 3 $\varGamma$ distribution; however, it is known that the spatial distribution of particles has a significant effect on the added mass force (Spelt & Sangani Reference Spelt and Sangani1997). The ability of the volume fraction corrected binary model to generalize to other particle distributions must be investigated in the future as has been examined for the quasi-steady force (Siddani et al. Reference Siddani, Balachandar, Zhou and Subramaniam2024). The volume fraction correction is the only part of the present hierarchical model formulation that directly considers the spatial distribution of particles to be 3
 $\varGamma$. In contrast, the uncorrected binary model is agnostic to the nature of distribution of neighbours. Thus, the quantitative extent to which the volume fraction correction generalizes to non-3
 $\varGamma$ distributions is of significant importance and is dependent on the robustness of the approach of providing a statistical correction for trinary and higher-order terms. Also, the present work has only considered monodisperse particles. The added mass of polydisperse distributions must also be considered in a similar manner.
Funding
This work was supported by the U.S. Department of Energy, Stewardship Science Academic Alliances Program, under contract no. DE-NA-0004061. This work was also supported by the U.S. Department of Energy via Lawrence Livermore National Laboratory under contract no. DE-AC52-07NA27344, LLNL-JRNL-864120.
Declaration of interests
The authors report no conflict of interest.
Appendix A. The PDFs of $C_{M\parallel }$ and $C_{M\perp }$


The generalized normal distribution of the parallel component of added mass is defined by
 \begin{equation} {PDF}(C_{M\parallel}) = \frac{s_\parallel}{2 \sigma_\parallel \varGamma(1/s_\parallel)} \exp\left[-\left|\frac{C_{M_\parallel} - \mu_\parallel}{\sigma_\parallel}\right|^{s_\parallel}\right]. \end{equation}
We estimate the parameters of the PDF and their variation as a function of  $\alpha$ and
 $\sigma _{\dot {V}}$ as
 $$\begin{gather} \mu_\parallel= \frac{1}{2} - 0.1938 \alpha (\alpha - 0.7718) + 0.0874 \alpha^3 + 0.05 \alpha \sigma_{\dot{V}}^2, \end{gather}$$
 $$\begin{gather}\sigma_\parallel= \frac{-1.7714 \alpha \left( \alpha - \dfrac{\rm \pi}{3 \sqrt{2}} \right)}{-3.6936 \alpha^2 + 3.7962 \alpha + 1} \left[ \frac{1}{2} \tanh(130 \alpha - 1.212) + \frac{1}{2}\right] + 3 \alpha^2 \sigma_{\dot{V}}^2. \end{gather}$$
 $$\begin{gather}s_\parallel= \frac{-11.8550 \alpha^2 + 43.5394 \alpha + 0.4003}{16.9664 \alpha + 1}. \end{gather}$$
The above fit for the mean added mass coefficient differs from that of Béguin & Étienne (Reference Béguin and Étienne2016). As indicated in figure 4, the difference is possibly due to differences in the number and distribution of neighbours.
The Weibull distribution for the perpendicular component of added mass is defined as (Rinne Reference Rinne2008)
 \begin{equation} {PDF}(C_{M\perp}) =
\begin{cases} \dfrac{k_\perp}{\lambda_\perp}
\left(\dfrac{C_{M_\perp}}{\lambda_\perp}\right)^{k_\perp{-}1}
\exp\left[-\left(\dfrac{C_{M\perp}}{\lambda_\perp}\right)^{k_\perp}\right]
& C_{M_\perp} \geq 0 \\ 0 & \mbox{otherwise}. \end{cases}
\end{equation}
The empirical fits for the parameters are
 $$\begin{gather} \lambda_\perp= \frac{-0.83024 \alpha^2 + 1.7066 \alpha + 3.2960\times 10^{{-}3}}{10.6662\alpha + 1} + 1.1 \alpha \sigma_{\dot{V}}^2, \end{gather}$$
 $$\begin{gather}k_\perp= \frac{3.5676 \alpha^2 + 65.9973\alpha + 0.7060}{\alpha^2 + 31.0916 \alpha + 1} - 1.2 \alpha \sigma_{\dot{V}}. \end{gather}$$
Appendix B. Trinary and higher-order interactions
B.1. Three-particle case
The importance of trinary and other higher-order terms in the expansion of the full  $N$-body interaction problem may be examined in simpler geometric configurations. For instance, consider a three-particle system where the first particle is at the origin, the second particle is located on the
 $x_1$ axis and the third particle is allowed to be placed arbitrarily in the
 $x_3=0$ plane without loss of generality. In this configuration, a resistance matrix may be formulated for each possible position of the third particle in the plane. The
 $9\times 9$ resistance matrices form 81 maps for each configuration of the first two particles. These maps are the necessary data required to construct the trinary model. If the particles are assumed to accelerate rigidly, the problem can be simplified using (2.16) such that
 \begin{equation} F^{AM,s}_i ={-}\rho {V \kern-8pt -}^s \frac{{\rm d} V_j}{{\rm d} t} \sum_{p=1}^N C^{sp}_{ij} ={-}\rho {V \kern-8pt -}^s \frac{\partial V_j}{{\rm d} t} \hat{C}^{s}_{ij}. \end{equation}
Here, the acceleration of every particle is  $\textrm {d} \boldsymbol{V} / \textrm {d} t$, and the tensor
 $\hat {C}^s_{ij}$ linearly transforms this acceleration to the force on the
 $s$th particle. Therefore, the rigidly accelerating three-particle system may be reduced to 9 maps of the components of
 $\hat {C}^s_{ij}$ at each value of the separation distance of the first two particles. Figure 21 shows these maps for the case where
 $(\zeta _1^2 - \zeta _1^1)/a=2$ such that particles 1 and 2 are touching. Figure 22 shows the maps for
 $(\zeta _1^2 - \zeta _1^1)/a=5.0$.
Trinary maps for rigidly accelerating particles. The colour indicates the value of the tensor entry for the third particle placed at the position of that colour. Here,  $(\zeta _1^2 - \zeta _1^1)/a=2$.

Trinary maps for rigidly accelerating particles. The colour indicates the value of the tensor entry for the third particle placed at the position of that colour. Here,  $(\zeta _1^2 - \zeta _1^1)/a=2.5$.

The maps in figures 21 and 22 exhibit predictable symmetry. For instance, all the non-diagonal terms corresponding to either  $x_3$ (or out-of-plane) force or acceleration are identically zero. Additionally, the lift-like off-diagonal components are antisymmetric across the vertical and horizontal centrelines. Interestingly, the
 $12$ and
 $21$ components are similar in appearance but not identical. As expected, in the far field, the diagonal drag-like terms approach
 $1/2$ whereas the non-diagonal lift-like terms approach 0.
The importance of the trinary terms may be ascertained by applying the binary model to the three-particle system and comparing the results with the exact force computed with the  $N$-body potential flow method. The difference is quantified by evaluating the maximum and r.m.s. error of the resistance matrix, which are summarized in figures 23 and 24. From figure 23, we observe that the maximum error is typically near 40 % when all three particles are nearly touching thereby indicating that trinary terms can become important in such specific situations. However, as the separation distance increases, the error rapidly approaches a much lower value. Similar behaviour can be observed for the r.m.s. error in figure 24; however, the r.m.s. error is much lower, less than 3 % in all cases. This indicates that the maximum error is restricted to one or two isolated components of the resistance matrix, while the errors in all other components are quite small.
Maximum error,  $E_{L_\infty }$, colour plot for three values of separation distance between the first and second particles. The error is evaluated between the binary model and the exact values. Panels show (a)
 $(\zeta _1^2 - \zeta _1^1)/a=2.0$, (b)
 $(\zeta _1^2 - \zeta _1^1)/a=2.5$, (c)
 $(\zeta _1^2 - \zeta _1^1)/a=5.0$.

The r.m.s. error,  $E_{rms}$, colour plot for three values of separation distance between the first and second particles. The error is evaluated between the binary model and the exact values. Panels show (a)
 $(\zeta _1^2 - \zeta _1^1)/a=2.0$, (b)
 $(\zeta _1^2 - \zeta _1^1)/a=2.5$, (c)
 $(\zeta _1^2 - \zeta _1^1)/a=5.0$.

B.2. Equilateral tetrahedron case
The accuracy of the binary model is also tested in the case of four particles configured as an equilateral tetrahedron. Similar to the three-particle system, the maximum and minimum errors are highest when the particles are close together. The error metrics decrease as the separation distance increases, as shown in figure 25. Additionally, in the four-particle case, the r.m.s. error is higher than in the three-particle case indicating that the error is more evenly spread among the elements of the resistance matrix than in the three-particle case. However, the maximum error is surprisingly lower than in the three-particle case indicating that increasing the number of particles does not always result in higher error for the binary model.
(a) Geometry for four particles as an equilateral tetrahedron. (b) Maximum and r.m.s. error in the resistance matrix as predicted by the binary model. Here,  $d$ is the separation, which is equal between each particles, and
 $a$ is the particle radius.

Appendix C. Curve fits of the four $\alpha$-corrected binary functions

The curve fits of the  $\alpha$-corrected binary added mass perturbation functions are
 \begin{align} \mathcal{B}_{11}^{c11} (d,\alpha) &= \frac{1}{2} \left[\frac{3}{64} \left(\frac{2a}{d}\right)^6 + \frac{9}{256}\left(\frac{2a}{d}\right)^8\right] \nonumber\\ &\quad + \frac{0.059}{(d/a - 1.9098)(d/a - 0.4782)^2 (d/a)^3} \nonumber\\ &\quad + (\alpha^2 -0.0902 \alpha)\frac{70.7731}{(d/a+2.0936)^6}, \end{align}
and
 \begin{align} \mathcal{B}_{22}^{c11} = \mathcal{B}_{33}^{c11} &= \frac{1}{2} \left[ \frac{3}{256} \left(\frac{2a}{d}\right)^6 + \frac{3}{256} \left(\frac{2a}{d}\right)^8\right] \nonumber\\ &\quad + \frac{0.0262 \alpha^2 - 0.0012 \alpha + 0.0003}{(d/a - 1.0401 \alpha^2 + 1.2519 \alpha - 1.3127)^6}, \end{align}
where the square bracketed leading-order terms are those from Béguin & Étienne (Reference Béguin and Étienne2016), and the remaining term is an empirical fit. It should be noted that the other terms remain non-zero even in the limit  $\alpha = 0$ and thus succinctly capture the higher-order terms presented in Béguin & Étienne (Reference Béguin and Étienne2016). These other terms also include the effect of finite volume fraction.
The curve fits of the  $\alpha$-corrected binary induced mass perturbation functions are
 \begin{align} \mathcal{B}_{11}^{c12} &= \frac{1}{2} \left[ -\frac{3}{8} \left(\frac{2a}{d}\right)^3 - \frac{3}{512} \left(\frac{2a}{d}\right)^9\right] + \frac{-6.0\times 10^{{-}4}}{(d/a-1.5482)^5} \nonumber\\ &\quad -0.7913\alpha \exp({-(0.9801 - 0.1075 \alpha) d/a}), \end{align}
and
 \begin{align} \mathcal{B}_{22}^{c12} &= \mathcal{B}_{33}^{c12} = \frac{1}{2} \left[ \frac{3}{16} \left(\frac{2a}{d}\right)^3 + \frac{3}{4096} \left(\frac{2a}{d}\right)^9\right] \nonumber\\ &\quad + ({-}0.1985 + 16.7372 \alpha)\left(\frac{a}{d}\right)^6 + (1.3907 - 48.2604 \alpha) \left(\frac{a}{d}\right)^8. \end{align}
The square bracketed terms are the leading-order terms in the series solution developed by Béguin & Étienne (Reference Béguin and Étienne2016), and the remaining terms empirically account for the truncation error plus the volume fraction effect. The empirical terms approximate the isolated particle case in the dilute limit and may be used as such to evaluate the uncorrected binary model.
Appendix D. Analytical approximations to the correction integrals
The following are exact evaluations of (5.10) and (5.11) with the approximate assumption that  $g(r)=1$. First, the self-acceleration correction is
 \begin{align} & \frac{{\rm
tr}\{\underline{\underline{I}}^A\}}{3}\nonumber\\
&\quad\approx \frac{5
(\mathcal{R}_{max}/a)^2 + 9}{10 (\mathcal{R}_{max}/a)^5} +
\frac{5 (\mathcal{R}_{max}/a)^2 +
12}{40(\mathcal{R}_{max}/a)^5} \nonumber\\ &\qquad +
\frac{1}{(\mathcal{R}_{max}/a) - 0.4782} \{[0.00720826 -
0.0150737 (\mathcal{R}_{max}/a)] \ln[(\mathcal{R}_{max}/a)
- 1.9098] \nonumber\\ &\quad\quad - 0.120023
(\mathcal{R}_{max}/a) \ln[(\mathcal{R}_{max}/a) - 0.4782] +
0.057395 \ln[(\mathcal{R}_{max}/a) - 0.4782] \nonumber\\
&\quad\quad + [0.135097 (\mathcal{R}_{max}/a) - 0.0646033]
\ln((\mathcal{R}_{max}/a)) - 0.0861828\} \nonumber\\ &\quad\quad
+ (\alpha^2 - 0.0902\alpha) \frac{0.333333
(\mathcal{R}_{max}/a)^2 + 0.348933 (\mathcal{R}_{max}/a) +
0.146105}{[(\mathcal{R}_{max}/a) + 2.0936]^5} \nonumber\\
&\quad\quad + \frac{5(\mathcal{R}_{max}/a)^2 + 12}{40
(\mathcal{R}_{max}/a)^5} + (0.0262 \alpha^2 - 0.0012 \alpha
+ 0.0003) \nonumber\\ &\quad\quad \times\frac{10
(\mathcal{R}_{max}/a)^2 + 5 (\mathcal{R}_{max}/a) H +
H^2}{30 [(\mathcal{R}_{max}/a) + H]^5},
\end{align}
where
 \begin{equation} H ={-}1.0401 \alpha^2 + 1.2519 \alpha - 1.3127. \end{equation}
Second, the induced correction is
 \begin{align} \frac{{\rm tr}\{\underline{\underline{I}}^I\}}{3} &\approx \frac{-1}{4(\mathcal{R}_{max}/a)^6} - 6\times 10^{{-}4} \frac{0.5 (\mathcal{R}_{max}/a)^2 - 0.516067 (\mathcal{R}_{max}/a) + 0.199744}{[1.5482 - (\mathcal{R}_{max}/a)]^4} \nonumber\\ &\quad - 0.7913 \alpha \frac{(\mathcal{R}_{max}/a) K [(\mathcal{R}_{max}/a) K + 2] \exp[-(\mathcal{R}_{max}/a)K]}{K^3} \nonumber\\ &\quad + \frac{1}{32(\mathcal{R}_{max}/a)^6} + \frac{-0.1985 + 16.7272 \alpha}{3 (\mathcal{R}_{max}/a)^3} + \frac{1.3907 - 48.2604 \alpha}{5 (\mathcal{R}_{max}/a)^5}, \end{align}
where
 \begin{equation} K = 0.9801 - 0.1075 \alpha. \end{equation}


 Open access

