From the 1870s to the outbreak of the First World War the first truly global financial economy emerged. This was a period of huge capital flows, against a backdrop of fixed exchange rates and the gold exchange standard. These institutions helped international diversification by reducing exchange rate risks. According to Albert Fishlow (1985), Great Britain invested around 5 percent of its Gross Domestic Product overseas annually (reaching a peak of 10 percent just before the outbreak of World War I), while France invested approximately half as much. Germany's foreign investments accounted for less than 2 percent of its Gross Domestic Product over the same period.Footnote 1
The financial competition between Great-Britain, France, and Germany was severe. Pedro Arbulu and Jacques-Marie Vaslin (2000) recall, in particular, that the London and Paris capital markets were “the places to be” in order to obtain capital. As a result, investors could buy a wide range of not only domestic but also European and international assets. In 1913 the nominal value of the foreign stocks listed on the London Stock Exchange accounted for 60 percent of the total nominal value of all the stocks listed on this exchange. One-third of these foreign stocks were issued by foreign governments and municipalities while 40 percent was devoted to railways. The rest involved mines and plantations, banks and financial institutions, or public utilities (Morgan and Thomas 1962; Ripley 1934; Goetzmann and Ukhov 2006).
In France, from 1892 to 1913, almost 50 percent of the total issues on the Paris stock exchange involved foreign principals (Parent and Rault 2004). The majority of French foreign investments were European, but the share of non-European securities grew steadily until the outbreak of the First World War.
Many scholars have wondered what prompted these investments. Michael Edelstein (1982) has emphasized the gaps in returns between domestic and foreign assets for Great Britain. William Goetzmann and Andrey Ukhov (2006) showed that British investors were familiar with a portfolio choice methodology called “the geographical distribution of capital.” British foreign investments allowed Victorian investors to hold diversified portfolios leading to enhanced performances. Moreover, Goetzmann, Ukhov, and Ning Zhu (2006) argued that geographical distribution was a methodology that European investors were aware of at the end of the nineteenth century.
In the case of France, the conventional wisdom is that its foreign investments were “overcommitted to European countries” and obeyed political and diplomatic considerations (Feis 1930; White 1933; Cameron 1961; Lévy-Leboyer 1977). For Harry White (1933, p. 110), “The French were very cautious investors. The bulk of capital was invested by small savers who above all wished security.” Antoine Parent and Christophe Rault (2004) used a VAR-ECM model analysis to show that French investments abroad were economically and financially driven, not politically or diplomatically. Two famous French financial analysts, Alfred Neymarck (1913) and Paul Leroy-Beaulieu (1906), had little doubt that French investors considered the potential benefits of diversification. Parent and Rault also argued that due to the restrictive opportunities offered by the Paris Bourse, French investors were likely to invest on the London Stock Exchange. It was clearly possible for French investors to buy assets listed on other (foreign) stock exchanges, and not just the foreign or domestic stocks on their local market. Leroy-Beaulieu considered that interest rate differences between France and other countries had encouraged French investors to invest directly on foreign stock exchanges and encouraged them to enter other financial markets. In reality, however, there is little evidence that French people held significant assets listed on foreign exchanges.Footnote 2 Holding these more distant assets was not the privilege of British and French investors. For instance, Rudolf Täuber (1911) explained how German investors could turn to international financial markets. The historical evidence is clear: investors were well aware of the opportunities presented by foreign exchanges.
In the context of free capital flows and broad access to different market, we address the following issues: why was the geographical distribution of the foreign assets listed in Paris and London so different prior to World War I; European oriented for the former and “New World” oriented for the latter?Footnote 3 Did economic rationality encourage investors to buy “New World” and sell Europe at the beginning of the twentieth century? Was there a cost to the European bias in French foreign investments? To address these issues, we deploy a portfolio and risk-return analysis and determine the relative efficiency of the investment opportunities available to a French, Victorian, and international investor.
We develop a risk-return analysis of a new database gathering all existing sectorial and debt published indices for the financial markets of France and Great Britain.Footnote 4 For the Paris Stock Exchange, the new database is the union of the data sets produced by Arbulu (1998), Parent and Rault (2004) and Vaslin (2007). We homogenized and reworked their series to obtain 15 indices of the annual returns of different groups of domestic and foreign assets listed on the Paris Stock Exchange. Second, to capture the opportunities on the London Stock Exchange over the same period, we use Edelstein's data set (1982). These data have been reworked to obtain 24 indices of the annual returns of domestic and foreign assets listed on the London Stock Exchange. We then aggregate the London and Paris and provide an international investor 39 homogenized indices to build a world portfolio. At each step of our analysis, we determine mean variance frontiers and optimal portfolio structures. We then compare these optimal portfolios with the estimates of actual British and French portfolios.
We start by assuming the existence of a risk-free asset but no short sale. In this context, it is not surprising that French investments abroad improve in efficiency compared to a purely domestic portfolio. More surprising is that French savers profited by limiting their domestic holdings, which is in contrast to the image of the supposedly very conservative “French rentier.” In fact, the structure of French optimal portfolios suggests that the preference of French investors for European investments was rational.
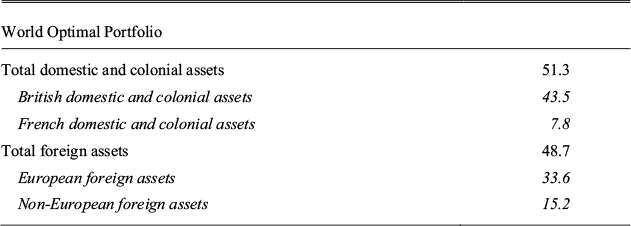
Second, we ask whether an international investor would have devoted such a large percentage of his portfolio to European assets. We show that British portfolios, considered independently, differ notably in terms of optimal allocation: we highlight that economic rationality should have encouraged Victorian investors to invest more widely in assets listed in other countries. This suggests the existence of a bias for investment in assets listed in London. Moreover, the structure of the world optimal portfolio indicates that on the eve of World War I, half of this portfolio should have been composed of foreign assets, two-thirds of which should have been European assets. Confronting these results with existing estimates of actual British portfolio distribution in 1914, it is clear that Victorian investors disregarded European investments and that this strategy was not the most efficient in terms of risk-return tradeoffs. Finally, we show that the optimal international portfolio would have included a large proportion of European assets; hence the French preference for Europe was not economically inconsistent.
WERE FRENCH INVESTORS RIGHT TO FAVOR EUROPEAN INVESTMENTS?
The Paris Stock Exchange at the End of the Nineteenth Century: French Investors’ Preference for Europe
As Arbulu has documented, the Parisian financial market grew over the nineteenth century. During the last quarter of the century, the proportion of issues that were equities rose steadily to reach two thirds of the French portfolio on the eve of World War I (Arbulu 2007, pp. 411, 417). The Decree of 1893 which reduced the minimum value of nominal shares also helped the Paris Stock Exchange to attract some savings from the “middle class.” This led Neymarck to remark that “the number of large capitalists had given way to a larger number of small stockholders.”Footnote 5 Citing Alphonse Courtois (1910), Parent and Rault described the Paris Stock Exchange as a fully developed and international financial market on which both French and foreign securities were traded with identical administrative rules.
Before the First World War, foreign listings on the Paris Bourse were largely European stocks and bonds. This European-oriented distribution of French foreign assets has prompted two sets of arguments: first that French investors did not have access to a world of more distant higher return financial assets; second that French foreign investments were politically and not economically driven and thus offered low returns (Lévy-Leboyer 1977).
Indeed the estimated geographical distribution of French investments abroad by the end of the nineteenth century and the beginning of the twentieth century, as given by Parent and Rault (2004, p. 337, from Herbert Feis 1930; and Rondo Cameron 1961), shows a predilection for Southern and Eastern Europe. These estimates show that few investments were made in “young nations.” Over time, however, the percentage of investments in Mediterranean countries and Europe's periphery decreased. These destinations alone represented 61.5 percent of French investments abroad in 1892 while the “Rest of the World,” i.e., the world outside Europe, “its periphery” and Russia, made up only 5 percent of French investments abroad. By 1913 the “Rest of the World” accounted for 25 percent of French foreign investments while Mediterranean countries and the periphery of Europe only garnered 12.5 and 16 percent respectively. Conversely, the value of French investments in Russian assets jumped between 1892 and 1900: from 10 percent to 27 percent of the total. Fishlow explained that this increase was notably induced by the growth of Russia's industrialization after the 1890s. As the empire's economy improved and its growth perspectives received positive rankings by financial analysts, it was able to place more bonds and stocks in Paris.
These observations echo those of some astute contemporary financial analysts. For instance, Leroy-Beaulieu summarized the changes in the distribution of French foreign investments over the period as follows: “Formerly, the horizon of rentiers and capitalists was limited to Western and Central Europe, then it expanded to the whole of Europe. Today it embraces the entire world, notably the two Americas and Asia, including the two modernized countries advancing towards new destinies: Japan and China.” Footnote 6
Were French Investments Inefficient?
Consider a risk averse investor who follows the Capital Asset Pricing Model (Sharpe 1963; Lintner 1965; Jan Mossin 1966). His decisions should reflect a choice of an efficient portfolio providing minimum variance for a given expected return (or a choice of an efficient portfolio providing maximum expected return for a given variance). When a risk-free asset is available, the efficient portfolio with the highest Sharpe ratio (which measures the excess return compared to the risk-free rate by risk unit) is the optimal one. A rational investor should combine this risky portfolio with the risk-free asset to construct an optimal investment (according to his preferences); the only variation among investors (who may be more or less risk averse) involves the share of wealth placed in the optimal risky portfolio. Adding an imperfectly correlated asset to the portfolio reduces its overall variance. Thus the diversification principle postulates that in building a portfolio with imperfectly correlated stocks, an investor can diversify and eliminate the specific risk of the asset (only systematic risk cannot be eliminated).
Let us uncover the portfolio that rational investors would have held on the eve of the First World War. These investors decide on their wealth allocation based on assets’ past returns over the gold exchange standard period, which began with the end of the Franco-Prussian War and ended with the outbreak of World War I. Using the probability distribution of stock returns (and more precisely the expected returns and covariance structure), we construct the mean variance frontier and find the portfolio with the highest Sharpe ratio. This allows us to examine what kind of portfolios can be rationalized.Footnote 7 The portfolio approach uses publicly traded financial assets, and we implicitly assume that these assets reflect French investment demand. The set of assets we consider is limited to the official market. In ignoring the Coulisse, do we introduce a restriction in investors’ choice set? Is the use of a partial set of assets likely to skew our answer? The answers depend on the nature and the correlation between the assets quoted on the Coulisse and on the Parquet official market. First, one has to bear in mind that the period of legal coexistence of the Parquet and the Coulisse is short (lasting only five years, 1893–1898). Second, over this period the vast majority of Coulisse transactions (5/7) concerned securities listed on the Parquet and we cannot use two competing series for the same asset.Footnote 8 Third, combining data from official and unofficial sources would be misleading regarding the quality of information we have from Coulisse: coulissiers were market makers and behaved as unregulated brokers, meaning that to obtain a correct price from the Coulisse one had to take the average of the prices quoted by all these brokers, which was obviously impossible because only a few “carnets de coulissiers” were available. As mentioned by Pierre-Cyrille Hautcoeur, Amir Rezaee, and Angelo Riva (2010) “the very concept of listing did not exist for the Coulisse, each broker quoting prices for the security he wanted, and newspapers publishing the lists of their choice.” By contrast, the Parquet published an official daily price list, a much more secure source of data. In our portfolio analysis, we considered only official Parquet data in view of the hypothesis of the model (agents use only public information). Ultimately, our analysis follows Neymarck's view that French investors considered securities listed on the Parquet as of greater quality. He also advised investors against spot investments on the Coulisse for the reasons set out above (1911, pp. 86, 101–04).
Modern Portfolio Theory assumes that investors only care about expected returns and their variance. These moments are estimated using annual returns between 1875 and 1913. When a risk-free asset exists, the optimal portfolio is on the Capital Allocation Line.Footnote 9 Here we test whether the portfolio of securities listed on the Bourse in 1913 was near or far from the Capital Allocation Line. As usual, trading prices are assumed to be equilibrium prices.
We assume that the 3 percent French Rente was the risk-free asset. One reason is that no “open market” existed at that time in Paris and the discount rate was not available to individual investors, thus there is no short-term risk free-rate. Leroy-Beaulieu (1906, p. 110) reminds us that among French bonds, the 3 percent French Rente had already been available as an “amortizable” asset since 1878 and was supposed to be amortized over a 75-year period. Moreover, the 3 percent Rente had the lowest nominal rate: the nominal rates on other French government bonds converged to 3 percent over the course of the various conversions until 1902 when it became the only French Rente available. Thus, subscribers might have considered the convertibility risk as minor. Contemporary French financial analysts also emphasized the “soundness” of the 3 percent French Rente even if the standard deviation of French Rentes was not zero. Assuming that the 3 percent French Rente was risk-free enables us to compare our results to Goetzmann and Ukhov's study of the London Stock Exchange (2006), which used Consols as a risk-free asset.
From a methodological point of view, short sales might be a concern. A short sale consists of selling a security that is not owned by the seller. It enables investors to speculate on the drop in price or to protect the portfolio. In this case, the weight of the security within the portfolio is negative. By enlarging the universe of investment, this opportunity has an impact on the composition of the optimal porfolio. We constrain the weight of each asset to be positive because our analysis covers indices and not stocks and because short sales are by nature short-term operations and our database is based on annual frequencies.
Nowadays, the term “short sales” is used for spot short sale operations. From an historical perspective, before the First World War, spot and forward sales were recognized as “short” provided the securities traded were not held by the seller when the contract was set.Footnote 10 Jean Hayaux Du Tilly (1901) argued: “People speculate not only thanks to forward operations. Short sale speculation is practiced daily on a small scale and only among professionals. These stock exchange regulars sell stocks they don't have or buy some they do not intend to hold, hoping to perform the opposite operation before the delivery or the payment date in order to make profit.” It seems that “spot” short sales were practiced in small quantities by a few professionals and on a limited number of stocks. This last point is in line with our methodological choice.
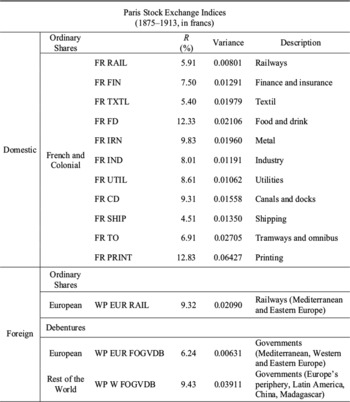
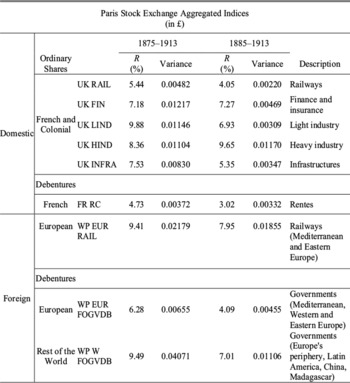
In this section, the database consists of the aggregate of published databases from Arbulu, Parent and Rault, and Vaslin. All these authors as well as Edelstein (1982, 2010) for Great Britain only collected data for “first class” securities which were frequently traded and considered as representative of the index they belong to. All these data have been homogenized in order to obtain fourteen indices of real annual returns representing the Paris Stock Exchange from 1875 to 1913. There are eleven indices representing ordinary, domestic shares.Footnote 11 There are also three indices representing foreign securities listed on the Paris Stock Exchange: one for European Railways ordinary shares, one for European Governments Bonds, and one for the “Rest of the World” (outside Europe) Government Bonds. Table 1 reports these various indices and their main characteristics.
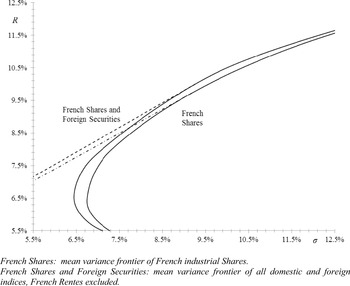
Adding foreign assets listed on the Paris Stock Exchange provides an obvious improvement to the mean variance frontier (Figure 1). The mean variance frontier considering domestic shares and foreign assets listed on the Paris Stock Exchange is higher and to the left as compared to the mean variance frontier restricted to domestic shares. An investor seeking a standard deviation of about 6.9 percent could improve the return of his portfolio from 7.15 percent to 7.7 percent by adding foreign assets.
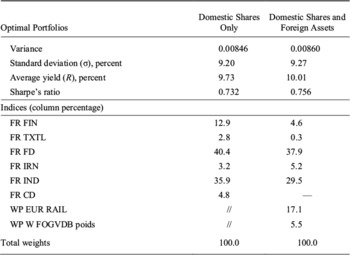
Let us now compare the efficiency of the pure domestic and the domestic and foreign optimal portfolios (see Table 2A). The introduction of foreign assets improves the Sharpe ratio. It is interesting to examine the structure of this optimal portfolio.Footnote 12 The portfolio includes several dynamic domestic sectors, such as the industrial index (IND) (29.5 percent), the metallurgy sector (IRN) (5.2 percent), and the financial sector (FIN) (less than 5 percent). All these sectors clearly experienced market and economic development from 1870 to 1914. On the contrary, the Shipping (SHIP) and Tramways and Omnibus (TO) sectors are absent from the optimal portfolio. Their importance was in fact minimal in the Paris Market. Among the indices not represented in the optimal portfolio (and thus that should have been sold by investors) is the French Railways sector (RAIL). The market capitalization of this sector decreased significantly at the end of the nineteenth and beginning of the twentieth century (Arbulu 2007).Footnote 13 Despite this decrease, this sector seems to be “overpriced” on the Paris Bourse. Recommendations from French analysts could have led investors to keep these stocks. For instance, Neymarck (1911, pp. 35, 36, and 61) suggested investors keep the railways securities in their portfolio because this sector had “very strong future perspectives” and dividends were guaranteed by conventions between railway companies and the French government. The portfolio excludes European Government Bonds Index (WP EUR FOGVDB). In fact, historical reasons and the context of these issues on the Paris Bourse from the beginning of the century could be put forward to explain the attraction among investors to these assets.Footnote 14 Their broad distribution in Paris guaranteed strong liquidity and may have been a safety factor for the investors (Parent and Rault 2004).
DETAILS OF PARIS STOCK EXCHANGE INDICES

Source:
Calculations from the authors according to Arbulu (1998), Vaslin (2007), and Parent and Rault (2004) data.
MINIMUM VARIANCE FRONTIERS OF RISKY ASSETS ON THE PARIS STOCK EXCHANGE

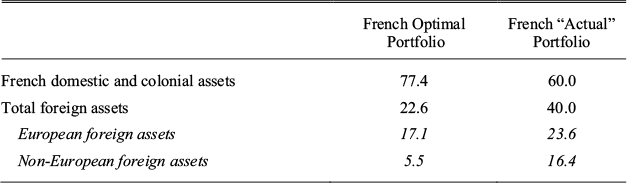
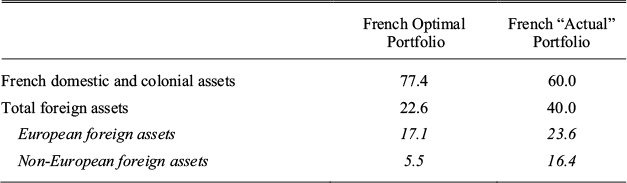
Globally, the optimal portfolio devotes approximately 22 percent of Bourse investments to foreign assets. This proportion is lower than their estimates from Paris market capitalizationFootnote 15 (Table 2B). Yet the optimal portfolio is far more consistent with the distribution of assets on the Bourse than with the traditional view of French investors as conservative and cautious. Finally, it is worth noting that more than 75 percent of foreign assets in the optimal French portfolio should have been European. Again consistent with what was on the Bourse.Footnote 16
FRENCH OPTIMAL PORTFOLIO STRUCTURE (in percent)

//: Not included in the investment opportunity set.
Notes:
When there is a risk-free asset; whatever the combination of 13 indices among 14 indices, the geographical structure of the optimal portfolio is stable.
Source:
Calculations from the authors.
STRUCTURE OF FRENCH OPTIMAL PORTFOLIOS IN MAIN CATEGORIES (in percent)
Sources:
French “actual” portfolio corresponds to the crossing of the estimates of Neymarck 1911, and Parent and Rault 2004, p. 337.
This first optimization thus leads us to three conclusions, two of them surprising. First, French domestic investments were apparently rational, in that the structure of the optimal portfolio is not inconsistent with the evolution of Paris market capitalizations. We also found that French investors (or rather the capitalization of the Bourse) overweighted foreign assets, both in Europe and in the rest of the world relative to the optimal portfolio. But it also appears that large investments in Europe were rational.
To further test the rationality and efficiency of the scale of European listings on the Bourse, we adopt a different perspective in the next section, and consider how an international investor might distribute his wealth between the Paris and London Stock Exchanges. This leads us to estimate a world optimal portfolio. This enables us to determine the place of European investments in a truly international portfolio.
AN OPTIMAL WORLD PORTFOLIO
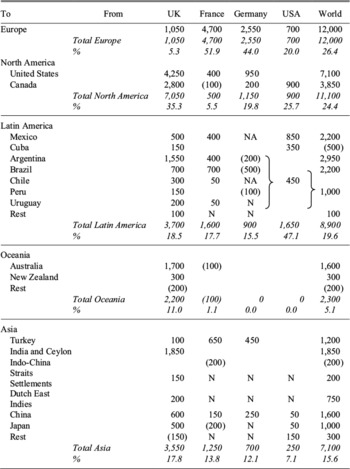
To our knowledge, William Woodruff (1966) is the only author to have calculated the total amount of world overseas investments as well as their geographic distribution on the eve of the First World War (Table 3). In his view, world overseas investments amounted to more than USD 45 billion, and four nations accounted for 85 percent of all such capital flows.Footnote 17 Among them, Great Britain (44 percent) and France (20 percent) were the source of about two-thirds. A quarter of the investments went to Europe (26.4 percent) and another quarter to North America (24.4 percent). Victorian investors exhibited a distinct preference for North America, which accounted for 35.3 percent of their overseas investments. At 5 percent of the total, their holdings of European assets remained marginal. Asia and Latin America each accounted for roughly 18 percent of British overseas investments. Capital invested in Oceania and Africa respectively accounted for 11 percent and 12 percent of the total.
In 1914 French foreign investments showed a real preference for Europe. While half of these investments were made in European countries (including Russia), the other half was exported across the rest of the world. Thus, the proportion of French foreign investments devoted to Latin America (18 percent) was almost equivalent to that of Great Britain. The rest of French foreign investments were distributed over Asia (14 percent), Africa (10 percent), and North America (5 percent).
GEOGRAPHICAL DISTRIBUTION OF FOREIGN INVESTMENTS IN 1914, IN MILLIONS OF USD TO THE NEAREST $ MILLION


N = negligible
NA = not available
Sources:
Woodruff 1966, p. 154.
In fact, the differences between British and French geographical distribution of capital can be summarized as follows: Paris ignored Oceania where London investors sent 11 percent of their foreign investments. Paris sent far less to North America than London (5.5 versus 35 percent). Finally, Paris liked European assets far more than London (51.9 versus 5.3 percent).Footnote 18
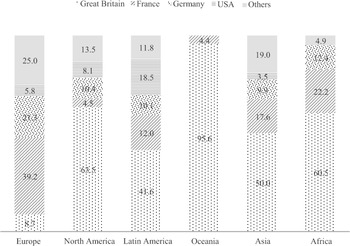
Figure 2 highlights the weight of the main investors within each geographical area. The investments of Great Britain and France accounted for about two-thirds of all investments received in each area, except in Europe. There France clearly dominated in 1914. Indeed, French capital accounted for 39 percent of the capital received by Europe and its periphery, followed by Germany at 21 percent, and Britain a distant third at less than 9 percent. Overall, an international investor could have created an internationally diversified portfolio simply based on assets available in Paris and London.
PROPORTION OF THE MAIN CAPITAL EXPORTERS WITHIN EACH GEOGRAPHICAL AREA (in percent)

Was It More Profitable to Invest in “Young Countries” Than in Europe?
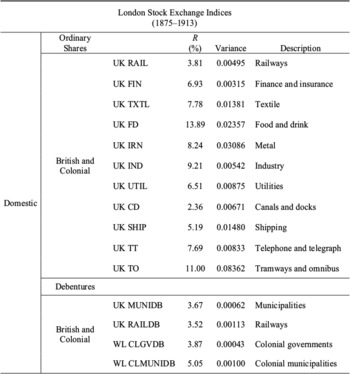
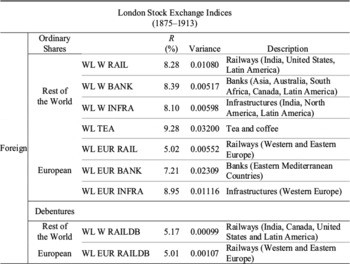
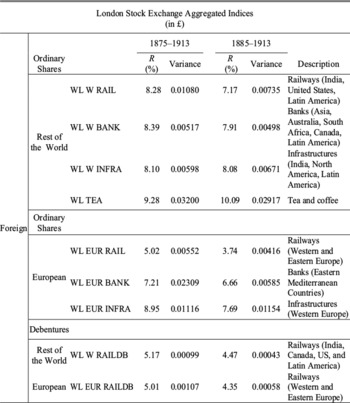
Given the differences in asset distribution between London and Paris, it is necessary to apply the same method we used for a French investor to a British investor. We now consider Edelstein's database of 24 industrial indices.Footnote 19Tables 4A and 4B detail the characteristics of these indices and clarify the terminology used in the following pages. There are fifteen British domestic indices: eleven represent British and colonial ordinary shares while four represent British and colonial debentures. There are nine foreign indices, three of which represent European ordinary shares while four represent “Rest of the World” ordinary shares; one index represents European Railway debentures and one represents “Rest of the World” Railway debentures; the “Rest of the World” meaning the world except Europe.
DETAILS OF LONDON STOCK EXCHANGE DOMESTIC AND COLONIAL INDICES

Source:
Calculations from the authors according to Edelstein’ database (1982).
DETAILS OF LONDON STOCK EXCHANGE FOREIGN INDICES

Sources:
Calculations from the authors according to Edelstein’ database (1982).
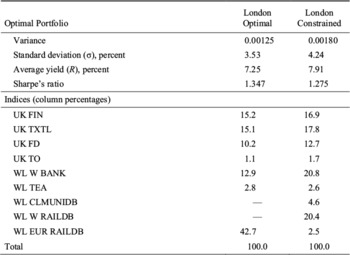
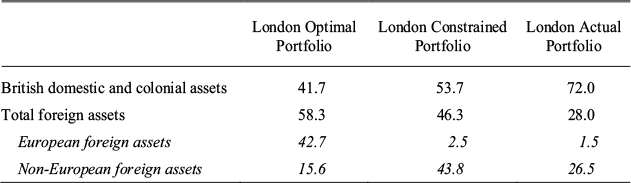
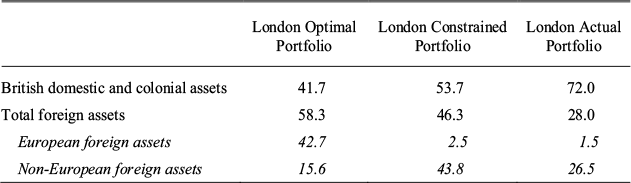
We first determine the London Optimal Portfolio (Tables 5A and 5B, second column). Our results extend those of Goetzmann and Ukhov by adding a geographic dimension.Footnote 20 Similar to their work, our optimal portfolio devotes more than 40 percent of wealth to foreign railway bonds. Yet because we divided this index between European and “Rest of the World” bonds, we can distinguish the geographical origins of the assets. Our London optimal portfolio is composed of about 60 percent foreign securities of which three-fourths are European assets.Footnote 21 Contrary to the idea that before the First World War London investors should have sent their money outside Europe to invest in new nations with higher growth prospects, 40 percent of our portfolio is European railway bonds. This optimal structure seems to be a long way from the true nature of British portfolios.Footnote 22
European investments were clearly critical to London optimal portfolios. It is also obvious that British overseas investments were very different from those predicted by the Modern Portfolio Theory. We therefore estimate a new, “London constrained” portfolio which restricts European assets to 2.5 percent of the overall British portfolio (the highest proportion Victorian investors ever devoted to these assets). We then compare this constrained portfolio to the unconstrained one we call the “London optimal.”
STRUCTURE AND CHARACTERISTICS OF OPTIMAL PORTFOLIOS

Source:
Calculations from the authors.
STRUCTURE OF VICTORIAN OPTIMAL PORTFOLIOS IN MAIN CATEGORIES (in percent)
Source:
Calculations from the authors. London “actual” portfolio corresponds to the crossing of the estimates of Hobson (1914), Feis (1930), and Woodruff (1966).
We compare the corresponding optimal portfolios, to quantify the potential efficiency gap between “London optimal” (Tables 5A and 5B, second column) and “London constrained” portfolios (Tables 5A and 5B, third column). The Sharpe ratio corresponding to “London optimal” portfolio is higher than “London constrained” one (1.347 against 1.275). By neglecting European investments, the “London constrained” strategy would have led Victorian investors to miss out on diversification opportunities. Both portfolios give substantial weight to foreign assets, around 58 percent for “London optimal” and around 46 percent for “London constrained.”Footnote 23 The same domestic indices are included in these portfolios. To our surprise the “London constrained” portfolio, which is closer to what occurred on the London Stock Exchange, confirms that investments were biased toward “young nations” to the detriment of European assets, and to investment returns.
A World Optimal Portfolio on the Eve of the First World War
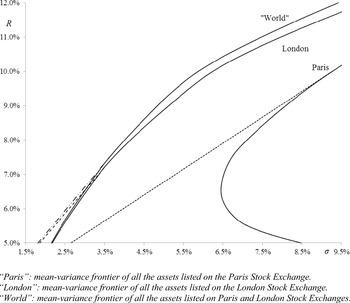
Our final set estimates the optimal investment strategy based on an database that includes data from the Paris and London Stock Exchanges. We use the previous French database between 1875 and 1913 corrected by the Franc/£ exchange rates and Edelstein's database.Footnote 24 This data set now includes 39 indices. Figure 3 shows the mean variance frontiers and capital market lines for French and British markets and our New World portfolio. It is obvious that an “international” investor would have wanted to hold assets from both the London and Paris Stock Exchanges. Indeed portfolios from the world market frontier are more efficient than those constrained to one market only. Yet the potential gain in efficiency was higher for French investors than for Victorian ones. It seems that London's return-risk tradeoff was better than that offered by the Paris Stock Exchange. This is not surprising because London was the most important and the largest stock exchange in the world at the time (Goetzmann and Ukhov 2006).
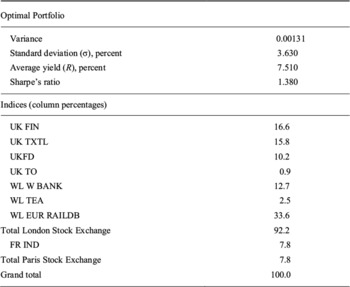
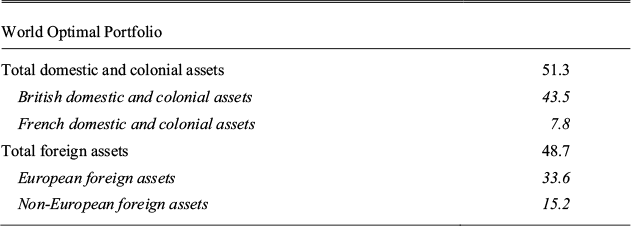
Table 6A details the structure and characteristics of the World Optimal portfolio. The World Optimal portfolio is more efficient than the “London Optimal” portfolio (by 2 percent), than the London “constrained” (by 7.5 percent) and than the Paris Optimal (by 16 percent).Footnote 25Table 6b breaks down the structure of the optimal world portfolio into main geographical categories. This portfolio is composed of about 48 percent foreign assets and, more particularly, of around 33 percent European assets. The weight of foreign assets in the optimal portfolio shows that investing heavily abroad and particularly in Europe was very attractive on the eve of World War I.Footnote 26
MEAN VARIANCE FRONTIERS OF RISKY ASSETS

Below, we compare the structure of the optimal world portfolio with two sources: first, with the actual structures of Paris and London listings in 1914; second, with British and French foreign investment estimates.
Edelstein (1982), Olivier Moreau-Néret (1939), and Neymarck (1911) provide estimates of Bourse capitalizations. Foreign assets were estimated at 47.7 percent of London Stock Exchange's total market capitalization by Edelstein. Neymarck considers that foreign assets amounted to 40 percent of the French exchange's capitalization. Moreau-Néret estimated that these assets accounted for 54 percent of the Parisian Stock Exchange's market capitalization in 1902. When set against our calculations, these estimates show that the vast scale of British and French investments abroad were economically consistent.
STRUCTURE OF THE WORLD OPTIMAL PORTFOLIO

Note:
Whatever the combination of 38 out of 39 indices, the geographical structure of the optimal portfolio is stable.
Source:
Calculations from the authors.
STRUCTURE OF THE WORLD OPTIMAL PORTFOLIO IN MAIN CATEGORIES (in percent)
Source:
Calculations from the authors.
In addition, we compare the structure of our optimal world portfolio with existing estimates of the outstanding stock in foreign assets held by British and French investors. These statistics provided by C. K. Hobson (1914), Feis (1930), and Woodruff (1966) were derived by estimating British and French balances of payments. They refer to British and French foreign investments and give an appraisal of the stock in foreign assets held by British and French residents. From this methodology of balance of payments, Hobson and Feis estimated that British capital exports represented, in 1914, 28 percent of the outstanding stock of British capital. According to Woodruff, half of French foreign investments were devoted to Europe, which represents about 20.8 percent of the French outstanding stock of capital. Similarly, he estimated that 5.3 percent of British foreign investments were devoted to Europe, which represents around 1.5 percent of the British outstanding stock of capital.
CONCLUSION
We have looked at the economic consistency of French and British geographical distribution of capital prior to World War I. The use of Modern Portfolio Theory allowed us to show that on the eve of the First World War, investors on the London Stock Exchange or on the Paris Bourse should have devoted a large part of their portfolio to European assets. We started with Paris and showed that the Paris optimal porfolio structure tended to corroborate the French prefence for European assets. Then moving to London, we pinpointed differences of structure between the London optimal portfolio and actual British investments. Modern Portfolio Theory suggests that London investors should have invested more heavily in European assets.
After this, we went one step further, considering an international investor and determining an optimal world portfolio. Once again, the outcome is that an optimal portfolio should have been mainly composed of foreign assets and of a high proportion of European ones. How do our findings relate to standard debate in economic history? Let us consider this conclusion in light of earlier work by Lance Davis and Robert Huttenback (1982, 1987) and Davis and Robert Cull (1992). They already reminded us that Vladimir Lenin (1916) justified such foreign investment based on mean returns.
Lenin saw imperialism as the supreme stage of capitalism. He developed the idea that colonial empires were privileged outlets for British and French capital exports. In Lenin's analysis, beginning in the 1880s, the hunt for colonies and the deepening struggle for control over territory around the globe were closely linked to the transition to the monopolistic stage of capitalism, i.e., the financial stage of capitalism. Our aim is not to test whether foreign investments acted as a type of replacement financial destination for a declining metropolitan economy, harmed by the trend of a “falling profit rate.” Yet the results of our study have some similarities with Lenin's view. Indeed, we highlighted the benefits of diversification and the gains from overseas investments during this period. In any case, the similarity is only partial in that we pinpointed the benefits of diversification not just in colonial eras but in all foreign markets: we provided evidence that the efficient frontier of portfolios composed of domestic-colonial-foreign assets is above and to the left of the one composed strictly of domestic and colonials assets (for British and French portfolios). In that sense, our conclusion could also be seen as a refutation of Lenin's view because financial diversification oriented investors towards regions that were quite different from those controlled by colonial empires. Indeed, capitalism was already on a larger, “world dimension” scale (see the section on the world portfolio).
Davis and Huttenback (1987), using data from 482 British firms operating either at home, in the empire, or in the rest of the world over the period 1860–1912, corroborate Edelstein's main findings. They provide evidence that, overall, British firms operating in the empire had higher returns than domestic enterprises, and also outperformed British companies operating overseas outside the empire. This last conclusion differs from our own because we found that including foreign assets in the portfolio always improves the efficiency frontier of portfolios and that (British and French) domestic and colonial portfolios are always dominated by international portfolios. Their conclusions derive from “examining rates of return on the book value of assets rather than on market value” (Davis and Huttenback 1987, p. 120). We collected only market information, using prices and returns on publicly traded assets. Yet, these different approaches highlight the same phenomenon of diversification until the eve of World War I from two strong traditions in economic history.
This article revises the contributions of Edelstein (1982) and Goetzmann and Ukhov (2006). They found in particular that it was rational for British investors to include a large proportion of foreign debt and equity in their portfolios. From the same financial perspective, debating the costs and benefits of international diversification— which refers to a comparison between the risk-adjusted rates of return of domestic and overseas assets—we have introduced the issue of the geographical distribution of French and British portfolio holdings. By doing so, we reached two core conclusions: First, the Paris Bourse offered an opportunity set of investments that French investors did exploit, far from the image of the cautious and risk-adverse French rentier that conventional wisdom suggests; second, we have highlighted that British investors at the London Stock Exchange showed a “New World bias.”
Ultimately, this latter conclusion is in line with the results of William Kennedy (1974) and the questions of Donald McCloskey (1970): “Did Victorian Britain Fail?” Indeed, these authors emphasized that the British allocation of capital was characterized over the period 1870–1914 by a massive allocation to “conservative foreign investments,” suggesting a pronounced implicit risk aversion. According to Kennedy (1974, pp. 427–28), this assumes a strong preference for risk avoidance, reflected by “the infrequency of defaults on foreign investment; the preponderance of fixed-interest securities in the aggregate portfolio of British foreign assets and the relatively low rate of return.” The Victorian aggregate portfolio over this period is described as “bond-laden, conservative and chosen to suit the tastes of discriminating rentiers” (Kennedy 1974, p. 432). Our results, using the rigorous framework of Modern Portfolio Theory, tend to corroborate and support Kennedy's intuition that Victorian investors did not exploit all the investment opportunities available, notably in European assets. In this way, the disturbing lesson learned from portfolio analysis revives a forgotten view that has probably not attracted enough attention in the past.
Appendix
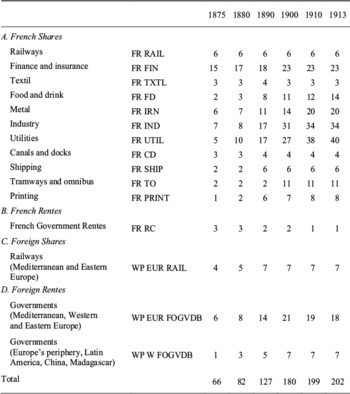
TIME COMPOSITION OF INDICES REPRESENTING THE PARIS STOCK EXCHANGE

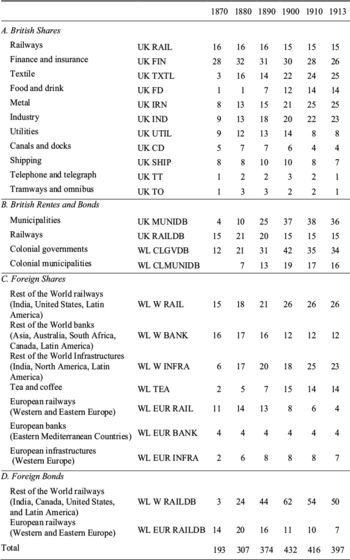
TIME COMPOSITION OF INDICES REPRESENTING THE LONDON STOCK EXCHANGE

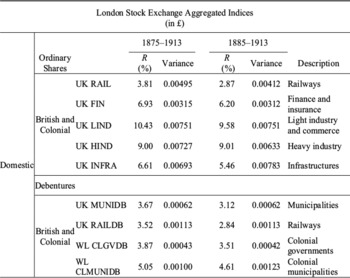
DETAILS OF LONDON STOCK EXCHANGE DOMESTIC AND COLONIAL AGGREGATED INDICES RELATIVE TO SENSITIVITY TESTS

DETAILS OF LONDON STOCK EXCHANGE FOREIGN AGGREGATED INDICES RELATIVE TO SENSITIVITY TESTS

DETAILS OF PARIS STOCK EXCHANGE AGGREGATED INDICES RELATIVE TO SENSITIVITY TESTS