I. INTRODUCTION
There is growing interest in advanced Fe–Cr ferritic/martensitic (F/M) alloys, oxide dispersion strengthened (ODS) alloys, and nanostructured ferritic alloys (NFA) for nuclear applications due to their enhanced radiation tolerance, strength, and low activation. Reference Zinkle and Snead1–3 These BCC alloys typically have complex microstructures containing a high density of small grains, laths and subgrains, precipitate phases, and dislocation lines. Reference Klueh and Harries2 As a result, performing transmission electron microscopic (TEM) imaging on these materials and their micro- to nanoscale features is challenging, because of the complexity of their microstructures and the resolution required. The high density of microstructural features produces significant contrast in bright-field (BF) TEM images, making it difficult, if not impossible, to discern features.
BCC alloys are currently of interest for high radiation dose applications, specifically for doses greater than about 20 displacements per atom (dpa). Reference Zinkle and Snead1–Reference Zinkle and Busby4 These service conditions induce significant microstructural changes, including defect clustering, dislocation loop formation, void and bubble formation, radiation induced or enhanced precipitation, and radiation induced segregation (RIS). Reference Zinkle and Busby4 These irradiation-induced changes further complicate the microstructure of BCC alloys, hindering a thorough characterization using standard TEM-based techniques.
Scanning transmission electron microscopy (STEM) is a powerful and versatile tool for characterizing metals and alloys. By changing the imaging conditions such as camera length, probe size, and foil tilt, the image contrast can be readily adjusted based on several guiding principles. In addition, STEM can be used to image nanoclusters (NCs) and precipitates, while simultaneously analyzing microchemical changes under the same imaging conditions.
This paper focuses on STEM techniques and protocols for characterizing radiation damage in irradiated alloys with a specific focus on BCC Fe-based alloys including ODS and NFA alloys. Each section of the paper focuses on a different irradiation effect, namely, RIS, NC and nanoparticles, voids and bubbles, and dislocation loops.
II. RIS MEASUREMENTS
Energy dispersive x-ray spectroscopy in STEM (STEM-EDX) is a common high-resolution technique for composition measurement, particularly for spatially-dependent composition measurement, such as a trace across a grain boundary. Multiple studies have measured radiation induced segregation (RIS) in BCC Fe–Cr steels by collecting line scans using STEM-EDX. Reference Gupta, Jiao, Ham, Busby and Was5–Reference Wharry and Was9 This section will describe the methods contributing to a sound RIS measurement, including experimental setup, error analysis, and measurement limitations. Examples of STEM-EDX RIS measurements in BCC Fe–Cr steels will also be illustrated.
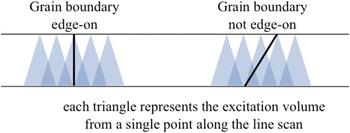
Specimen thickness is one of the most influential factors in the accuracy of STEM-EDX RIS measurements. Reference Michael, Plimpton and Romig10–Reference Williams and Carter13 Because the electron beam broadens as it passes through the specimen thickness, a thin sample is desirable so as to minimize the excitation volume excited by the electron beam, thus improving the measurement spatial resolution. In addition, the grain boundary of interest must be aligned edge-on to the incident electron probe so as to maximally expose the boundary to the electron beam. This minimizes the magnitude to which the sampled matrix dilutes the measured grain boundary concentrations. The excitation volume effect is shown schematically in Fig. 1.
Illustration of the effect of STEM-EDX excitation volume on STEM-EDX spatial resolution, shown with respect to grain boundaries aligned edge-on and non-edge-on to the electron beam.

Specimen thickness is of particular concern for BCC Fe–Cr steels, as they exhibit magnetism capable of distorting the electron beam. A thin sample of reduced volume, such as a focused ion beam (FIB) lift-out subsequently milled to ≲100 nm, minimizes the effects of magnetism. Because magnetic distortions are enhanced at higher magnifications, RIS measurements in non-FIB BCC Fe–Cr steels are often limited to maximum magnifications of 200,000–300,000x. Reference Wharry and Was9
EDX requires the excitation volume to yield sufficient x-rays to provide ample counting statistics. Because each line scan is an independent measurement, the only way to reduce the noise and uncertainty of the measurement is to increase the number of counts collected. Measurement error is directly related to the count time and the number of counts collected. In most RIS studies of BCC Fe–Cr alloys, Cr is the element of primary interest, so the number of counts in the Cr peak in the EDX spectrum is of greatest importance. A 95% confidence interval can be achieved on each point along the line scan with a 2% counting error, given as the square root of the number of counts, by collecting 10,000 counts in the Cr peak; the counting error can be reduced to 1% when collecting 35,000 counts in the Cr peak. Reference Williams and Carter13 Thus, if the specimen is too thin, an insufficient excitation volume produces few x-rays (with dead time ∼10% or lower) and the microscopist is unable to obtain statistically significant quantification at reasonable dwell times. Thus, a practical lower limit for conventional STEM-EDX sample thickness is ∼75 nm, unless advanced STEM-EDX systems with larger solid angles of collection are used, as described in Sec. III.
A double tilt specimen holder is recommended with a tilt range on the order of ±30° or greater. This helps bring grain boundaries into edge-on alignment with the electron probe. For F/M alloys, prior austenite grain boundaries (PAGBs) tend to be higher-angle boundaries and exhibit greater RIS than lower-angle boundaries or low-Σ coincident site grain boundaries. Reference Field, Barnard, Parish, Busby, Morgan and Allen7,Reference Field, Miller, Chichester, Sridharan and Allen14 Unfortunately, PAGBs are often difficult to align because of the carbide decoration, which exceeds 60% coverage of the PAGB in commercial BCC F/M steels. Reference Wharry, Jiao, Shankar, Busby and Was8 This leaves only short grain boundary segments, often on the order of tens of nanometers, on which to conduct an alignment. Furthermore, RIS measurements performed within 20 nm of a carbide tend to be influenced by the carbide. Reference Penisten Wharry15 Field et al. Reference Field, Barnard, Parish, Busby, Morgan and Allen7,Reference Field, Miller, Chichester, Sridharan and Allen14 determined the dependence of RIS on grain boundary misorientation, underscoring the importance of noting the misorientation angle between adjacent grains at the time of analysis. When selecting a grain boundary to study, one must also consider the contrast of the adjacent grains. It is desirable to choose a boundary between grains having similar contrast, which are not strongly diffracting due to orientation near a low-order zone axis. In effect, x-ray generation differs in strongly-diffracting grains as compared to weakly-diffracting grains, the accuracy of quantitative EDX analysis is reduced if selected grains do not have similar contrast.
RIS is measured by taking an EDX scan along a line perpendicular to the grain boundary or a 2D map over and along the grain boundary. In these scans and images, the electron probe dwells on a point for a specified length of time; an EDX spectrum is acquired from that point. The electron beam then moves to the next point, and an EDX spectrum is obtained there. This process is repeated over the entire length of the user-specified line or 2D map. The typical configuration for accurate RIS measurement is based on the size of the analyzing probe and the spatial distribution of RIS. Reference Watanabe, Ackland, Burrows, Kiely, Williams, Krivanek, Dellby, Murfitt and Szilagyi16 For example, using a STEM probe with a finite size of ∼1.2–1.5 nm, a typical line scan or image has point-to-point spacing of 1.5 nm apart over a 60 nm length centered on a grain boundary. This configuration is sufficient to ensure that start and end points are measuring matrix compositions, while remaining short enough for ease of experimentation and limiting spot analysis overlap.
It is also good practice to collect two line scans in the matrix, one in each adjacent grain, or enough points in the direction parallel to the grain boundary during an image. The results of these matrix EDX spectrums can be used to determine experimental k-factors based on the known bulk composition. Reference Cliff and Lorimer17 Matrix scans or images need not have as fine resolution as cross-boundary RIS scans, but should contain 40–60 dwell points to minimize the effect of local composition variations, clusters, or precipitates. It is also good practice to perform all line scans and 2D maps using drift correction. Quantitative data are usually extracted using the Cliff–Lorimer approach, Reference Williams and Carter13 because the major elements of interest (Fe, Cr, Mn, etc.) are minimally absorbed or fluoresced in a thin (<100–150 nm) specimen.
In the extraction of quantitative composition data from STEM-EDX, a limitation of the Cliff–Lorimer formulation is that this method forces the total concentration of all measured elements to sum to 100%. Reference Williams and Carter13 Because of this, large amounts of RIS of minor elements or impurities, such as Si, could mathematically suppress weaker RIS behaviors such as that of Cr. However, the direction of the measured RIS (i.e., enrichment or depletion) will be accurate. This can be confirmed by taking the ratio of the counts of element M to the total number of counts. If that ratio is larger at the grain boundary than in the matrix, element M has enriched at the boundary; if the ratio is smaller at the grain boundary than in the matrix, element M has depleted at the boundary.
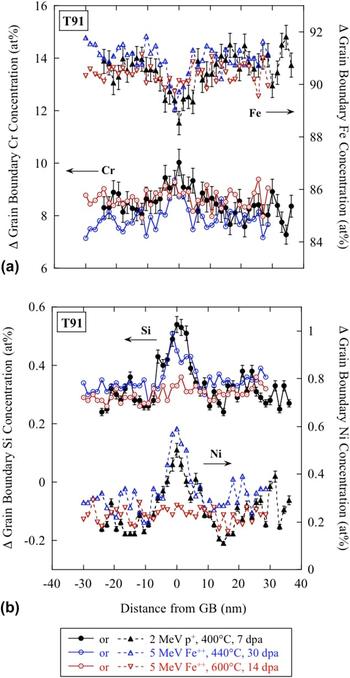
In the example presented here, RIS was measured by STEM-EDX on a Philips CM200 FEG-STEM at Oak Ridge National Laboratory in a commercial F/M alloy, T91, irradiated to three conditions: 2.0 MeV protons to 7 dpa at 400 °C, 5.0 MeV Fe++ ions to 30 dpa at 440 °C, and 5.0 MeV Fe++ ions to 15 dpa at 600 °C. In all specimens, grain boundary Cr enrichment and Fe depletion were observed [Fig. 2(a)], on the order of ≤2 at.%. Grain boundary Si and Ni enrichment were observed in the specimens irradiated at 400–440 °C [Fig. 2(b)], while no Si or Ni segregation was observed at 600 °C. This is consistent with the high-temperature suppression of minor element RIS observed with protons by Wharry and Was. Reference Wharry and Was9 This alloy exhibited no pre-existing segregation. Reference Wharry and Was9 Thermally-induced grain boundary segregation has not been investigated in this alloy, but that is outside the scope of this manuscript.
Example of RIS profiles showing (a) Cr enrichment and Fe depletion, and (b) Si and Ni enrichment, in T91 irradiated with protons or self-ions over a range of temperatures (400–600 °C) and doses (7–30 dpa). Images taken using Philips CM200 FEG-STEM.

STEM-EDX RIS measurements are diluted by the finite size of the STEM electron probe, as well as beam broadening through the thickness of the TEM foil. Reference Carter, Damcott, Atzmon, Was, Bruemmer and Kenik18 The composition profile measured by STEM-EDX is a convolution of the actual composition profile with the electron beam. The actual composition profile is typically narrow and sharply-peaked, while the STEM-EDX measured RIS profiles tend to be broader with suppressed RIS magnitudes. Three-dimensional atom probe tomography using a local electrode atom probe tomography (LEAP) measures RIS profiles with higher spatial resolution, and therefore a lesser convolution effect. Thus, LEAP measurements of RIS in BCC F/M alloys Reference Bachhav, Yao, Odette and Marquis19–Reference Marquis, Lozano-Perez and De Castro23 typically exhibit enhanced spatial resolution and larger RIS magnitudes than those measured by STEM-EDX in this work.
III. NANOCLUSTER AND NANOPARTICLE IMAGING
As discussed, the spatial resolution of conventional EDX data in STEM is limited by two factors: the size of the electron probe incident on the entrance surface of the specimen, and the broadening of the electron probe within the foil. Reference Michael, Plimpton and Romig10–Reference Plimpton, Michael and Romig12 Probe size is determined by the microscope optics, and broadening is determined by the beam energy, average atomic number of the specimen, and the foil thickness. For thin foils, perhaps <20 nm in Fe at 200–300 keV primary beam energy, Reference Parish and Miller24 spatial resolution is on the order of the size of the probe. In a conventional analytical STEM, probe sizes are limited to ∼0.5–2 nm with analytically useful probe currents of ∼500–2000 pA. Advances in electron optics, specifically aberration-corrected electron microscopy, Reference Haider, Hartel, Muller, Uhlemann and Zach25–Reference Pennycook, Chisholm, Lupini, Varela, Borisevich, Oxley, Luo, van Benthem, Oh, Sales, Molina, Garcia-Barriocanal, Leon, Santamaria, Rashkeev and Pantelides27 can produce electron probe sizes on the order of ∼0.06 nm. For sufficiently thin samples, with minimal broadening, atomic resolution x-ray mapping has been demonstrated using corrected STEM probes. Reference Kotula, Klenov and von Harrach28 If spatial resolution is not such a concern, probe correctors allow large probe currents to be applied to a conventionally sized (∼0.5–2 nm) probe, Reference Watanabe, Ackland, Burrows, Kiely, Williams, Krivanek, Dellby, Murfitt and Szilagyi16,Reference Parish, White, LeBeau and Miller29 increasing mapping speed at conventional spatial resolutions. In the thinnest samples with corrected probes, thermal diffuse scattering Reference Chu, Liou, Chang, Choa and Chen30 or convergence angle Reference Ringnalda, Genc and Kovarik31 is believed to control spatial resolution. In BF-TEM, the objective aperture size will limit spatial resolution Reference Schäublin32 ; by reciprocity, this limit is imposed by the STEM convergence angle in BF-STEM.
A thin sample, necessary for maximum resolution, produces few x-ray counts. Small probe current (<1 nA, often <100 pA) is needed to produce the smallest (∼Å) probe sizes, further reducing signal levels. Two main approaches address this: high efficiency x-ray detection hardware and multivariate statistical analysis (MVSA) of the acquired data.
High-efficiency detectors for STEM are now commercially available. Silicon drift detectors (SDDs) have replaced conventional Si(Li) systems because of many orders of magnitude improved count throughput and superior low-energy x-ray detection. Reference Newbury33,Reference Newbury34 Large area, multidetector SDD systems with up to 0.9 sr collection angle (compared to <0.1 sr in typical analytical STEMs' Si(Li) systems) improve x-ray count rates by one to two orders of magnitude. Reference Klenov, Freitag, von Harrach, D’Alfonso and Allen35–Reference von Harrach, Dona, Freitag, Soltau, Niculae and Rohde37 Combined with the higher probe currents available in a corrected instrument, the differences in count rates in x-ray mapping can approach 100x.
All modern x-ray mapping systems acquire spectrum images (SIs), in which an entire spectrum—and not just counts in a region of interest, such as the Fe Kα line—is acquired at each pixel. Reference Jeanguillaume and Colliex38 Typical SI sizes range from 512 × 512 to 1024 × 1024 pixels, as compared to conventional analytical STEM maps, which are typically on the order of 64 × 64 pixels; modern SI datasets are simultaneously enormous and sparse, poorly suited to human interpretation but well suited to computational MVSA methods. Reference Kotula, Keenan and Michael39,Reference Parish and Hawkes40
Descriptions of MVSA, and its underlying assumptions and mathematical underpinnings, are available in, for instance, Refs. Reference Parish and Hawkes40 and Reference Keenan, Grahn and Geladi41. Specific to STEM-EDX, the MVSA method of optimally scaled principal component analysis (PCA) is used to find the underlying spectral contributions to the noisy spectrum image, as well as the spatial distribution of these spectral contributions. Reference Keenan and Kotula42,Reference Keenan and Kotula43 In the examples below, the Sandia National Laboratory AXSIA code Reference Kotula, Keenan and Michael39 is used to perform optimally scaled PCA. Varimax Reference Kaiser44 rotation is used to maximize the spatial simplicity of the representation. Finally, multivariate curve resolution (MCR) by alternating least squares under non-negativity constraints Reference Keenan, Grahn and Geladi41,Reference Van Benthem and Keenan45 is used to produce a representation more easily interpreted by a human analyst. The results presented are thus MCR “score images” and “loading spectra.” Additional details are available in Ref. Reference Parish and Hawkes40.
MVSA methods in general, and PCA in particular, are useful for two purposes Reference Keenan, Grahn and Geladi41 : First, to provide an improved qualitative interpretation of the data, especially in comparison to the x-ray “dot maps” usually extracted from SIs that throw away most of the data and correlations. MVSA interrogates the SI as an ensemble, so correlations invisible to the human analyst are presented by the unbiased statistical technique, often finding co- –or anti-variations of chemical species that are not apparent from conventional methods of x-ray map data presentation or analysis. Second, MVSA provides an unsurpassed noise filter to improve quantitative analyses derived from the SIs. This second method, improved quantitation, has been used successfully for irradiated steels Reference Burke, Watanabe, Williams and Hyde46 and for a wide variety of materials. Reference Gorzkowski, Watanabe, Chan and Harmer47–Reference Parish, Brennecka, Tuttle and Brewer49 Given the inherently embedded-particle nature of NCs in ODS or NFA steels Reference Certain, Field, Allen, Miller, Bentley and Busby50 however, the first purpose, qualitative insight, will be emphasized here.
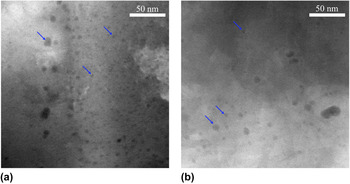
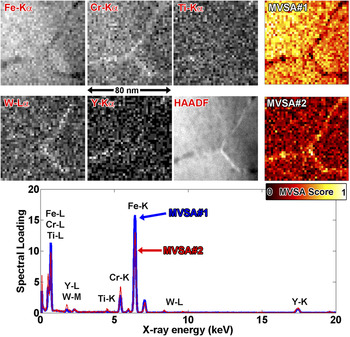
Spatial resolution ∼2 nm and with poor visibility of NCs in a ferritic matrix is produced by a conventional FEG-source analytical STEM. Figure 3 shows conventional HAADF STEM images of oxide NCs in as-received and irradiated (5.0 MeV Fe++, 100 dpa, 400 °C) model Fe–9Cr ODS steel experiment at the Center for Advanced Energy Studies (CAES) with a FEI Tecnai TF30-FEG TEM/STEM. These images show that conventional STEM techniques not only have limited spatial resolution, but also preclude the microscopist from determining whether, and to what extent, irradiation affects the nanocluster size and number density. Similar images of NCs in as-received NFA 14YWT (Fig. 4) show poor spatial resolution for chemical analysis experiment at Oak Ridge National Laboratory (ORNL) with a Philips CM200ST-FEG microscope, 200 kV, using ∼1 nA, ∼1.5 nm probe, SI conditions 40 × 40 pixel, 2 nm/pix, 1 s/pix, ∼600 cps. Absolute counts can be rather high (∼500–10,000 counts/pixel) with intermediate to long (≥1 s) dwell times. Coarse pixel spacing, with associated poor oversampling, and the poor signal to background ratio of a ∼2 nm NC embedded in a 40–60 nm thick TEM foil make visualization of the NCs dangerous at best—the more so for any quantitative analysis, either elemental or in terms of size and number density. MVSA methods improve feature visibility, but because matrix NCs' signal level is low, the NCs (and associated chemical information of Ti and Y) are erroneously added to the grain-boundary Cr–W rich MVSA component. In MVSA terminology, the chemical rank of the specimen is three (matrix-grain boundaries-NCs), but the rank of the MVSA solution is two.
Conventional HAADF STEM images of oxide NCs in model Fe–9Cr ODS steel: (a) as-received and (b) irradiated with 5.0 MeV Fe++ ions to 100 dpa at 400 °C. Images taken using FEI Tecnai TF30-FEG TEM/STEM.

CM200 S/TEM data of unirradiated NFA 14YWT. X-ray count maps are labeled with the line (e.g., Fe Kα) and MVSA score images are labeled MVSA#1, #2. HAADF, high-angle annular dark field. All images are to the same scale.

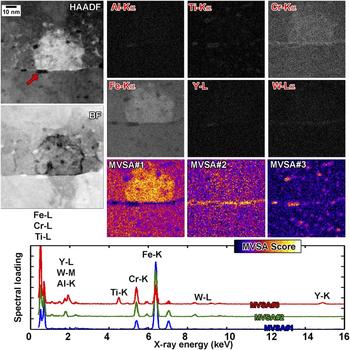
What happens when we combine aberration correction, high-efficiency multichip SDD EDX, and MVSA data reduction instead of conventional STEM described prior? Subnanometer sized NCs embedded in a ∼20–40 nm thick TEM foil can be identified, Fig. 5. A single Al-rich particle is identified at the grain boundary, along with segregation of Cr–W to the grain boundary and segregation of Cr around the NCs and precipitates. This experiment studied unirradiated NFA 14YWT at North Carolina State University (NCSU) using the Titan G2 with ChemiSTEM microscope operating at 200 kV, ≈300 pA, <≈2 Å probe, 21 mrad convergence, SI conditions 768 × 768 pix, ≈93 pm/pix, ≈4 ms/pix, ∼2300 cps. Several NCs invisible in the x-ray maps, but visible in the MVSA analysis, are arrowed in Fig. 5, showing the power of the combined methods. Features with this degree of detail are unprecedented in STEM analysis of steels, and previously only obtainable via atom probe tomography (APT).
Titan G2 data of unirradiated NFA 14YWT. X-ray count maps are labeled with the line (e.g., Fe Kα) and MVSA score images are labeled MVSA#1, #2, #3. HAADF, high-angle annular dark field; BF, bright field. All images are to the same scale. Loading spectra are offset for clarity.

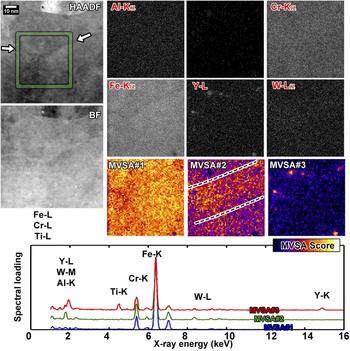
A specimen of the same NFA irradiated to ∼5–10 dpa at −100 °C (10 MeV Pt3+, ∼4 × 1015 cm−2) shows destruction of most of the NCs by homogenization, Reference Parish, White, LeBeau and Miller29,Reference Parish, Edmondson, Zhang and Miller51 Fig. 6. Only a few precipitates remain, and in the x-ray extracted intensity dot maps, no GB film component is visible. This experiment was also carried out using the NCSU Titan G2 with ChemiSTEM microscope at 200 kV, ∼700 pA, <5 Å probe, 10 mrad convergence, SI conditions 512 × 512 pix, ≈93 pm/pix, ≈7 ms/pix, ∼5800 cps. However, after MVSA, a broad component with Cr–W enrichment becomes visible (dashed lines), centered along the grain boundary visible in the HAADF image (arrows). This component is likely due to ballistic or cascade mixing of the sharp GB film with no kinetics for back-diffusion at −100 °C irradiation temperature. The combination of spatial and spectral information, determined via MVSA and enabled by high efficiency SDD hardware and probe corrected optics, was impossible with the hardware available even five years ago but is now becoming routine.
Titan G2 data of ∼5 dpa, −100 °C irradiated NFA 14YWT. X-ray count maps are labeled with the line (e.g., Fe Kα) and MVSA score images are labeled MVSA#1, #2, #3. HAADF, high-angle annular dark field; BF, bright field. All images are to the same scale. Loading spectra are offset for clarity. Arrows indicate a grain boundary, and dashed lines show area of enhanced score in MVSA#2.

Even with these advanced methods, artifacts will occur and the analyst must be cautious. Bright, corrected probes and high-efficiency detectors still provide low absolute signal levels in these high-resolution experiments. Typically, stage drift or specimen damage and contamination will limit the integration time of the experiment; we have not observed carbon contamination as the limiting factor due to aggressive plasma cleaning of the sample and sample holder and the inherently high vacuum of the Titan instruments. When the signal levels are too low, MVSA will not identify minor chemical features as unique components and will include the features into other components, as can be seen in the CM200 data (Fig. 4).
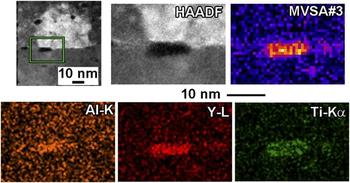
The small Al-bearing particle (Fig. 5, indicated by an arrow) should have been identified as a unique MVSA component (sample chemical rank four), but was instead included into the NC component (model rank three). This is because the large Y and Ti content in and near the Al overwhelmed the low signal level of Al. In the absence of experimental noise, the Al feature would have been differentiated, but in this dataset, the average counts/pixel was ∼10, leading to lack of differentiating power and convolution of the components together. The spectral response for the NC component (Fig. 5) shows a small Al contribution (1.5 keV) which is probably not present in the NCs at large, but rather due to the contribution of the Al-bearing grain boundary particle. A detailed look at this particle (Fig. 7) shows it consists of a Ti-shell around an Al–Y core, a detail missed by MVSA. Similarly, Fe counts dominate the NCs' spectrum, although the NCs themselves are probably Fe-free. Reference Unifantowicz, Schaublin, Hebert, Plocinski, Lucas and Baluc52 This is because the NCs are embedded in a Fe matrix, and Fe contributes to every pixel. PCA and related models are bilinear factor models, and can be acted upon matrix rotation operations, any nonsingular R-matrix of which provides a valid solution. Reference Keenan53,Reference Smentkowski, Ostrowski and Keenan54 This sort of artifact—Fe present even in the non-Fe-bearing component—is rotational ambiguity, Reference Tauler, Smilde and Kowalski55,Reference Vosough, Mason, Tauler, Jalali-Heravi and Maeder56 and could in principle be reduced or eliminated by adding constraints to the rotations, but for the purposes of qualitative analysis is best simply acknowledged as a matrix contribution to the embedded particles. Rotational ambiguity, in this case, means that many mathematically valid solutions are possible, but cannot be differentiated without more information, so it is important to assume that there will be some elemental “cross-talk” between the different loading spectra. Thus, quantitation of the loading spectra is ill-advised. However, combining advanced STEM with MVSA still allows effective identification of NCs.
Comparison of MVSA#3 score image to x-ray count maps for the unirradiated NFA 14YWT specimen. X-ray count maps are smoothed by a 7 × 7 pixel averaging kernel. The precipitate is a Y–Al core with Ti-shell, but MVSA ranks it as a single chemical component.

IV. VOID AND BUBBLE IMAGING
Helium evolution in structural materials will be a major lifetime-limiting factor, particularly at higher temperatures and under mechanical creep loads. Reference Dai, Odette, Yamamoto and Konings57,Reference Zinkle and Ghoniem58 It is hypothesized that high densities of engineered defects will sequester helium into many small bubbles, Reference Odette, Alinger and Wirth59,Reference Odette and Hoelzer60 which will suppress deleterious void swelling and grain boundary weakening, thus improving the suitability of steels to operate in the high temperature environments of fusion and fast fission reactors. The major driver behind the development of advanced steels, such as oxide-bearing ODS and NFA grades or carbide and nitride-bearing reduced activation ferritic/martensitic (RAFM) or thermomechanical treatment (TMT) grades, is to introduce these helium-sequestering defects. Reference Tan, Katoh and Snead61 We define some terminologies Reference Donnelly62 : “bubble” refers to a small defect in the matrix filled with overpressurized gas, and “void” refers to a similar defect which contains less than the equilibrium gas pressure or vacuum. “Cavity” refers collectively to both voids and bubbles.
The question to the microscopist is this: Do the engineered nanostructuring defects (oxides, etc.) introduced to modern steels actually succeed in the goal of capturing and sequestering helium? This is not a simple question to answer from a microscopist's perspective. Cavities larger than ∼2 nm can be identified easily in TEM by using “Fresnel contrast” mode, in which the sample is imaged at an overfocus and then an underfocus condition. Reference Jenkins63–Reference Loretto and Smallman68 Small cavities show a distinct contrast reversal when moving from under- to overfocus [Figs. 8(a) and 8(b)], calculable from TEM contrast theory. Reference Yao, Edwards, Kurtz, Odette and Yamamoto69
(a–b) Fresnel contrast under/over focus TEM images of NFA 14YWT implanted with helium. (c–d) BF and HAADF-STEM. (a–b) αTEM < 1 mrad, βTEM ∼ 5 mrad. (c–d) αSTEM ∼ 15 mrad, βBF ∼ 16 mrad, βHAADF ∼ 55 mrad.

Conventional over-/underfocus imaging is easy and effective for cavities above about 2 nm in diameter, but accurate measurement of defects smaller than ∼2 nm is not possible, as proven by TEM image simulations. Reference Yao, Edwards, Kurtz, Odette and Yamamoto69 Small precipitates can also have similar contrast to small cavities. Materials such as NFA steels, designed to sequester helium into a high density of very small bubbles and also containing small low-contrast NCs, enter the realm where these conventional methods of cavity microscopy are ambiguous or grossly inappropriate. Reference Parish and Miller24 In NFAs, the NCs are so small and coherent that there is essentially no diffraction contrast, so analytical and STEM methods are particularly valuable. Reference Brandes, Kovarik, Miller and Mills70
High-angle annular dark field (HAADF) STEM is an obvious means to differentiate NCs from cavities; however, clear quantitative differentiation of low-Z NCs from cavities is complicated by effects such as differing contrast in matrix grains of different orientation, variations in sample thickness, variations in cavity and NC diameter (or deviations from a sphere), etc. BF-TEM and BF-STEM also show poor cluster/cavity differentiating power, Figs. 8(c) and 8(d).
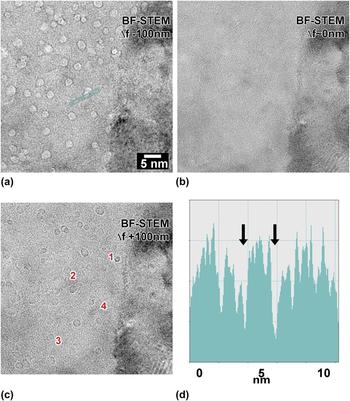
TEM and STEM are related by the reciprocity theorem, Reference Krumeich, Müller and Wepf71 where TEM's small convergence and collection angles can lead to a very similar STEM BF image if the STEM is operated with small collection (β) and convergence (α) angles, where αSTEM ≈ βTEM and βSTEM ≈ αTEM. Therefore, operating the STEM with a small or medium convergence angle simulates TEM with a small or medium objective aperture. Operating the STEM with a long camera length results in a small collection angle βSTEM and places a very small slice of reciprocal space onto the BF detector, replicating TEM's nearly parallel illumination. Reference Krumeich, Müller and Wepf71 As a result, under these conditions, defocusing provides Fresnel-contrast STEM BF images essentially indistinguishable from TEM images, which results in excellent cavity identification. Reference Parish and Miller24 By then acquiring a HAADF image of the same area—which is easy and fast, since the instrument is already configured for STEM and only a change in detector channel and camera length is needed—provides an image of both NCs and cavities by their Z-contrast. Thus, cavities are features whose contrast reverses between over- and underfocus. Features that have strong HAADF contrast but not Fresnel contrast are precipitates, such as NCs in NFA steel. The largest advantage with respect to TEM imaging is that the HAADF images will allow sizing of the bubbles with high precision (owing to STEM's and corrected STEM's potentially angstrom to sub-angstrom resolution in HAADF mode), whereas it is impossible to correctly size cavities smaller than ∼2 nm in TEM. In a thin foil with a corrected STEM, HAADF should allow bubble sizing with precision much better than 1 nm, by using over- and underfocused BF STEM, with small collection angle and moderate convergence angle, which are shown in Fig. 9.
(a–c) are BF-STEM images with αSTEM = 12 mrad, βBF ∼1 mrad. Defocus values are approximately −100, 0, and +100 nm from (a–c). d: Profile across the two features marked in (a). Reproduced from Parish and Miller. Reference Parish and Miller24 Copyright Microscopy Society of America, 2014. Reprinted with permission from Cambridge University Press.

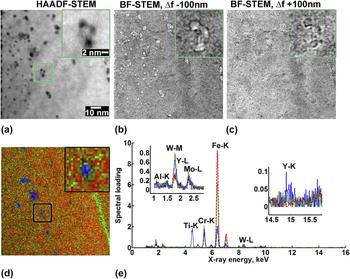
To further verify and confirm the differentiation between NCs and cavities, STEM-EDX mapping and MVSA (Sec. III) are ideal. Comparing HAADF-STEM and Fresnel BF-STEM images with MVSA-decomposed EDX SIs further defines the NC and cavity populations, and shows information such as cavities attached to a NC, Fig. 10. In that example, a dense population of cavities (presumably highly pressurized helium bubbles, owing to a high appm He/dpa ratio in a single-beam irradiation) and NCs. Boxed in the figure is a single ∼3 nm precipitate spatially associated with three bubbles. Although the 2D-projection nature of S/TEM prevents a definitive conclusion that the cavities are attached to the precipitate, it is almost certain that they are. To complement these S/TEM based methods, recently APT-based methods to image small cavities were developed, Reference Miller, Longstreth-Spoor and Kelton72 and have shown association of many of the cavities in these same specimens with NCs. Reference Li, Parish, Powers and Miller73,Reference Edmondson, Parish, Zhang, Hallén and Miller74 Comparison of HAADF-sized and APT-sized cavities agree quantitatively. Reference Parish and Miller24
(a) HAADF-STEM. (b, c) Fresnel-contrast BF-STEM, at approximately −100 and +100 nm defocus, respectively. (d, e) MVSA decomposition of EDS map, showing matrix, GB, and NC contributions. 300 keV, 1000 pA beam, ∼3000 cps, ∼45 min. 8002 SI pixels, binned to 1002 for analysis. Spectra truncated to 1.0–16.0 keV, binned to 750 channels. Reproduced from Parish and Miller. Reference Parish and Miller24 Copyright Microscopy Society of America, 2014. Reprinted with permission from Cambridge University Press.

V. DISLOCATION LOOP IMAGING
Radiation-induced hardening and embrittlement in structural materials have largely been attributed to dislocation loops that form under the presence of irradiation, particularly at temperatures near one-third of the melting temperature of the alloy or below. Reference Zinkle and Busby4 Mobile point defects, created from the damage cascade, coalesce to form extended defects, including dislocation loops. For BCC Fe and BCC Fe–Cr alloys, it is generally accepted that two types of dislocation loops can form: Burger's vector b = a/2〈111〉 and b = a〈100〉 dislocation loops. Reference Yao, Edwards and Kurtz75 The ratio of a/2〈111〉 and a〈100〉 loops has been reported to be dependent on the irradiation dose, temperature, and Cr content for an alloy of interest. Reference Yao, Edwards and Kurtz75–Reference Chen, Jung, Hoffelner and Ullmaier77 The variation in the ratio of different dislocation loop types can be partially attributed to the mobility of the two dislocation loop types: a/2〈111〉 loops are glissile (mobile) while a〈100〉 loops are sessile (immobile) at temperatures relevant to cladding and structural material applications. Reference Dudarev, Bullough and Derlet78,Reference Fitzgerald and Yao79 Such mobility also has more global impacts on the material properties and could significantly impact the radiation-induced hardening observed in BCC Fe and BCC Fe–Cr alloys, among other alloys.
The dislocation loop morphology, size, and number density have typically been investigated using conventional transmission electron microscopy (CTEM) using two-beam imaging conditions. These studies require a series of image sequences on the same area of interest using different diffracting vectors, g , to satisfy the varying g · b invisibility criterion of the two different dislocation types and possible habit planes of each type. Such a task is nontrivial for the novice microscopist and remains a labor-intensive task, even for the most veteran of microscopists. Recent work by Yao et al. Reference Yao, Edwards and Kurtz75 has sought to aid in such a task by using the g · b invisibility criterion and crystallographic information of BCC materials to publish the expected dislocation loop morphologies to be viewed on the viewing screen (or camera) for any given selected g vector. Prokhodtseva and coworkers Reference Prokhodtseva, Decamps, Ramar and Schäublin80 also demonstrated the use of a convergent weak beam TEM technique for identification of loop Burgers vectors in irradiated Fe and Fe–Cr. While these are valuable approaches for quantifying the density and density anisotropy of dislocation loops in BCC alloys, they still require a careful tilt series to fully characterize a single region of interest within a TEM sample and can be prone to errors due to misinterpretation of the contrast observed in images.
Such issues with dislocation analysis using CTEM are not a singularity to irradiated materials. As such, an interest in the application of STEM using BF, annular bright field (ABF), or annular dark field (ADF) to image dislocation networks in unirradiated materials has grown. Reference Amali, Rez and Cowley81–Reference Maher and Joy89 The reason for such interest is that STEM significantly reduces the elastic contrast in the background by smearing out thickness-dependent contrast, it can be performed on thicker samples, and the traditional g · b invisibility criterion can remain applicable. As discussed in previous sections, the imaging in STEM and CTEM is equivalent due to reciprocity when imaging conditions in both modes are carefully selected. Furthermore, dislocations exhibit strong contrast due to de-channeling contrast and diffuse scattering. Reference Cowley and Huang82,Reference Perovic, Rossouw and Howie84 A recent publication by Phillips et al. Reference Phillips, Brandes, Mills and De Graef86 has reviewed the STEM-based imaging of dislocations in unirradiated material. Of particular interest for irradiated BCC materials is on-zone STEM imaging.
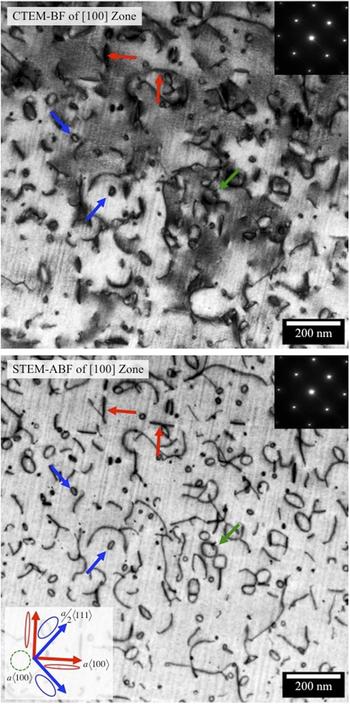
By utilizing the anticipated dislocation morphologies developed by Yao et al. Reference Yao, Edwards and Kurtz75 for two-beam CTEM imaging, the principles of reciprocity for TEM and STEM, and unique capabilities available in STEM, it becomes clear that on-zone STEM imaging can be used to easily image dislocation loops in irradiated BCC Fe and BCC Fe–Cr alloys. An example of the application of such technique is shown in Fig. 11. Figure 11 shows dislocation loops formed in a BCC Fe–15Cr–3.9Al model alloy irradiated to 1.6 dpa at 387 °C in the High Flux Isotope Reactor (HFIR) at ORNL imaged on the [100] zone axis in both CTEM BF and STEM-ABF modes from the same region of interest. Imaging down the [100] zone axis results in a〈100〉 loops to appear edge-on aligned with the [002] directions on the CCD while a/2〈111〉 loops appear as elongated ellipses aligned with the [011] directions. Due to on-zone STEM simultaneously imaging all possible diffraction vectors for the [001] zone axis, as well as the relaxation of the g · b invisibility criterion allowing for faint contrast from in-plane a[100](200) loops, all possible dislocation morphologies, including line dislocations, can be imaged in a single micrograph. It should be noted that such statements only hold true for those dislocation morphologies solely composed of a/2〈111〉 and a〈100〉 loops in a BCC matrix.
Dislocation loop imaging using CTEM and STEM-ABF of dislocation loops in a neutron irradiated Fe–15Cr–5Al model alloy. STEM-ABF shows strong contrast of dislocation loops and matches expected dislocation loop morphologies (a〈100〉 type loops highlighted with red arrows, in-plane with a green arrow, and a/2〈111〉 loops highlighted with blue arrows). Inset shows [001] zone axis diffraction pattern.

By comparing the contrast formed in the single image to the anticipated dislocation morphologies for the [100] zone axis and using standard sample thickness measurements such as convergent beam electron diffraction (CBED), Reference Williams and Carter13 the density and density anisotropy of dislocation loops can be quickly and easily determined. Furthermore, the full power of STEM can be utilized including the use of STEM-EDX spectrum imaging to determine segregation to dislocation loops in thin foils such as the study recently conducted by Bhattacharya et al. Reference Bhattacharya, Meslin, Henry, Pareige, Decamps, Genevois, Brimbal and Barbu6 Finally, the images shown in Fig. 11 were taken using a conventional Philips CM200 FEG-(S)TEM operating at 197 kV. As such, the point-to-point resolution prevents the specific determination of “black dots” with a size of <10 nm in Fig. 11 due to the system resolution limit. Although not conducted here, the application of aberration-corrected STEM where point-to-point resolutions ∼1 Å are routinely possible, could be used to characterize the morphology of the “black dot” damage typical of irradiated BCC Fe and BCC Fe–Cr at low temperatures. Ultrahigh resolution analysis of black spot damage in SiC has already been shown, Reference He, Zhai, Liu, Jiang, Szlufarska, Tyburska-Puschel, Sridharan and Voyles90 and extension to ferritic steels should be possible.
VI. CONCLUSIONS
Advanced STEM techniques offer a versatile toolkit for characterizing the microstructural and microchemical effects of irradiation with high spatial resolution in BCC Fe-based alloys. This work provides a description of STEM techniques and protocols for measuring RIS, NCs and nanoparticles, cavities, and dislocation loops.
-
(1) RIS is measured by STEM-EDX. Specimen thickness, grain boundary alignment, and counting statistics are key parameters for an accurate RIS measurement; however, STEM-EDX RIS measurements have limited spatial resolution due to electron probe broadening through-thickness of the sample. An example of Cr enrichment and Fe depletion is shown for F/M alloy T91 irradiated with protons and self-ions.
-
(2) NCs can be imaged using conventional FEG STEM, although the spatial resolution of such a technique is limited to ∼2 nm. Using aberration correction, high-efficiency multichip SDD EDX, and MVSA data reduction results in increased spatial resolution to subnanometer sized NCs. An example of this technique is illustrated for nanostructured ferritic alloy 14YWT.
-
(3) Differentiating NCs from cavities can be attempted by HAADF STEM, although contrast differences due to differing grain orientation, among other variations, can complicate the measurement. Alternatively, combining HAADF STEM with Fresnel-contrast BF STEM imaging offers excellent abilities to differentiate NCs from cavities. STEM-EDX mapping and MVSA can further validate NC and cavity measurements.
-
(4) Dislocation loops can be imaged with strong contrast using on-zone STEM-ABF similar to that of CTEM. On-zone STEM down the [100] zone axis allows for the simultaneous imaging of all possible dislocation loop and line morphologies on a single micrograph. An example of on-zone STEM imaging of dislocations is shown for a neutron-irradiated BCC Fe–15Cr–3.9Al model alloy.
ACKNOWLEDGMENTS
This research was sponsored by: the Materials Sciences and Engineering Division, Office of Basic Energy Sciences, U.S. Department of Energy (CMP); the U.S. DOE's Office of Nuclear Energy, Advanced Fuel Campaign of the Fuel Cycle R&D program (KGF); US DOE, Office of Nuclear Energy Nuclear Energy University Program (NEUP), awards 10-172 (KGF/AGC) and 10-678 (JPW); US DOE, Nuclear Energy Research Initiative, award 08-055 (JPW); and US DOE, Office of Nuclear Energy under DOE Idaho Operations Office Contract DE-AC07-05ID14517, as part of ATR National Scientific User Facility experiment 13-419 (JPW). Part of the microscopy research was conducted as part of a user project supported by ORNL's Center for Nanophase Materials Sciences (CNMS), which is an Office of Science User Facility. APT, FIB, and Pt-ion irradiations were conducted using EMSL, a national scientific user facility sponsored by the Department of Energy's Office of Biological and Environmental Research and located at Pacific Northwest National Laboratory. Neutron irradiations on Fe–Cr–Al alloys were carried out in the HFIR, a user facility funded by Department of Energy's Basic Energy Sciences.
CMP acknowledges the use of the Analytical Instrumentation Facility (AIF) at North Carolina State University, which is supported by the State of North Carolina and the National Science Foundation (NCSU Titan G2 S/TEM). CMP thanks Dr. D.T. Hoelzer of ORNL for providing the samples of the extruded 14YWT nanostructured ferritic alloy, Prof. A. Hallén of the Royal Institute of Technology, Kista, Sweden for performing the helium ion implantation, Prof. J.M. LeBeau, Dr. Xiahan Sang and Dr. Yi Liu, NCSU, for assistance with the NCSU Titan, and Dr. Y. Zhang, ORNL, for Pt-irradiated sample. KGF thanks Y. Yamamoto of ORNL for providing Fe–Cr–Al samples for irradiation and would like to thank the Irradiated Materials Examination and Testing (IMET) facility and Low Activation Materials Development and Analysis (LAMDA) laboratory staff for their continuing support of the research enclosed. JPW acknowledges Dr. G.S. Was, Dr. O. Toader, and Dr. F. Naab at the University of Michigan for their assistance with proton and Fe++ ion irradiations and for providing T91 and Fe-9Cr ODS specimens. JPW acknowledges the use of the Microscopy and Characterization Suite (MaCS) at the Center for Advanced Energy Studies (CAES), with the assistance of M. Swenson (Boise State) and oversight of Dr. Y. Wu (Boise State).