





Introduction
Schizophrenia spectrum disorders (SSDs) are severe and chronic psychiatric conditions affecting approximately 1% of the global population (McGrath et al., Reference McGrath, Saha, Welham, El Saadi, MacCauley and Chant2004). These disorders profoundly impact multiple domains of quality of life, including physical health, social functioning, and psychological well-being (Dong et al., Reference Dong, Lu, Zhang, Zhang, Ng, Ungvari, Li, Meng, Wang and Xiang2019). Among lifestyle factors, physical inactivity is particularly concerning, as individuals with schizophrenia have significantly lower levels of physical activity (PA) compared to the general population (Allison et al., Reference Allison, Mentore, Heo, Chandler, Cappelleri, Infante and Weiden1999; Andersen et al., Reference Andersen, Holmen, Egeland, Martinsen, Bigseth, Bang-Kittilsen, Anderssen, Hansen and Engh2018; Ganguli, Reference Ganguli1999; Scheewe et al., Reference Scheewe, Jörg, Takken, Deenik, Vancampfort, Backx and Cahn2019; Stubbs, Williams, Gaughran, & Craig, Reference Stubbs, Williams, Gaughran and Craig2016; Vancampfort et al., Reference Vancampfort, Firth, Schuch, Rosenbaum, Mugisha, Hallgren, Probst, Ward, Gaughran, De Hert, Carvalho and Stubbs2017; Zarbo et al., Reference Zarbo, Rota, Calza, Crouter, Ekelund, Barlati, Bussi, Clerici, Placenti, Paulillo, Pogliaghi, Rocchetti, Ruggeri, Starace, Zanolini, Zamparini and de Girolamo2023), often failing to meet the World Health Organization’s (WHO) recommended PA guidelines (Bull et al., Reference Bull, Al-Ansari, Biddle, Borodulin, Buman, Cardon, Carty, Chaput, Chastin, Chou, Dempsey, DiPietro, Ekelund, Firth, Friedenreich, Garcia, Gichu, Jago, Katzmarzyk and Willumsen2020). The consequences of this sedentary lifestyle extend beyond physical health, as numerous studies have demonstrated a strong association between low PA levels and poor mental health outcomes (Ohi et al., Reference Ohi, Kataoka, Shimada, Kuwata, Okubo, Kimura, Yasuyama, Uehara and Kawasaki2019). For example, meta-analytic data indicate that physical inactivity is associated with a 25–30% increased risk of developing depression in the general population (Schuch et al., Reference Schuch, Vancampfort, Firth, Rosenbaum, Ward, Silva, Hallgren, Ponce De Leon, Dunn, Deslandes, Fleck, Carvalho and Stubbs2018).
In individuals with SSD, the relationship between PA and mood disturbances appears to be even more pronounced compared to HC. Research has shown that lower PA levels are associated with greater severity of negative symptoms (e.g., anhedonia, blunted affect) and higher levels of depressive symptoms (D’Anna et al., Reference D’Anna, Zarbo, Cardamone, Zamparini, Calza, Rota, Correll, Rocchetti, Starace and de Girolamo2023; Dauwan et al., Reference Dauwan, Begemann, Slot, Lee, Scheltens and Sommer2021; Pearce et al., Reference Pearce, Garcia, Abbas, Strain, Schuch, Golubic, Kelly, Khan, Utukuri, Laird, Mok, Smith, Tainio, Brage and Woodcock2022; Pieters et al., Reference Pieters, Deenik, Tenback, van Oort and van Harten2021; Zarbo et al., Reference Zarbo, Rota, Calza, Crouter, Ekelund, Barlati, Bussi, Clerici, Placenti, Paulillo, Pogliaghi, Rocchetti, Ruggeri, Starace, Zanolini, Zamparini and de Girolamo2023). Additionally, physical inactivity exacerbates cognitive deficits, reduces social engagement, and is linked to higher antipsychotic medication dosages, poorer treatment adherence, and lower overall functioning (Damme et al., Reference Damme, Gupta, Ristanovic, Kimhy, Bryan and Mittal2022; Stubbs et al., Reference Stubbs, Williams, Gaughran and Craig2016).
Recent technological advancements, such as Ecological Momentary Assessment (EMA) and wearable accelerometer-based biosensors, offer innovative methodologies to investigate the daily life experiences of individuals with SSD thoroughly. EMA provides real-time, ecologically valid assessments of individuals’ emotional and behavioral experiences (Shiffman, Stone, & Hufford, Reference Shiffman, Stone and Hufford2008), while wearable accelerometer-based biosensors enable continuous and objective PA monitoring (Arabboev, Begmatov, and Nosirov, Reference Arabboev, Begmatov and Nosirov2024). However, despite their potential, the application of these methodologies in SSD research remains limited.
Existing studies on SSD have rarely combined high-frequency EMA with continuous accelerometry to quantify real-time, bidirectional associations between PA and mood in daily life. Building on this gap, the present study uses a multimodal ecological approach to characterize PA–mood dynamics and diurnal patterns in individuals with SSD compared with healthy controls (HC). Specifically, as shown in Figure S1 in Supplementary Material 1, we utilized: (1) EMA delivered via smartphone 8 times daily to assess real-time mood states (depicted by emoji scales, with smartphone notifications shown along the temporal timeline below); (2) ActiGraph wearable accelerometers to objectively monitor PA (represented by running figures), analyzing movement intensity and duration using ENMO metrics, with directional arrows indicating the temporal dependencies. By systematically integrating these methodologies, this study aims to:
-
• Examine the strength and direction of associations between PA levels and mood, while controlling sociodemographic factors such as age and gender.
-
• Identify potential differences in PA and mood patterns between participants with SSD and HC.
Given the inherent complexity and bidirectionality of mood–PA interactions over time, we implemented complementary analytical strategies, combining Generalized Linear Mixed Models (GLMMs) for assessing day-level associations and Bayesian hierarchical models for modeling fine-grained, time-lagged dynamics. This combined approach addresses a critical limitation of previous research, which has typically relied on aggregated or static measures (Merikangas et al., Reference Merikangas, Swendsen, Hickie, Cui, Shou, Merikangas, Zhang, Lamers, Crainiceanu, Volkow and Zipunnikov2019; Scheewe et al., Reference Scheewe, Jörg, Takken, Deenik, Vancampfort, Backx and Cahn2019), potentially masking intraday temporal variability or the potential bidirectionality of these processes. By leveraging this dual strategy, our study aims to capture the temporal structure and individual variability of mood and PA interplay in everyday life, offering novel insights for personalized, sensor-informed interventions in SSD.
Methods
Study setting
This cohort study was conducted at a subset of sites participating in the Italian national DiAPAson project. These included seven Departments of Mental Health, which enrolled both outpatients and residentials, one clinical research center, and two residential facilities, which exclusively recruited residents.
Eligibility criteria and recruitment
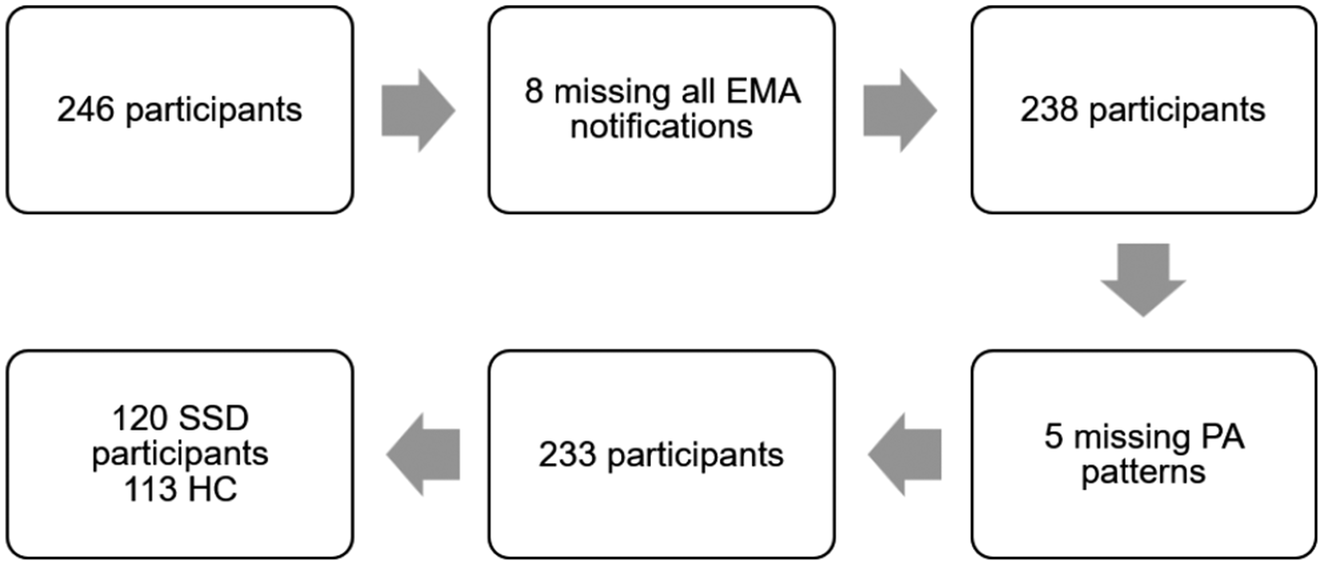
Between October 2020 and October 2021, a total of 137 eligible participants with SSD (79 residents, 58 outpatients) and 113 HC (matched for age and sex) were initially recruited from the 10 participating centers for ecological monitoring. Participants were individuals aged 20–55 years with a diagnosis of SSD according to DSM-5 criteria (American Psychiatric Association, 2013). Eligibility required fluency in spoken and written Italian. Exclusion criteria included inability to provide informed consent, significant cognitive impairment (Mini-Mental State Examination score <24, adjusted for age and education), recent diagnosis (within the past 6 months) of substance use disorder per DSM-5 criteria, history of clinically relevant head trauma, or presence of cerebrovascular or other neurologic conditions. Figure 1 presents a flowchart illustrating the patient recruitment and allocation process, including the total number of patients assessed for eligibility, reasons for exclusion, and final allocation into study groups. Of the 246 enrolled participants, 13 were excluded from the final analysis due to incomplete data acquisition: 8 participants with SSD provided no EMA responses, and 5 participants (of which 2 were HC and 3 were people with SSD) had no actigraphy recordings. Given that this investigation specifically examines the relationship between subjective mood states and patterns in PA, participants with missing data for either measure were excluded to ensure the accuracy of data analysis. To guarantee a balanced comparison, HC were recruited through public advertisements and snowball sampling techniques and were matched with the clinical sample based on sex and age group (20–24, 25–29, 30–34, 35–39, 40–44, 45–49, and 50–55 years). Sample size calculations are detailed in the study protocol (de Girolamo et al., Reference de Girolamo, Rocchetti, Benzi, Agosta, Casiraghi, Ferrari, De Franceschi, Macis, Pogliaghi and Starace2020). Participants received comprehensive information about the study and had the opportunity to ask questions. The treating clinician completed the assessment tools partially, while Research Assistants (RAs) supported self-reported questionnaires when necessary. To minimize methodological biases, standardized clinical measures were employed (see the following sections). Before the ecological monitoring, participants attended a briefing session, during which RAs provided instructions on study procedures and best practices. The monitoring period concluded with a debriefing session, where RAs collected feedback on study acceptability and feasibility (Zarbo et al., Reference Zarbo, Agosta, Casiraghi, De Novellis, Leuci, Paulillo, Rocchetti, Starace, Zamparini and de Girolamo2022). Outpatients and HC received € 25 as reimbursement for travel expenses. All participants provided written informed consent before participation.
Study enrollment flowchart.

Assessment instruments
Table 1 summarizes the sociodemographic, health, mood, and PA characteristics of the participants. The psychiatric history of participants with SSD was assessed using a structured ad hoc survey, capturing information on current diagnosis, illness duration, and lifetime psychiatric hospitalizations. Psychopathology was assessed using the 24-item Brief Psychiatric Rating Scale (BPRS) (Overall & Gorham, Reference Overall and Gorham1962; Zanello, Berthoud, Ventura, & Merlo, Reference Zanello, Berthoud, Ventura and Merlo2013). The severity of negative symptoms was measured with the Brief Negative Symptom Scale (BNSS) (Mucci et al., Reference Mucci, Galderisi, Merlotti, Rossi, Rocca, Bucci, Piegari, Chieffi, Vignapiano and Maj2015; Strauss et al., Reference Strauss, Keller, Buchanan, Gold, Fischer, McMahon, Catalano, Culbreth, Carpenter and Kirkpatrick2012). Functional levels were evaluated using the 43-item Specific Levels of Functioning Scale (SLOF) (Mucci et al., Reference Mucci, Rucci, Rocca, Bucci, Gibertoni, Merlotti, Galderisi and Maj2014; Schneider & Struening, Reference Schneider and Struening1983). The World Health Organization Disability Assessment Schedule 2.0 (WHODAS 2.0) was used to assess disability levels (Ustün et al., Reference Ustün, Chatterji, Kostanjsek, Rehm, Kennedy, Epping-Jordan, Saxena, von Korff and Pull2010). Details on clinical assessment tools are provided in Table S1 in Supplementary Material 2.
Sociodemographic, health, mood, and PA characteristics

Table 1. Long description
The table consists of four columns: Characteristic, H C (N = 113), S S D participants (N = 120), and p-value.
* Sex: H C is 41.0 percent female and 59.0 percent male. S S D is 36.0 percent female and 64.0 percent male. p-value is .500.
* Age: Both groups have a median age of 43.0. p-value is .800.
* Marital status: Significant difference (p < .001). 82.0 percent of S S D participants are not married or not cohabiting compared to 26.0 percent of H C. 50.0 percent of H C are married compared to 5.0 percent of S S D.
* Education: H C mean is 16.6 years; S S D mean is 12.0 years. p-value is < .001.
* Working status: 92.9 percent of H C are working compared to 62.5 percent of S S D. p-value is .006.
* Body mass index (B M I): H C mean is 24.3; S S D mean is 27.5. p-value is < .001.
* Smoking (cigarettes per day): H C mean is 9.9; S S D mean is 17.8. p-value is < .001.
* Mood: H C mean is 45.9; S S D mean is 34.3. p-value is .004.
* Physical activity (E N M O): H C mean is 49.3; S S D mean is 37.7. p-value is < .001.
Bold p-values indicate statistical significance at the p < .05 level.
a Bold values indicate statistical significance at the p < .05 level.
Assessment of daily time use and emotions
Self-reported emotions and daily activities were assessed using a smartphone-based EMA application developed specifically for the project. The mobile application consisted of three sections: current activities, interpersonal contacts, and mood. Items regarding mood were selected from the EMA Item Repository (https://osf.io/kg376/), which provides detailed psychometric information on validated EMA items. Participants received semirandomized notifications 8 times per day for 7 consecutive days, divided into the following time slots: 8–10 a.m., 10 a.m.–12 p.m., 12 p.m.–2 p.m., 2–4 p.m., 4–6 p.m., 6–8 p.m., 8–10 p.m., 10 p.m.–12 a.m. The mood was rated using different adjectives by asking participants how they felt that emotion at that current moment. The participants had to tap on the screen and select from a bar ranging from 0 to 100 (0 = not at all; 100 = a lot) for their emotions. According to the aims of the present study, the only responses that were considered for the assessment of mood were “Happy” and “Sad.” Mood was computed as a “Happy” minus “Sad” score at each EMA evaluation, resulting in a score ranging from −100 (full sadness) to 100 (full happiness). Details of mood assessment can be found in Table S1 in Supplementary Material 3.
Assessment of physical activity and data processing
PA monitoring was conducted using the ActiGraph GT9X Link, a wearable accelerometer-based biosensor. Participants wore the ActiGraph on the nondominant wrist for 7 consecutive days, corresponding to the same period as the EMA monitoring. Individual GT9X files were processed to estimate Euclidean Norm Minus One (ENMO) (van Hees et al., Reference van Hees, Gorzelniak, Dean León, Eder, Pias, Taherian, Ekelund, Renström, Franks, Horsch and Brage2013) using a 60s epoch with no threshold on daily valid hours. ENMO captures the total movement as a combination of accelerations along the three axes while adjusting for gravity via a fixed gravitational unit offset.
Statistical analyses
Data were summarized using mean and standard deviation (SD) or median and interquartile range (IQR) for quantitative variables, counts, and percentages for qualitative variables. Comparisons of sociodemographic and clinical variables between participants with SSD and HC were performed using the Chi-squared test for categorical variables and the independent samples t-test for continuous variables.
The compliance to EMA evaluation among groups was evaluated by modeling the number of responses using a GLM with Negative Binomial distribution family, with the number of app requests received as an offset.
Modeling the relationship between mood and physical activity
To examine the association between daily mood and PA, we employed a GLMM with a skewed normal distribution, adjusting for group membership. The outcome variable was mood, and the main predictor was the standardized median daily value of PA preceding each EMA evaluation. The aim was to assess whether the strength of the day-level association between mood and PA differed across the SSD and HC groups.
Since the available full data structure is very rich, with repeated real-time evaluations of mood using EMA throughout the day, and continuous PA monitoring via ActiGraph, we developed a model to jointly estimate:
-
1. the association of PA with subsequent mood evaluations;
-
2. the association of mood levels with subsequent PA patterns.
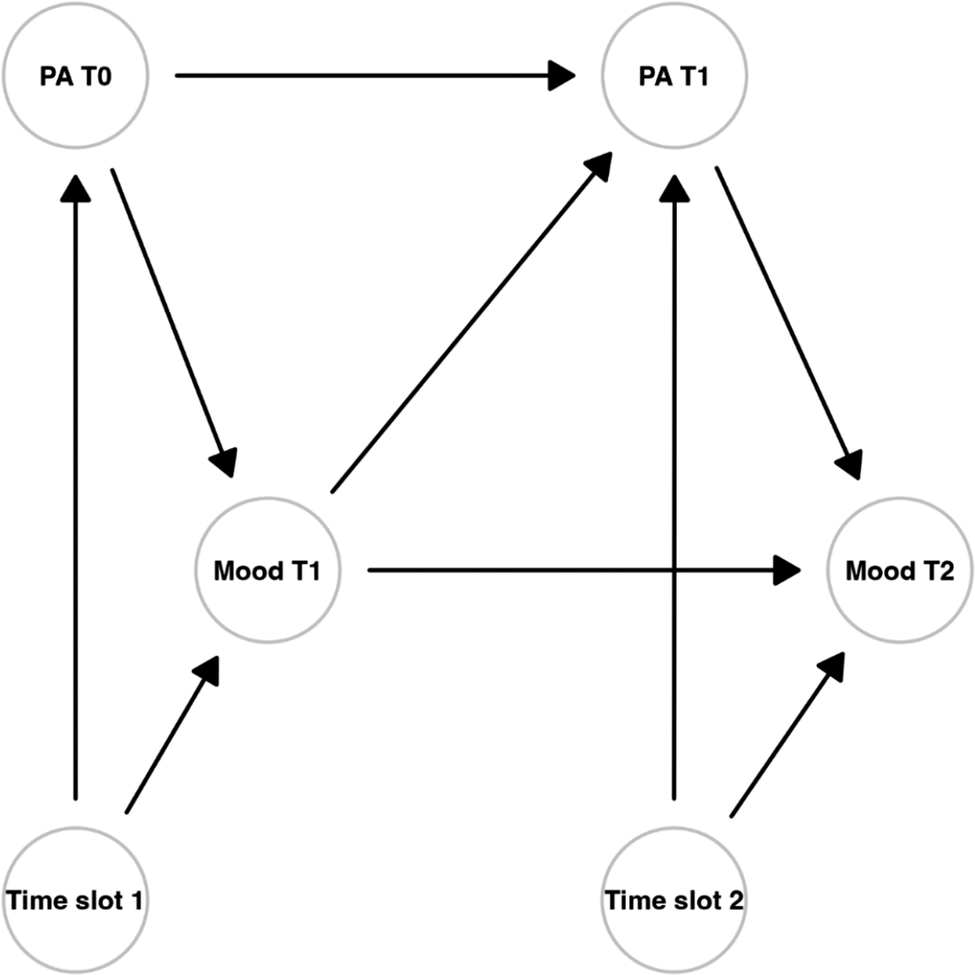
For each EMA evaluation, we computed the average PA level during the 30 minutes preceding and following the mood assessment. The 30-minute temporal lag was selected based on theoretical, empirical, and practical considerations from the EMA literature. Acute postexercise affective responses, including mood enhancement, typically manifest within 15–30 minutes following activity cessation (Sala et al., Reference Sala, Rosenfield and Baldwin2024). This timeframe captures proximal bidirectional dynamics while balancing feasibility in real-time monitoring protocols (Dunton, Liao, Kawabata, & Intille, Reference Dunton, Liao, Kawabata and Intille2012; Shiffman et al., Reference Shiffman, Stone and Hufford2008). Shorter intervals (e.g., <10 minutes) are prone to noise from instantaneous fluctuations, whereas longer windows (>60 minutes) risk dilution by intervening variables like additional activity bouts or external triggers (Kanning, Ebner-Priemer, & Schlicht, Reference Kanning, Ebner-Priemer and Schlicht2013). This lag thus optimizes temporal specificity and signal-to-noise ratio for within-subject mood–PA associations in naturalistic settings, consistent with ambulatory assessment best practices. The model structure is graphically represented in Figure 2 using a Directed Acyclic Graph (DAG). For each participant group, we assumed:
-
• a direct association of PA (at time t-1) with mood (at time t, 30 minutes later);
-
• a reciprocal effect of mood on PA (evaluated 30 minutes later);
-
• first-order autocorrelation between successive mood evaluations;
-
• first-order autocorrelation between successive PA measurements;
-
• a potential confounding effect of the time slot in which mood was assessed, accounting for circadian influences on both mood and PA levels.
Directed acyclic graph (DAG) of physical activity and mood relationships. This figure shows the joint effect of physical activity on each mood evaluation and of mood levels on following PA patterns. For each EMA evaluation, the average PA level in the previous 30 minutes was estimated.

The DAG was translated into a statistical multilevel model fitted using a Bayesian Network approach (Bayesian Vector Autoregression, BVAR) with estimation based on Monte Carlo Markov Chain (MCMC) sampling, enabling multivariate and hierarchical analysis as required for our data structure.
The mood model accounted for:
-
• the PA → mood effect and its interaction with the participant group;
-
• a first-order lag effect;
-
• a time-slot effect;
-
• age and gender as covariates.
Similarly, the PA model accounted for:
-
• the mood → PA effect and its interaction with the participant group;
-
• a first-order lag effect;
-
• a time-slot effect;
-
• age and gender as covariates.
Before model fitting, PA and mood scores were standardized to facilitate the efficient exploration of the parameter space during MCMC sampling and to simplify prior distribution selection. Priors were chosen through prior predictive simulation via pre-data prediction inspection and by selecting prior parameters while producing plausible outcomes distributions. For both PA and Mood models, we used a likelihood based on a skewed normal distribution.
EMA analyses started from the 10:00–12:00 time slot, as the modeling procedure required a previous time point (t–1) for computing lagged effects. Thus, mood evaluations from the first time slot (08:00–10:00) were used as baseline predictors and were excluded from the outcome analyses.
Both GLMM and BVAR models also accounted for the number of EMA responses provided by each patient, therefore adjusting for the differential EMA response rate.
Model fitting was performed in R (version 4.5.2) using Stan (version 2.38.0) and Cmdstanr (Gabry, Češnovar, Johnson, & Bronder, Reference Gabry, Češnovar, Johnson and Bronder2024), using four independent chains with 1000 iterations each. Model fit adequacy was checked by evaluating R-hat values (to be approximately equal to 1), effective sample size, and visual inspection of chains’ trajectories.
Results
Participant characteristics
Our final analysis included 120 participants with SSD (52.0%) and 113 HC (48.0%). As shown in Table 1, participants with SSD and HC were comparable in terms of age and sex. However, participants with SSD showed significantly lower educational and employment levels, were more often unmarried or not cohabiting, and had worse health indicators, including higher BMI, greater cigarette consumption, lower mood scores, and reduced PA levels.
Participants with SSD showed significant clinical impairment, moderate symptom severity (BPRS), prominent negative symptoms (BNSS), and marked functional limitations (SLOF and WHODAS 2.0) as shown in Table 2. On average, they had a long illness duration (17.7 years) and substantial psychiatric hospitalization history, with most of them hospitalized for over one year.
Clinical characteristics of SSD participants

Table 2. Long description
The table contains two columns: Variables and S S D participants (N = 120).
* Illness duration: Mean (S D) is 17.7 (9.7); Median (minimum to maximum) is 18.0 (1.0 to 40.0).
* Lifetime duration of psychiatric hospitalization (years), n (%):
- Less than 1 year: 54 (45.0%).
- 1 to 5 years: 28 (23.3%).
- Greater than 5 years: 38 (31.7%).
* Brief Psychiatric Rating Scale (B P R S): Mean (S D) is 44.5 (12.1); Median (minimum to maximum) is 42.0 (26.0 to 78.0).
* Brief Negative Symptom Scale (B N S S): Mean (S D) is 20.7 (14.3); Median (minimum to maximum) is 21.0 (8.0 to 55.0).
* Specific Levels of Functioning scale (S L O F): Mean (S D) is 182.6 (20.0); Median (minimum to maximum) is 186.0 (125.0 to 215.0).
* World Health Organization Disability Assessment Schedule 2.0 (W H O D A S 2.0): Mean (S D) is 10.7 (7.9); Median (minimum to maximum) is 9.0 (0.0 to 29.0).
* Antipsychotic drugs: Mean (S D) is 1.2 (0.4); Median (minimum to maximum) is 1.0 (1.0 to 3.0).
We evaluated the EMA response rate among patients, as a fraction of returned response over the number of alerts received. Both participant groups showed some degree of reduced compliance, but significantly less in SSD versus HC (Response rate = 0.73, CI 95% 0.66–0.81, p < .001) as shown in Table S2 in Supplementary Material 3.
Daily association between PA and mood
We examined the association between PA and mood using a GLMM with daily mean mood as the outcome variable and standardized median daily PA as the primary predictor. The model incorporated a skewed normal family distribution to account for the non-normal distribution of mood ratings. The analysis revealed no significant main effect of PA on mood (β = 0.02, 95% CI: −0.06 to 0.09, P = .68). However, participants with SSD had significantly lower daily mood levels compared with HC (β = −0.29, 95% CI: −0.55 to −0.07, P = .01). The interaction between PA and group (SSD versus HC) was not significant (β = 0.08, 95% CI: −0.02 to 0.18, P = .133). Diurnal pattern analysis (Figure 3) shows distinct mood trajectories between groups: HC exhibited progressive mood improvement throughout the day, reaching peak levels during evening hours (6:00 PM to 12:00 AM), whereas individuals with SSD displayed consistently lower and more stable mood patterns with minimal diurnal variation. EMA response level compliance did not show any relevant effect on mood levels (β =0.03, 95% CI: −0.05 to 0.11, P = .504). To further characterize interindividual variability in circadian patterns, Figures a and b in Supplementary Material 4 display the individual-level predicted trajectories of mood and PA across seven time slots (10:00–24:00) for HC and patients with SSD, respectively. Each dot represents a single individual’s predicted value at a given time slot, with colors distinguishing the seven measurement windows. In HC, mood predicted values are densely clustered between approximately −1 and + 1 across all time slots, indicating a relatively homogeneous and stable circadian pattern with limited between-person dispersion. In patients with SSD, the distribution is markedly wider: while the majority of values overlap with the HC range, a substantial subgroup shows predicted mood values extending below −2 and reaching −4, with extreme low values observed across multiple time slots and particularly in the late afternoon and evening windows (14:00–22:00). A similar pattern is visible for PA: HC showing a progressive decline in predicted PA from the morning peak toward the late evening, with relatively compact individual spread; patients with SSD display the same directional trend but with considerably greater dispersion at each time slot, including extreme low outliers reaching −3 and below, predominantly in the 20:00–24:00 window. Taken together, these figures visually confirm that interindividual variability in both mood and PA circadian patterns is substantially greater in SSD than in HC, consistent with the pattern reported in the main text.
Mood and physical activity fluctuations in mood levels (a) and physical activity (b) according to time of the day.

Figure 3. Long description
Two side-by-side dot plots labeled a and b. Both plots share a common x-axis labeled Group with two categories: H C and S S D. A legend to the right of each plot defines seven time slots: 10-12 (salmon), 12-14 (gold), 14-16 (green), 16-18 (teal), 18-20 (blue), 20-22 (purple), and 22-24 (pink).
Panel a: The y-axis is labeled Mood ranging from -0.2 to 0.2.
* For the H C group, mood shows a general upward trend from 0.0 at 10-12 to approximately 0.15 at 22-24.
* For the S S D group, mood shows a downward trend starting near 0.0 at 10-12 and decreasing to approximately -0.08 at 22-24.
Panel b: The y-axis is labeled Physical activity ranging from -0.75 to 0.25.
* For the H C group, activity levels are relatively stable and positive between 10-12 and 18-20, followed by a sharp drop to approximately -0.4 for the 20-22 and 22-24 slots.
* For the S S D group, activity levels show a continuous linear decline from approximately 0.0 at 10-12 down to approximately -0.55 at 22-24.
Trends in mood and PA among participants with SSD and HC
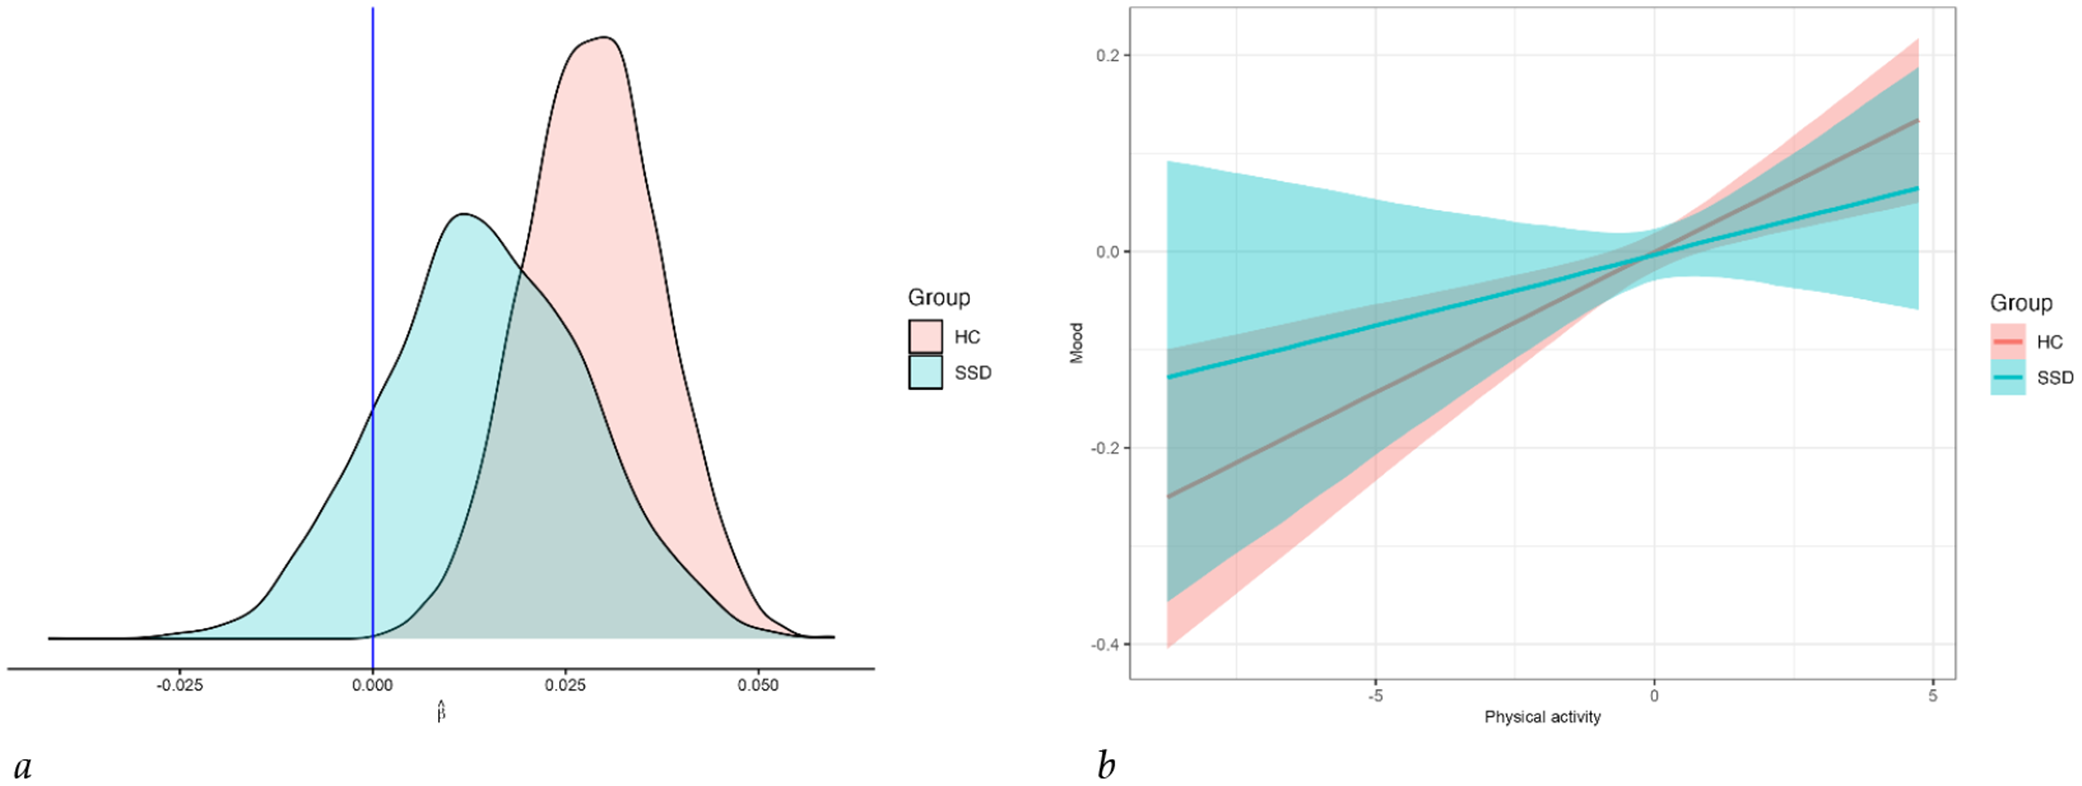
Figure 4 illustrates the posterior distribution (panel a) and the estimated effect of PA (panel b) on mood for both groups. Among HC, we found robust evidence for a positive association between PA and subsequent mood (posterior probability = 99.9%), indicating that increased PA was followed by higher mood levels.
Posterior distribution (a) and estimated effect of physical activity on mood in SSD participants and HC (b).

Figure 4. Long description
Panel a is a density plot. The x-axis is labeled beta-hat with values from negative 0.025 to 0.050. A vertical blue line marks the zero point. Two overlapping distributions are shown. The S S D group (light blue) has a peak centered around 0.015. The H C group (light pink) has a taller, narrower peak centered further right at approximately 0.030.
Panel b is a linear regression plot. The x-axis is labeled Physical activity with values from negative 5 to 5. The y-axis is labeled Mood with values from negative 0.4 to 0.2. Both groups show a positive linear correlation where mood increases as physical activity increases. The H C group (red line and shaded ribbon) shows a steeper slope, starting at negative 0.35 on the left and rising to 0.2 on the right. The S S D group (teal line and shaded ribbon) shows a shallower slope, starting at negative 0.12 and rising to 0.08. The two regression lines intersect near the zero point on the x-axis.
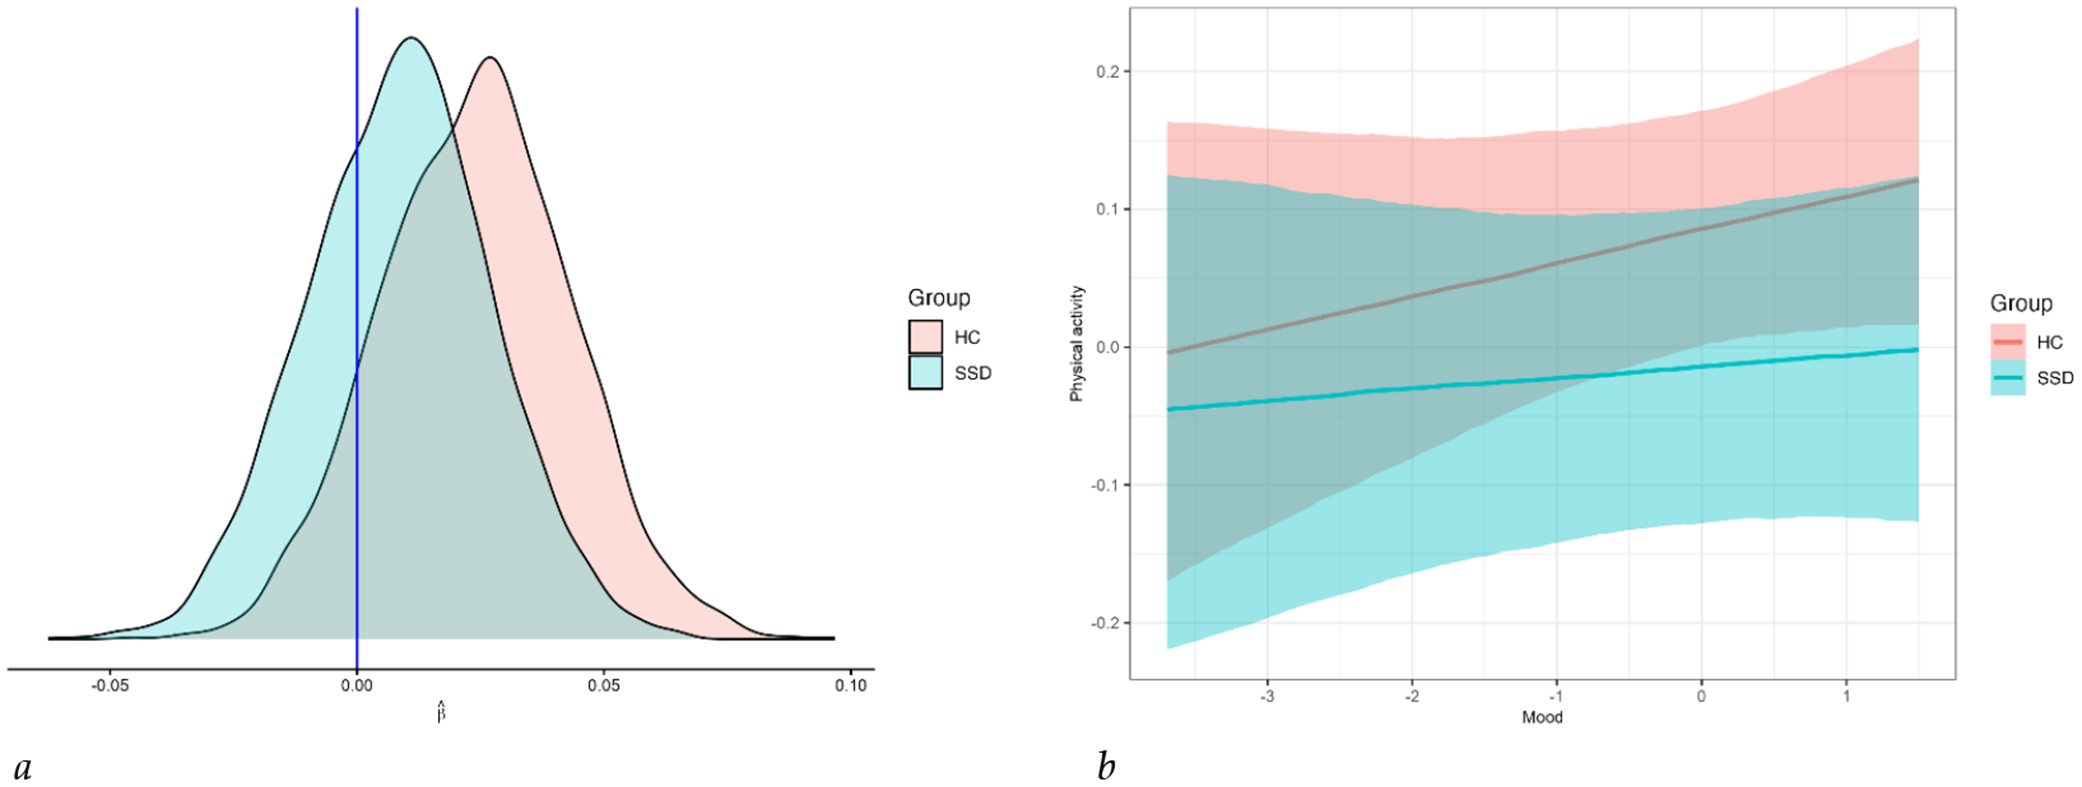
In contrast, the posterior probability for a positive PA → mood association in participants with SSD was 86.3%. Figure 5 illustrates the posterior distribution (panel a) and the estimated association between mood and PA in participants with SSD and HC (panel b), with posterior probabilities of 89.4% in HC and 67.8% in SSD for beta values greater than zero. The posterior prediction plots for mood and PA are shown in Figures S1 and S2 in Supplementary Material 5, respectively, and display the model’s fit and the distribution of individual trajectories.
Posterior distribution (a) and estimated effect of mood on physical activity in SSD participants and HC (b).

Figure 5. Long description
Panel a is a density plot. The x-axis is labeled beta-hat and ranges from negative 0.05 to 0.10. A vertical blue line marks the zero point. Two overlapping bell-shaped distributions are shown. The S S D group distribution in light blue is centered slightly to the right of zero. The H C group distribution in light pink is shifted further to the right, peaking around 0.03.
Panel b is a scatter plot with linear regression lines. The x-axis is labeled Mood and ranges from negative 3 to 1. The y-axis is labeled Physical activity and ranges from negative 0.2 to 0.2.
- The H C group is represented by a pink line with a positive slope, starting near 0.0 on the y-axis and rising to approximately 0.12. It is surrounded by a wide pink shaded confidence interval.
- The S S D group is represented by a teal line with a much flatter, slightly positive slope, starting near negative 0.05 and ending near 0.0. It is surrounded by a teal shaded confidence interval that overlaps significantly with the H C group.
Discussion
This multimodal ecological study revealed that participants with SSD reported significantly lower daily mood than HC, but daily-level GLMM analyses detected no significant association between PA and mood in either group. To overcome these limitations, we applied a Bayesian multilevel model. This approach successfully captured dynamic, bidirectional associations between PA and mood. Among HC, higher levels of PA were associated with subsequent higher mood, while positive mood predicted increased PA. Conversely, participants with SSD exhibited heterogeneous and inconsistent PA–mood interactions, indicating greater interindividual variability. Bayesian multilevel models with temporal lags, however, uncovered robust within-day bidirectional associations in HC (PA → mood: 99.9%; mood → PA: 89.4%), which were markedly attenuated and more heterogeneous in SSD (PA → mood: 86.3%; mood → PA: 67.8%). Diurnal analyses further showed blunted mood and activity rhythms in SSD, with the most pronounced between-group differences occurring during evening hours (6:00 PM to 12:00 AM), when mood continued to improve in HC while remaining unchanged in SSD. These temporal patterns warranted further investigation through Bayesian time-varying analyses.
These findings demonstrate that conventional daily aggregations obscure critical intraday PA–mood dynamics that Bayesian approaches successfully capture, revealing more robust bidirectional couplings in HC than in SSD. These temporal associations are compatible with bidirectional hypotheses but, given the observational design and potential unmeasured confounders (e.g., medication regimens, illness severity), do not permit causal inference. Intervention studies are needed to test whether enhancing PA–mood coupling can improve clinical outcomes in SSD. The robust temporal association between PA and subsequent mood among HC aligns with previous literature and highlights the potential of behavioral activation via PA as a universal mental health strategy (Posadzki et al., Reference Posadzki, Pieper, Bajpai, Makaruk, Könsgen, Neuhaus and Semwal2020). However, the attenuated and more heterogeneous associations observed in participants with SSD point to substantial interindividual variability in emotional reactivity to PA. The attenuated and heterogeneous PA → mood coupling in SSD likely reflects disorder-specific mechanisms beyond generic interindividual variability. Prominent negative symptoms such as anhedonia and avolition – core features of our sample (Table 2) – impair reward anticipation and motivational drive, disrupting the translation of physical effort into affective reinforcement (Gard et al., Reference Gard, Kring, Gard, Horan and Green2007; Millan, Fone, Steckler, & Horan, Reference Millan, Fone, Steckler and Horan2014). Neuroimaging evidence consistently shows ventral striatal hypoactivation during reward processing in schizophrenia, which correlates with apathy severity and reduced behavioral activation following rewarding stimuli like exercise (Kirschner et al., Reference Kirschner, Hager, Bischof, Hartmann, Kluge, Seifritz, Tobler and Kaiser2016; Segarra et al., Reference Segarra, Metastasio, Ziauddeen, Spencer, Reinders, Dudas, Arrondo, Robbins, Clark, Fletcher and Murray2016). Antipsychotic medications, used by most participants, may further blunt acute mood responses to PA through D2 receptor blockade, which dampens dopaminergic reward signaling essential for hedonic tone (Firth et al., Reference Firth, Siddiqi, Koyanagi, Siskind, Rosenbaum, Galletly, Allan, Caneo, Carney, Carvalho, Chatterton, Correll, Curtis, Gaughran, Heald, Hoare, Jackson, Kisely, Lovell and Stubbs2019). These factors systematically weaken activity–mood linkage, explaining why Bayesian models detected robust temporal dynamics in HC but only probabilistic, variable effects in SSD – supporting targeted interventions addressing reward deficits alongside behavioral activation.
Despite these complexities, PA interventions in participants with SSD have been associated with significant mood improvements, including reduced anxiety and tension levels, decreased stress and irritability, and enhanced overall psychological well-being, underscoring the therapeutic potential of structured PA plans even in populations with diminished responsiveness (Holley, Crone, Tyson, & Lovell, Reference Holley, Crone, Tyson and Lovell2011). The significantly lower mood reported by participants with SSD likely reflects both primary affective disturbances and secondary consequences of social isolation and sedentary behavior (Saarni et al., Reference Saarni, Viertiö, Perälä, Koskinen, Lönnqvist and Suvisaari2010).
Participants with SSD also demonstrated reduced PA levels and blunted diurnal variability in both mood and activity, consistent with affective flattening and diminished behavioral flexibility typical of negative symptoms such as anhedonia and avolition (D’Anna et al., Reference D’Anna, Zarbo, Cardamone, Zamparini, Calza, Rota, Correll, Rocchetti, Starace, de Girolamo, Barlati, Baroncelli, Besana, Boero, Clerici, Di Michele, Durbano, Foia and Impicci2023; Kaiser et al., Reference Kaiser, Lyne, Agartz, Clarke, Mørch-Johnsen and Faerden2017; Zarbo et al., Reference Zarbo, Rota, Calza, Crouter, Ekelund, Barlati, Bussi, Clerici, Placenti, Paulillo, Pogliaghi, Rocchetti, Ruggeri, Starace, Zanolini, Zamparini and de Girolamo2023). While both groups exhibited a general midday peak and evening decline in mood, participants with SSD showed a significantly reduced emotional reactivity to PA fluctuations. The positive PA–mood association observed in HC was attenuated and more variable among participants with SSD, consistent with prior evidence of reduced mood reactivity and motivational impairments in this population (Dauwan et al., Reference Dauwan, Begemann, Heringa and Sommer2015; Firth et al., Reference Firth, Rosenbaum, Stubbs, Gorczynski, Yung and Vancampfort2016; Kimhy et al., Reference Kimhy, Vakhrusheva, Bartels, Armstrong, Ballon, Khan, Chang, Hansen, Ayanruoh, Lister, Castrén, Smith and Sloan2015). These findings highlight an important clinical insight: the relationship between mood and PA is influenced by intraday temporal variability and by potential bidirectionality. Daily aggregated analyses may overlook critical temporal dependencies inherent to dynamic psychological phenomena, even when employing sophisticated linear mixed models. Bayesian hierarchical modeling proved superior in capturing the complexity and individual variability of real-time mood–activity relationships.
Limitations
Several limitations should be acknowledged. First, while our findings suggest a beneficial role of PA in mood patterns, causal inference remains limited due to the observational nature of this study. The brief 1-week study duration restricts our ability to extrapolate findings to long-term levels of PA, underscoring the necessity for extended follow-up periods in future investigations. Second, although participants with a recent DSM-5 substance use disorder were excluded, residual confounding by occasional or subclinical substance use cannot be fully ruled out in outpatients. In contrast, such use is highly unlikely in residential patients given the structured, supervised setting, and all outpatients were in active treatment, which reduces (but does not eliminate) the probability of uncontrolled substance use. Third, the use of a single EMA item to index momentary mood and the reliance on one actigraphy-based PA metric may not fully capture the multidimensional nature of affect and activity patterns. Finally, the sample was recruited from Italian mental health services and residential facilities, which may limit generalizability to other health-care systems and cultural contexts.
Conclusion
Our findings highlight the need to move beyond generalized, one-size-fits-all approaches to PA in SSD. The heterogeneous emotional responses to PA observed in participants with SSD suggest the existence of distinct behavioral responsivity profiles. Identifying these profiles through real-time ecological data could inform the development of personalized, precision-based interventions. Embedding mobile sensing technologies within stepped-care models may support scalable, adaptive strategies, enabling clinicians to monitor individual trajectories and tailor interventions to maximize clinical impact.
Supplementary material
The supplementary material for this article can be found at http://doi.org/10.1017/S0033291726105406.
Data availability statement
Dataset referring to this manuscript is published with open access on Zenodo platform and accessible at this link: https://zenodo.org/records/15780349.
Acknowledgements
DiAPASon (DAily time use, Physical Activity, quality of care and interpersonal relationship in patients with Schizophrenia spectrum disorders) consortium includes: DMH, ASL Ancona (P. D’Elia, S. Impicci, M. Mari, F.M. Quintieri); RF Passaggi Srl-Oricola, Aquila (A. Bellotta, F. Jacoponi, A. Maurizi, L. Tranquilli); DMH, ASL Bari (V. Latorre, G. Nappi, D. Semisa); DMH, ASST Bergamo Ovest (S. Fenaroli, E. Monzani); DMH, ASST Spedali Civili Brescia (S. Barlati, M. Facchi, N. Necchini, A. Vita); IRCCS Fatebenefratelli, Brescia (G. de Girolamo, A. Martinelli, G. Tura, M. Zamparini, C. Zarbo); Dept of Molecular and Translational Medicine, University of Brescia (S. Calza, M. Rota); RF Centro Ippocrate CRA Macchiareddu, Cagliari (C. Lanzi, P. Paribello, B. Piccicacchi, C. Schiavo); Fatebenefratelli Sant’Ambrogio e Sacro Cuore di Gesù, Cernusco sul Naviglio, Milano (R. Bussi, D. Di Cosimo, G.M. Giobbio, R. Placenti); DMH, ASST Cremona (G. Giordano, C. Greco, I. Rossoni, F. Spinogatti); DMH ASST Rhodense, Garbagnate (C. Rovera, M. Toscano); DMH, ASL 3 Genova (L. Ghio, L. Lattanzi, D. Malagamba, M. Tosato); RF CREST ‘La Perla’, Grumello del Monte, Bergamo (L. Rancati, S. Zizolfi); DMH, ASST Lodi (G. Cerveri, C. Cibra, V. Cuman, E. Pionetti); DMH, ASST Melegnano and Martesana, Melegnano (A. Di Gregorio, F. Durbano, L. Fussi, V. Masseroni); Fondazione Castellini ONLUS, Melegnano (A. Cicceri, A. de Giovanni); DMH, AUSL Modena (S. Agosta, A. de Novellis, F. Starace); DMH, ASST Monza (C. Calini, M. Clerici, R. Pessina); DMH, Napoli 2 Nord (A. Cucciniello, C. D’Anna, M.G. Foia, M.C. Miranda); DMH, ASST Pavia (L. Casiraghi, P. Politi, M. Rocchetti, A. Silva); RF Fondazione Giuseppe Costantino, Pavia (M. Marina, S. Panigada, S. Riavera); DMH, ASL Pescara (A. Cirincione, V. Di Michele, F. Paolone); DMH, AUSL Parma (E. Leuci, G. Paulillo, L. Pelizza); DMH USL Toscana Centro, Prato (A. Baroncelli, G. Cardamone, G. D’Anna, L. Tatini); DMH ASL Roma1 (G. Ducci, A. Maone, T.A. Poliseno, B. Rufelli); Fatebenefratelli Beata Vergine Consolata, San Maurizio Canavese (M.E. Boero, E. Castagno, F. De Dominicis); DMH, ASL Teramo (C. Della Croce, P. Giosuè); DMH, ASL Città di Torino (F. Facchini, G. Gallino); RF Progetto Du Parc, Torino (J. Orticola, N. Rossetto); DMH, AP-SCALES Trento (M. Goglio, F. Lucchi); DMH, ULSS 2 Marca Trevigiana, Treviso (A. Brega, R. De Marchi, P. Di Prisco); RF Le Vele ONLUS, Trezzo sull’Adda e Vaprio d’Adda (E. Bonetti, L. Colasuonno, A. Pozzi, M. Roncalli); DMH, ASUGI Trieste (R. Mezzina, A. Norbedo, A. Rippa); DMH, AOUI Verona (E. Canova, E. Dal Corso, C. D’Astore, M. Ruggeri); Dept of Neurosciences, University of Verona (D. Bertorelle, S. Pogliaghi); RF CTRP Associazione Don Giuseppe Girelli, Verona (G. Ferro, G. Gardelli, S. Pagani, A. Signoretti); DMH ULSS 8 Berica, Vicenza (I. Rodolfile, R. Tessari, S. Zanolini); RF CREST, Vinago (C.M. Dentali, M. Minotto). We also thank Dr. Nensi Dedja for her valuable assistance with the linguistic editing of the manuscript. We also used ChatGPT (OpenAI, GPT-4, July 2025 version) to assist only with language editing and stylistic refinement of the manuscript. The tool was not used to generate scientific content or interpret data. All AI-assisted suggestions were reviewed and verified by the authors.
Author contribution
Dr. Giovanni de Girolamo had full access to all of the data in the study and takes responsibility for the integrity of the data and the accuracy of the data analysis. Conceptualization: G.deG., C.Z., S.C., E.C.; Funding acquisition: G.deG., S.C.; Investigation: G.deG., C.Z.; Methodology & Formal analysis: S.C., M.C., D.M.; Supervision: E.C., M.C., G.deG., S.C.; Writing - original draft: E.C., M.C., S.C.; Writing - review & editing: E.C., M.C., A.M., C.Z., M.M., G.deG.
Funding statement
The DiAPAson project was funded by the Italian Ministry of Health (Bando per la ricerca Finalizzata 2018: RF-2018-12365514). This work was also supported by The Italian Ministry of Health (Ricerca Corrente). The Ministry of Health has no role in the analyses and interpretation of the study findings. Prof. Stefano Calza was supported by research grants from the Italian Ministry of University (PRIN projects no. 2022SYXEHJ_002).
Competing interests
The authors declare no conflict of interest.
Ethical standard
The study has been approved by the Ethical Committees (ECs) of the three main participating centers (EC of IRCCS Istituto Centro San Giovanni di Dio Fatebenefratelli, 31/07/2019; no. 211/2019; EC of Area Vasta Emilia Nord, 25/ 09/2019; no. 0025975/19), and EC of ASST of Pavia, 02/09/2019, no. 20190075685) and by the ECs of all participating sites.
Patient consent statement
All participants with SSD included in this study provided written informed consent for their participation. The consent process was conducted in accordance with ethical guidelines and regulations governing human research and was approved by the relevant ethics committees.
Permission to reproduce material from other sources
We have not reproduced any material from other source.





 Open access

