

1 Introduction
Research has shown that adult individuals whose first language (L1) is Mandarin demonstrate specific phonetic characteristics in the production of English spoken as a second language (L2) (Flege & Davidian Reference Flege and Davidian1984; Johnson & Newport Reference Johnson and Newport1991; Flege, Bohn & Jang Reference Flege, Bohn and Jang1997; Chen et al. Reference Chen, Robb, Gilbert and Lerman2001a, Reference Chen, Robb, Gilbert and Lermanb). Such phonetic characteristics in L2 English speech, based on previous studies examining sound features of L2, have been found to be manifested at both the segmental level and suprasegmental level of L2 speech, and are believed to result from the L1 influence (Flege & Davidian Reference Flege and Davidian1984, Munro Reference Munro1995, Flege et al. Reference Flege, Bohn and Jang1997, Langdon Reference Langdon1999). Some of those studies, for instance, examined acoustic characteristics of Mandarin-accented English (MAE) vowel productions at the segmental and suprasegmental levels for adult L2 (English) learners (Flege et al. Reference Flege, Bohn and Jang1997; Chen et al. Reference Chen, Robb, Gilbert and Lerman2001a, Reference Chen, Robb, Gilbert and Lermanb). In particular, Flege et al. (Reference Flege, Bohn and Jang1997) measured the fundamental frequency (F0) and first two formant frequencies (F1, F2) for four vowels, /i ɪ ɛ æ/, produced as MAE, and its results indicate that native Mandarin speakers who were the least proficient in speaking English showed the least similarity to native American English (AE) speakers in producing the F1 and F2 of English vowels. Also, Chen et al. (Reference Chen, Robb, Gilbert and Lerman2001a) performed an acoustic analysis of vowel productions in MAE compared to AE. Based on analysis of F1 and F2 frequencies for 11 English vowels, the study found that MAE differs significantly from AE for the majority of English vowel sounds. In a separate study by Chen et al. (Reference Chen, Robb, Gilbert and Lerman2001b), where sentence stress in MAE production was examined, measurements of F0, vowel duration, and vowel intensity were performed on four target vowel segments of the token sentence, and the study found that MAE speakers produce target vowel sounds with significantly higher F0, greater intensity, and different durations. This finding, once again, signifies the type of influence of L1 Mandarin on the production of L2 English.
Findings from the studies that compare the acoustic features of MAE to AE (Flege et al. Reference Flege, Bohn and Jang1997; Chen et al. Reference Chen, Robb, Gilbert and Lerman2001a, Reference Chen, Robb, Gilbert and Lermanb) attributed the characteristics of MAE to the differences of phonological patterns and structures, such as the difference in the vowel system and nature of tonicity (Karlgren Reference Karlgren1915–1926, Wu Reference Wu1964, Tiee Reference Tiee1969, Howie Reference Howie1976, Cheng Reference Cheng1987, Clark & Yallop Reference Clark and Yallop1995, Lee & Zee Reference Lee and Zee2003), that exist between the two languages (i.e. Mandarin and American English). In other words, Mandarin-accented English, as manifested by its different sound patterns from those of American English, may occur as a result of the transfer of phonological patterns and structures of L1 to the production of L2 (Eady Reference Eady1982, Flege & Davidian Reference Flege and Davidian1984, Cheng Reference Cheng1987, Chen et al. Reference Chen, Robb, Gilbert and Lerman2001a).
The hypothesis of phonological transferring during L2 speech (Trubetzkoy Reference Trubetzkoy1969), however, has its limitations because it does not explain why most young L2 learners tend to produce L2 sounds with little accent (Scovel Reference Scovel1969). One of the factors to be taken into account in supplementing the L1 phonological transfer theory is the age at which L2 (such as English) was acquired (Johnson & Newport Reference Johnson and Newport1991, Flege, Munro & MacKay Reference Flege and Strange1995). A widely accepted opinion is that after the ‘critical period’, it is natural for L2 learners to have difficulty articulating both segmental and suprasegmental features of L2 without being influenced by L1 features (Johnson & Newport Reference Johnson and Newport1991, Flege et al. Reference Flege, Munro and MacKay1995). The term of ‘critical period’, according to Lenneberg (Reference Lenneberg1967) and Scovel (Reference Scovel1969), is defined based on the onset of cerebral dominance/lateralization that is generally believed to occur around ages 11–14. More importantly, grounded on the well established theory that sound patterns are produced by actual motor activity and are initiated and integrated by neurophysiological mechanisms (Scovel Reference Scovel1969, Reference Scovel1989, Bhatnagar Reference Bhatnagar2002), the concurrence of cerebral dominance/lateralization at the ‘critical period’ is thought to inhibit an adult's capability to fully learn the sound pattern of L2 without accent (Scovel Reference Scovel1969, Reference Scovel1989; Flege et al. Reference Flege, Munro and MacKay1995).
However, it still remains unclear whether the cerebral-lateralization-induced constraint on adults’ capability in learning L2 sound pattern correlates with different neurophysiological control in L2 sound production, such as different vocal tract/motor steadiness (Gerratt Reference Gerratt1983). It seems that past acoustic studies on L2 speech have lacked the precision necessary to identify the specific neurophysiological mechanisms which are responsible for the phonetic differences between MAE and AE. An alternative acoustic approach that measures vocal tract steadiness (Gerratt Reference Gerratt1983) may help to evaluate the L2 sound production more precisely.
The first acoustic measurement of vocal tract steadiness was introduced by Gerratt (Reference Gerratt1983) and thereafter adopted in several clinic-oriented studies primarily because of its non-invasiveness and accessibility in measuring motor steadiness (Cannito Reference Cannito, Yorkston and Beukelman1989, Zwirner & Barnes Reference Zwirner and Barnes1992, Robb, Blomgren & Chen Reference Robb, Blomgren and Chen1998). The underlying principle of the acoustic protocol is that fluctuation of second formant frequency (FFF2) can be measured to examine the articulatory control surrounding vowel production, and FFF2 can serve as an index of motor steadiness of speech in examining potential neuromuscular control deficiency. The findings of these studies (Gerratt Reference Gerratt1983, Cannito Reference Cannito, Yorkston and Beukelman1989, Zwirner & Barnes Reference Zwirner and Barnes1992, Robb et al. Reference Robb, Blomgren and Chen1998) uncovered a significantly higher FFF2 being associated with neurologically disordered speech which was attributed to a lack of motor control of the vocal tract musculature during vowel production.
While the application of FFF2 to date is mostly adopted in examining disordered speech, the rationale of examining vocal tract steadiness using FFF2 is in fact directly derived from the longstanding acoustic-articulatory theory established by Peterson & Barney (Reference Peterson and Barney1952), under which a change in vocal tract configuration results in a change of formant frequency (such as F2). Stated differently, since FFF2 values calculated as an average of absolute difference in Hz among consecutive F2 values reflect momentary changes in shape of the vocal tract during vowel production, it is therefore believed that measurement of FFF2 provides an estimate of the degree of motor steadiness. In addition, since productions of speech are motor activities which require precise cerebral control (Lenneberg Reference Lenneberg1967; Scovel Reference Scovel1969, Reference Scovel1989; Bhatnagar Reference Bhatnagar2002), acoustic measures of FFF2 appear to be a suitable approach for studying L2 sound features with potentially different characteristics of vocal tract or motor steadiness that stem from reasons other than speech pathologies.
While discrepancies between phonetic characteristics in MAE and AE are deemed to be the natural outcome of brain reorganization (Lenneberg Reference Lenneberg1967, Scovel Reference Scovel1969), the impact on the specific segmental and suprasegmental characteristics of L2 speech due to a loss of neural plasticity in adult L2 learning (Lenneberg Reference Lenneberg1967; Scovel Reference Scovel1969, Reference Scovel1989; Bhatnagar Reference Bhatnagar2002) deserves further investigation. The loss of neural plasticity in L2 learning is evidenced in a number of studies focused on studying neural/cerebral activities and reorganization of brain regions associated with L2 processing, production and perception (Paulesu, Frith & Frackowiak Reference Paulesu, Frith and Frackowiak1993, Kent & Tjaden Reference Kent, Tjaden, Hardcastle and Lavers1997, Desmond & Fiez Reference Desmond and Fiez1998, Perani et al. Reference Perani, Paulesu, Galles, Dupoux, Dehaene, Bettinardi, Cappa, and Mehler1998, Trépanier et al. Reference Trépanier, Saint-Cyr, Lozano and Lang1998, Smith & Jonides Reference Smith and Jonides1999, Gaillard et al. Reference Gaillard, Hertz-Pannier, Mott, Barnett, LeBihan and Theodore2000, Müller et al. Reference Müller, Wächter, Barthel, Reuter and von Cramon2000, Callan et al. Reference Callan, Tajima, Callan, Kubo, Masaki and Akahane-Yamada2003, Tan et al. Reference Tan, Spinks, Feng, Siok, Perfetti, Xiong, Fox and Gao2003). According to these studies, the L2-learning-induced plasticity can be reflected by either increases or shifts in activity in cerebral regions, including the cerebellum, basal ganglia, supplementary motor area, and Broca's area. Corollarily, the loss of neural plasticity and/or reorganization of brain regions in L2 learning may, as suggested by Flege et al. (Reference Flege, Munro and MacKay1995), decrease an L2 speaker's sensorimotor control needed for L2 sound production. It is yet to be confirmed, however, whether such a decrease in L2 speaker's sensorimotor control may also lead to reduced vocal tract or motor steadiness which could lead to other phonetic characteristics of MAE in addition to the already found segmental and suprasegmental features of MAE (Flege et al. Reference Flege, Bohn and Jang1997; Chen et al. Reference Chen, Robb, Gilbert and Lerman2001a, Reference Chen, Robb, Gilbert and Lermanb).
The purpose of the present study is to determine whether or not reduced vocal tract steadiness – a possible result of L2-learning-induced brain reorganization – is a feature of vowel production shown in MAE. The measurement of FFF2 appears uniquely suited to address whether a decrease in motor control is apparent in speakers of MAE, since past research applying the FFF2 measure indicates that the measure is a useful and reliable indicator of the subtle articulatory control surrounding vowel production. Therefore, the measure would presumably be useful in examining the features of articulatory/motor control in the production of MAE vowels.
2 Method
2.1 Participants
The sample of participants consisted of two groups. The first group included 40 adults (20 males, 20 females) who spoke MAE. The average age of the MAE male speakers was 33 years (range = 30–46 years). The average age of the MAE female speakers was 28 years (range = 21–42 years). Criteria for selection of inclusion in the MAE group were: (i) a college education; (ii) formal instruction in English; (iii) the ability to speak standard Chinese Mandarin as judged by the author of this study, who is a native speaker of Mandarin; (iv) residing in the United States for a minimum of two years and speaking English a minimum of 30% of their daily conversation (self-assessment); and (v) the oral ability to read English fluently. On average, the MAE speakers began learning English as a second language at 12 years (range = 11–13 years for both female and male MAE speakers) and already received a minimum of eight years of formal English education throughout high school and college in China. Their average length of residence in the United States for MAE male and female speakers was 4.70 years (range = 2–17 years) and 3.75 years (range = 2–12 years), respectively. In addition, the average percentage of daily English usage for MAE male and female speakers based on self-report was 54% (range = 30–80%) and 51% (range = 30–90%), respectively. The second group consisted of 40 adults (20 males, 20 females) who spoke AE. The average ages of the AE males and females were 33 years (range = 22–46 years) and 27 years (range = 23–41 years), respectively. All MAE and AE participants were judged to have no speech, language, or hearing disorders.
2.2 Recording procedures
The procedure for collection of vowel samples was similar to the method reported by Hillenbrand et al. (Reference Hillenbrand, Getty, Clark and Wheeler1995). Each participant was asked to produce 11 vowels /i ɪ e ɛ æ ʌ u ʊ o ɔ ɑ/ that were placed into an /hvd/ context. Each /hvd/ word was positioned in the carrier sentence ‘Say ___ again’ and presented to each participant on an individual index card in random order. This task was completed three times by each participant. Recordings took place in a sound-attenuated booth. Recordings were made using a Marantz PMD-360 cassette recorder and a unidirectional dynamic microphone (Shure 515SD). The microphone was positioned approximately 20 cm from the speaker's mouth.
2.3 Acoustic analysis
Each /hvd/ word was analyzed acoustically using a computer-driven speech analysis system (Kay CSL 4100B). The output of the cassette recorder (Nakamichi MR-20) was digitized at a sampling rate of 11,025 Hz. Each /hvd/ word was displayed using a combination of amplitude-by-time waveforms and wideband (300 Hz) spectrograms. The onset of the vowel portion comprising each /hvd/ was defined as the onset of the first glottal pulsing as denoted via sound spectrograms. Two measures of FFF were calculated for each vowel segment, the fluctuation associated with F2 (FFF2) and the ratio of FFF2 to the mean F2 frequency (FFF2R). These measures were defined as follows:
FFF2
Calculation of FFF2 was determined by first identifying the onset of the steady state portion of the vowel. Following previous research practice, the onset of the steady state was determined as the point in the vowel 40 msec beyond the first glottal pulse (Robb et al. Reference Robb, Blomgren and Chen1998). Using this 40 msec steady-state onset point, ten consecutive glottal pulses following the onset point were analyzed. The F2 of each glottal pulse was determined using linear predictive coding methods (LPC, coefficients of the 12th order). The FFF2 of each vowel was determined by calculating the absolute difference in Hz among consecutive F2 values. The mean FFF2 was based on determining an average of the differences (Gerratt Reference Gerratt1983, Robb et al. Reference Robb, Blomgren and Chen1998). It needs to be noted that because of the gender difference in fundamental frequency (Zemlin Reference Zemlin1998), measuring 10 glottal pulses would potentially halve the duration of the steady state over which the formant fluctuations were measured for the female speakers.
FFF2R
As per Gerratt's (Reference Gerratt1983) caution that a measure of mean FFF is dependent upon the number of formant samples considered in the analysis, a relative measure of fluctuation was calculated. The FFF2R was calculated to serve as an alternative representation of FFF2. To calculate FFF2R, the FFF2 was divided by the average F2 comprising the ten glottal samples. This relative measure of fluctuation was calculated to neutralize the extent of fluctuations that depends on absolute formant frequency, rather than on the implied temporal dimension (i.e. the number of consecutive glottal pulses).
2.4 Perceptual evaluation for foreign accent
In order to determine whether the strength of the Mandarin-accent produced by the MAE speakers correlated with vocal tract steadiness, a perceptual task was conducted to determine the accent variability in the MAE speakers. Forty acoustic recordings of the first paragraph of the Rainbow Passage (Fairbanks Reference Fairbanks1940) obtained from each of the 40 MAE speakers were dubbed in randomized order onto an audiotape (referred to as the test list). The 40 samples were presented to a group of 20 listeners, who were undergraduate students and native AE speakers. Listeners were requested to evaluate the foreign accent of the 40 samples using a seven-point rating scale. The seven-point rating scale used to rate the samples was similar to the equal-appearing interval (EAI) scale recommended by Kreiman et al. (Reference Kreiman, Gerratt, Kempster, Erman and Berke1993). A score of 1 reflected the slightest foreign accent and a score of 7 reflected the strongest foreign accent. Listeners wore headphones and were allowed to adjust the volume control to a comfortable loudness level. Average foreign accent scores were calculated for each of the 40 samples. A rehearsal activity preceded the perceptual judgments, whereby the listeners were allowed to apply the seven-point scale to 10 examples obtained from four AE and six MAE speakers that represented variation in foreign accent.
2.5 Measurement reliability
Reliability associated with the measurement of formant frequency was determined by re-measuring 10 percent of all /hvd/ tokens randomly selected across MAE and AE speakers. The average absolute error for FFF2 (in Hz) between the first and second measurements was 1.04 Hz. The Pearson Product Moment Correlation coefficient for FFF2 between the first and the second measurements was 0.91 (p < .01).
3 Results
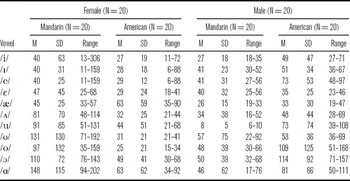
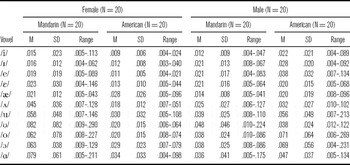
Mean and standard deviation values of FFF2 and FFF2R for each of the 11 vowels /i ɪ e ɛ æ ʌ ʊ u ɔ o ɑ/ produced by MAE and AE male and female speaker groups are listed in tables 1 and 2, respectively. The mean FFF2 ranged from 40 to 148 Hz, for the female MAE speakers and from 25 to 63 Hz for the AE female speakers. The mean FFF2 ranged from 8 to 57 Hz for the male MAE speakers, and from 33 to 114 Hz for the male AE speakers. The mean FFF2R ranged from.02 to.08, and from.01 to.03 for the female MAE and AE female speakers, respectively. The mean FFF2R ranged from.01 to.04 for the male MAE speakers, and from.02 to.07 for the male AE speakers.
Mean (M), standard deviation (SD) and range values for the FFF2 of 11 vowels produced by Mandarin male and female speakers.

Mean (M), standard deviation (SD) and range values for the FFF2R of 11 vowels produced by Mandarin male and female speakers.

Two mixed-model three-way ANOVA tests (SPSS version 12 2003) were performed to assess if a significant difference existed in FFF2 and FFF2R. Language group and gender were the between-groups factors, and vowel type was the within-group factor. The main effect of language group regarding FFF2 was not significant using a critical alpha of 0.05 [F(1,879) = 3.01, p = .08]. However, a significant main effect regarding FFF2R was found between language groups, with higher FFF2R associated with MAE speakers [F(1,879) = 6.74, p = .01]. The analyses indicated significant interaction among language group, gender, and vowel type [FFF2: F(10,879) = 3.85, p < .0001; FFF2R: F(10,879) = 2.85, p = .002]. Separate mixed-model two-way ANOVA analyses were then performed for the FFF2 and FFF2R results. Language group was the between-groups factor and vowel type was the within-group factor.
3.1 MAE females vs. AE females
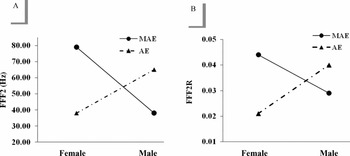
Results obtained for the ANOVA test indicated a significantly higher FFF2 among the MAE females compared to the AE females [F(1,439) = 46.49, p < .0001]. The interaction between language group and vowel type was also significant [F(1,439) = 3.38, p < .0001]. A series of post hoc t tests were performed to examine differences in FFF2 between MAE and AE female group for each vowel type. To reduce the possibility of a Type I error resulting from multiple comparisons, p values of post hoc t tests were adjusted using the Bonferroni procedure (Minium Reference Minium1978) to 0.005 (p = .05/11). The tests found /ʊ/ and /ɔ/ to be produced with a significantly higher FFF2 by the MAE females compared to the AE females, indicating the higher FFF2 among the MAE females was vowel contingent. The FFF2 results for both female groups are presented in figure 1.
Plot of mean FFF2 and FFF2R values across the 11 vowels (/i ɪ e ɛ æ ʌ u ʊ o ɔ ɑ/) between MAE and AE speakers. Panel A: FFF2 data; panel B: FFF2R data.

The ANOVA test for FFF2R indicated a significant effect between MAE and AE female speakers [F(1,439) = 46.81, p < .0001]. The direction of the effect indicates that MAE females produced English vowels with higher FFF2R than AE females (see figure 1). The interaction between language group and vowel type was also significant [F(1,439) = 3.54, p < .0001]. Post hoc t tests examining differences in FFF2R between MAE and AE female group found /ʌ/, /ʊ/, and /ɔ/ to be produced with a significantly higher FFF2R by the MAE females.
3.2 MAE males vs. AE males
Results obtained for the mixed-model two-way ANOVA test found the MAE males to produce English vowels with a significantly lower FFF2 compared to the AE males [F(1,439) = 29.51, p < .0001] (see figure 1). The interaction between language group and vowel type was also significant [F(1,439) = 2.51, p = .006]. Post hoc t tests examining differences in FFF2 between the MAE and AE males according to vowel type found /u/ to be produced with a significantly lower FFF2 by the MAE males.
The ANOVA for FFF2R indicated a significant effect between MAE and AE male speakers [F(1,439) = 14.38, p < .0001] with MAE males producing English vowels with a lower FFF2R compared to AE males (refer to figure 1). The interaction between language group and vowel type was not significant.
3.3 Comparison of foreign accent for MAE female and male speakers
The mean scores of Mandarin accent obtained from the perceptual evaluation of the MAE female and male speakers were 5.19 (SD = 0.69, range = 4.00–6.35) and 5.41 (SD = 0.70, range = 3.55–6.40), respectively. MAE female subject #12 and MAE male subject #18 were found to demonstrate the strongest foreign accent. A t test was performed to examine differences in accent between the MAE female and male groups. No significant difference was found.
3.4 Correlation between foreign accent and FFF2 for MAE speakers
To determine whether a relationship existed between foreign accent and formant frequency fluctuation, correlations were calculated between accent scores and FFF2, as well as between accent scores and FFF2R for each vowel production. The correlations were computed separately for MAE female and male groups. The resulting correlation coefficients obtained from the tests are listed in table 3. Among the 11 vowel sounds, no significant correlation was found between accent and FFF2/FFF2R for the MAE female group. Significant negative correlations between accent and FFF2 were found in the productions of /e/, /ʌ/, and /u/ for the MAE male group (p < .01). In addition, significant negative correlations between accent and FFF2R were found for the productions of /e/ and /ʌ/ among the MAE male group (p < .01).
Pearson's r values obtained from the correlation tests between foreign accent and FFF2, and between foreign accent and FFF2R. The tests were performed separately for MAE female and male groups. Significant correlations (p < .01) are marked with asterisk (*).

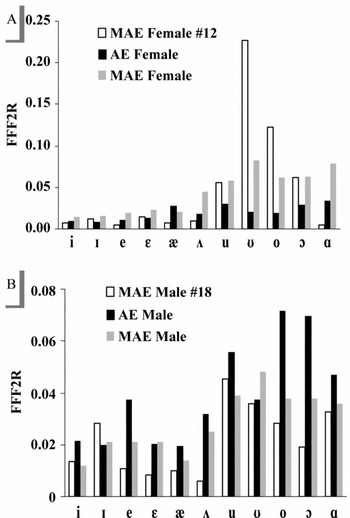
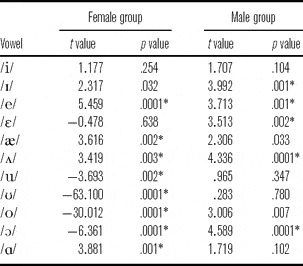
In addition to the correlation analyses performed for the MAE groups in regard to the possible relationship between foreign accent and FFF2 or FFF2R, further investigations used one-sample t tests (alpha level being adjusted to 0.005) to compare the eleven vowel productions of MAE female subject #12 and MAE male subject #18 with those of the AE speakers. A close examination comparing the results of the one-sample t tests to the results of the post hoc t tests for MAE and AE groups (figures 2a and 2b, table 4) did not find foreign accent to be correlated with reduced vocal tract motor steadiness.
Plot of comparisons of mean FFF2R values for each of the 11 vowels (/i ɪ e ɛ æ ʌ u ʊ o ɔ ɑ/) among the groups of MAE speakers, AE speakers, and the two MAE female and male speakers who were judged with the strongest foreign accent (MAE Female #12; MAE Male #18). Panel A: data for female groups; panel B: data for male groups.

Results of one-sample t tests for the comparisons of FFF2R between the MAE speaker with the strongest accent and AE speakers for each sex group. Significant pairs are marked with asterisk (*). The negative t values indicate the FFF2R values from AE speakers to be lower than the ones from MAE speakers.

4 Discussion
This study is designed to examine whether vocal tract steadiness, as measured by vowel formant frequency fluctuation (FFF2 or FFF2R), is significantly different between MAE speakers and AE speakers. Generally FFF2 and FFF2R exhibit similar patterns, indicating that the transformation from FFF2 is perhaps an unnecessary step in estimating vocal tract stability. Considering the rationale of using FFF2R as a standardized representation of FFF2 (Gerratt Reference Gerratt1983) as mentioned earlier, the ensuing discussion is mainly focused on the results obtained for FFF2R.
The results obtained for comparison of female and male groups are indicative of differences in vocal tract stability between MAE and AE speakers. The MAE females demonstrate a trend showing greater fluctuation compared to the AE female speakers (figure 1); however, this greater vocal tract fluctuation in MAE is found to be vowel specific. The vowels /ʌ ʊ ɔ/ are produced by MAE females with significantly higher vocal tract fluctuation compared to AE females. The significance found in these three vowels may account for the significant interaction between language group and vowel type for the female speakers. Not coincidentally, these three vowels share a common feature – each of them is articulated in the posterior region of the vocal tract where the back of the tongue is more involved (Perkell Reference Perkell1996). Back vowel productions appear to be more susceptible to the movement of tongue (dorsum or/and body) compared to the productions of front vowels, at least in the group of MAE female speakers of the present study. Perhaps, this is attributed to the fact that the entire posterior vocal tract, such as the region of laryngopharynx, is simultaneously affected by phonatory and articulatory motion due to the interconnections between the tongue (body) and the hyoid/larynx (Honda Reference Honda, Bless and Abbs1983). Following the same line, it is critical to consider a recently revised paradigm of vowel production the using laryngeal articulator model (Esling Reference Esling2005), in which the contribution of the laryngeal/pharyngeal vocal tract (LPVT) in vowel production is highlighted, especially for back vowel productions. As indicated by Esling (Reference Esling2005), the movement of the laryngeal articulator (e.g. aryepiglottic folds) also exerts an impact on pharyngeal volume and velo-pharyngeal and mandibular configurations in addition to lingual movement. As such, it is worth considering whether the higher vocal tract fluctuation demonstrated in the MAE females’ back vowel productions results from the fact that MAE females used the LPVT differently from AE speakers in producing L2 sounds. In addition, the present finding supports previous notions (Öhman Reference Öhman1967, Sanguineti, Laboissière & Ostry Reference Sanguineti, Laboissière and Ostry1998, Fuchs & Perrier Reference Fuchs and Perrier2005) that neuromuscular control over the posterior part of tongue (i.e. tongue dorsum and tongue root) is less precise than that over the anterior tongue section (i.e. tongue tip and blade). For example, among the multiple experiments carried out recently by Fuchs & Perrier (Reference Fuchs and Perrier2005) in studying the complex nature of speech kinematics, parameters of acceleration and deceleration along the differing points of tongue (such as tongue tip vs. tongue back) were measured over three speakers using electromyography (EMG). The study (Fuchs & Perrier Reference Fuchs and Perrier2005) found more kinematic variations being associated with the posterior articulation as opposed to the anterior articulation. This finding is also evidenced in the present study that back vowels are produced with increased vocal tract instability.
Analysis of FFF2R also reveals significant differences between MAE and AE male groups. However, the pattern is opposite from what is observed for the female speakers (figure 1). The AE males appear to demonstrate higher vocal tract fluctuation compared to the MAE male speakers. Rather than viewing the MAE males as showing better vocal tract stability than AE male, it is likely that MAE speakers produce the L2 vowels with greater vocal tract constraint, which is reflected by a reduced vowel (quadrilateral) space (Chen et al. Reference Chen, Robb, Gilbert and Lerman2001a, Robb & Chen Reference Robb and Chen2008).
The opposite findings of vocal stability demonstrated by the MAE female and male groups provide partial support for the hypothesis that reduced vocal tract steadiness is a specific feature of L2 vowel productions. Notably, MAE female and male speakers demonstrate different vocal stability patterns during L2 English vowel productions. Assuming the results obtained for the AE male and female speakers are indicative of the normal/typical F2 fluctuation associated with various vowels, it follows that a similar pattern would be observed in all MAE speakers. The present study shows that the MAE female speakers demonstrate a trend with greater F2 fluctuation during English vowel productions compared with MAE males. Although it is not the purpose of the present study to examine sex difference, the greater FFF2 found for the MAE females compared to the MAE males could appear more remarkable given the shorter steady segment, as mentioned previously, over which the formant fluctuations are measured for the female speakers. In other words, the sex related F0 difference (Zemlin Reference Zemlin1998) may lead to higher FFF2 values associated with MAE females due to the potential influence of F0 on the accuracy of formant measurement (Lindblom Reference Lindblom1962). However, the errors of formant frequencies measured using linear predictive coding (LPC) have been shown to be invariant for all fundamental frequencies between 100 and 350 Hz (Gerratt Reference Gerratt1983, Monsen & Engebretson Reference Monsen and Engebretson1983). The sex related F0 difference, however, may impose physiological impact on vocal tract steadiness. That is, higher FFF2 is likely correlated with higher F0 (such as in females), and lower FFF2 is associated with lower F0 (such as in males) because of the close interactions between phonatory and articulatory systems (Honda Reference Honda, Bless and Abbs1983, Gao & Esling Reference Gao and Esling2003). For example, Honda (Reference Honda, Bless and Abbs1983) found that there is an apparent hyoid elevation when F0 increases, and more importantly, the upward hyoid movement is accompanied by tongue movement due to the interconnections between tongue and hyoid/larynx. The kinetic interrelations between phonatory and articulatory systems are also confirmed by a recent study in which articulatory features during Mandarin tone productions were observed using laryngoscopy (Gao & Esling Reference Gao and Esling2003). In their study, the conjoint laryngeal and articulatory motions accompanied by differing F0s during various tone productions are observed and are considered to lead to possible changes in resonance (e.g. F2) due to the concomitant varying configurations of the pharyngeal cavity. An alternative possibility could be that the same amount of absolute vocal tract unsteadiness may give rise to a greater FFF2 for female speakers, since smaller vocal tract dimensions associated with females would lead to a larger acoustic/spectral space (Simpson Reference Simpson2001).
While all the phonetic physiological accounts mentioned above seem to provide convincing explanations for the different patterns of vocal tract steadiness in MAE speakers, they do not work equally well in explaining the opposite pattern of vocal tract steadiness observed in AE speakers, with females (in higher F0) showing a trend with fewer F2 fluctuations compared with the AE males (in lower F0). Perhaps, the scenario of different vocal tract steadiness between female and male speakers needs to be examined at a level beyond the phonetic physiological level. It is likely that the discrepancy of vocal tract steadiness between females and males suggests a sex difference of neurophysiological control in speech productions, as there exist sex differences in brain anatomy and function (Witelson Reference Witelson1976, Reference Witelson1989; Okada et al. Reference Okada, Tolumitsu, Hoshi and Tamura1993; Rihs et al. Reference Rihs, Gutbrod, Gutbrod, Steiger, Sturzenegger and Mattle1995; Steinmetz et al. Reference Steinmetz, Staiger, Schlaug, Huang and Jäncke1995; Gur et al. Reference Gur, Turetsky, Matsui, Yan, Bilker, Hughett and Gur1999). Witelson (Reference Witelson1976), for example, showed less hemispheric specialization in women as compared to men. Later, Witelson (Reference Witelson1989) and Steinmetz et al. (Reference Steinmetz, Staiger, Schlaug, Huang and Jäncke1995) found sex differences in the corpus callosum, with women showing a larger corpus callosum than men. The larger corpus callosum in women provides, as Witelson (Reference Witelson1989) proposed, better interhemispheric communication, and thus less functional lateralization of the two hemispheres would be needed for women. MRI evidence supporting the notion of less hemispheric specialization associated with women was reported in a recent study (Kulinych et al. Reference Kulynych, Vladar, Jones and Weinberger1994), in which the asymmetry of the planum temporal, a supratemporal region of auditory association in the cortex, was investigated. In that study, in contrast to men, women were found to demonstrate reduced asymmetry in the planum temporal, suggesting reduced asymmetry in the normal lateralization of language functions which are related to the supratemporal cortex. Furthermore, Rihs et al. (Reference Rihs, Gutbrod, Gutbrod, Steiger, Sturzenegger and Mattle1995) compared hemispheric activities using transcranial Doppler sonography (TCD) for left-handed women and men during various cognitive tasks, including reading aloud. In accordance with the findings of Kulinych et al. (Reference Kulynych, Vladar, Jones and Weinberger1994), less hemispheric asymmetry relating to language and speech functions was found in women as opposed to men. In view of the brain difference found between females and males in (L1) language/speech related hemispheric lateralization (Kulinych et al. Reference Kulynych, Vladar, Jones and Weinberger1994, Rihs et al. Reference Rihs, Gutbrod, Gutbrod, Steiger, Sturzenegger and Mattle1995, Gur et al. Reference Gur, Turetsky, Matsui, Yan, Bilker, Hughett and Gur1999), and the fact that brain reorganization occurs in (adult) L2 learning (Paulesu et al. Reference Paulesu, Frith and Frackowiak1993, Perani et al. 1996, Kent & Tjaden Reference Kent, Tjaden, Hardcastle and Lavers1997, Desmond & Fiez Reference Desmond and Fiez1998, Trépanier et al. Reference Trépanier, Saint-Cyr, Lozano and Lang1998, Smith & Jonides Reference Smith and Jonides1999, Gaillard et al. Reference Gaillard, Hertz-Pannier, Mott, Barnett, LeBihan and Theodore2000, Müller et al. Reference Müller, Wächter, Barthel, Reuter and von Cramon2000, Callan et al. Reference Callan, Tajima, Callan, Kubo, Masaki and Akahane-Yamada2003, Tan et al. Reference Tan, Spinks, Feng, Siok, Perfetti, Xiong, Fox and Gao2003), it is more than likely that gender dimorphism also appears in brain reorganization in L2 speech and learning, and as a consequence, results in dissimilar features of vocal tract steadiness in L2 speech.
Another possibility to consider is the role of accent on vocal tract fluctuation. Presumably, ‘strength’ of accent might have an effect of increasing F2 fluctuation. While this suggestion aligns nicely with the results obtained for the MAE females, the influence of accent on F2 fluctuation is less easily accounted for upon consideration of the MAE male results. In addition, results of the perceptual evaluation indicate no overall difference regarding foreign accent between MAE female and male speakers. Furthermore, the follow up analyses (tables 3 and 4, figure 2) do not demonstrate a possible relationship between foreign accent and vocal stability.
While the present findings seemingly undermine the possible contribution of foreign accent to the increase of vocal tract unsteadiness, the concept of foreign accent deserves a clearer definition. It needs to be noted that the foreign accent being evaluated in the current study was in regard to MAE speakers’ mastery of production of English as L2. However, a broadening of the concept of foreign accent also includes mastery of perception of the second language, or the perceptual foreign accent (McAllister Reference McAllister, Leather and James1997). According to Strange (Reference Strange and Strange1995), the perceptual foreign accent refers to the difficulty which adults encounter in perceiving most phonetic contrasts that are not functional in their L1. Since there are reports that perceptual foreign accent may hinder the phonetic production of L2 (Flege Reference Flege and Strange1995, Strange Reference Strange and Strange1995, McAllister, Flege & Piske Reference McAllister, Flege, Piske, Costamagna and Giannini2003), it might be the case that MAE female speakers in the present study differed from MAE male speakers in their perceptual foreign accent, although their production of foreign accent was found to be similar. While the likelihood of this difference was not formally examined in the present study, it would be worthwhile to examine the impact of perceptual foreign accent on speech production patterns in MAE. Indeed, the idea of an acoustic/auditory target underlying speech production has been reported in previous studies (Lindblom Reference Lindblom1963, Sydral & Gopal Reference Sydral and Gopal1986, Perkell et al. Reference Perkell, Matthies, Lane, Svirsky and Jordan1995, Perkell et al. Reference Perkell, Matthies, Lane, Guenther, Wilhelms-Tricarico, Wozniak and Guiod1997), whereby accurate vowel production is a result of aural control rather than postural control of the vocal tract motor movement.
Yet another possibility to consider is that the pattern of F2 fluctuation observed among the male and female MAE speakers is due to a sociophonetic influence, under which, the differences of F2 fluctuation is a result of conscious manipulation of speech patterns to convey gender identity (Robb, Gilbert & Lerman Reference Robb, Gilbert and Lerman2005). Byrd (Reference Byrd1994) and others (Whiteside & Marshall Reference Whiteside and Marshall2001, Cheshire Reference Cheshire, Chambers, Trudgill and Chilling-Estes2002) report that males and females differ in their general pattern of pronunciation, with females tending to use more carefully articulated speech and adopt this speaking style in experimental settings. The clear differences in F2 fluctuation patterns between the MAE male and female speakers, especially with reference to the expected pattern for AE speakers would suggest that factors other than physiological may have influenced the results. Loveday (Reference Loveday1981) provides a socio-cultural explanation for differences in vocal fundamental frequency (F0) between Japanese and English speakers. Specifically, Japanese women tend to speak with a higher and more dynamic F0 than British female speakers in order to project a vocal image associated with femininity. In contrast, Japanese men lower their F0 and limit their F0 range to emphasize masculinity. It is possible that vowel articulation among male and female speakers of MAE is linked in a similar fashion. Future work regarding a sociophonetic influence on speech production behavior in non-native speakers of English seems warranted.
In summary, characteristics of vocal tract steadiness were found to be distinguishable between MAE and AE speakers. In particular, the most apparent difference of vocal tract steadiness between MAE and AE speakers originates from the back vowels. In addition, the pattern of disparity of vocal tract steadiness obtained from comparing the female groups is different from that obtained from comparing male groups. In particular, MAE females demonstrate more vocal tract instability than AE females, while MAE males demonstrate more vocal tract steadiness than AE males. A common feature, however, can be found through a close examination of the acoustic findings (tables 1 and 2, figures 2a and 2b), that back vowels, regardless of the language group, are produced with less vocal tract stability as opposed to front vowels. To this end, in view of aforementioned physiological accounts (Öhman Reference Öhman1967, Perkell Reference Perkell1996, Sanguineti et al. Reference Sanguineti, Laboissière and Ostry1998, Fuchs & Perrier Reference Fuchs and Perrier2005), it seems that vocal tract unsteadiness correlates inherently to the location of vowel articulation, rather than to the language group.
Discussions mentioned earlier appear to favor the account of gender dimorphism in hemispheric specialization, rather than the phonetic physiological account, in explaining the sex-specific features of vocal tract steadiness of each language group. Two plausible interpretations of sex differences in aural-control and in sociophonetic influence on L2 speech production, which are most likely governed by brain anatomy and functioning, are provided to account for the opposite patterns of vocal tract steadiness demonstrated by MAE females and males, each compared to its AE counterpart.
Overall, the different patterns of vocal tract stability between MAE and AE speakers seem to be a result of reorganization of brain and cerebral lateralization during the process of L2 sound learning by MAE speakers (Scovel Reference Scovel1969, Reference Scovel1989; Lenneberg Reference Lenneberg1967; Bhatnagar Reference Bhatnagar2002). Yet the theory of brain reorganization needs to be applied in view of probable sex differences in hemispheric specialization occurring in L2 learning because of the seemingly irreconcilable patterns of vocal tract fluctuation demonstrated by the MAE females and males, in comparison to AE speakers. Stated differently, a tentative hypothesis is that there is a likelihood that MAE females and males in the present study may have developed different forms of brain reorganization and lateralization during their L2 (English) learning, which in turn account for the present findings that MAE females exhibit less vocal tract steadiness than AE females, and MAE males demonstrate more vocal tract stability than AE counterparts.
Acknowledgements
I would like to thank Dr. John Esling and Dr. Adrian Simpson, and the two anonymous reviewers for their thorough and constructive comments.