INTRODUCTION
Loess, or windblown silt, is one of the most useful sources of terrestrial paleoclimate information being studied today. It is widespread in the Quaternary and can be correlated to marine foraminiferal oxygen isotope records (Kukla et al., Reference Kukla, Heller, Ming, Chun, Sheng and Sheng1988; Begét and Hawkins, Reference Begét and Hawkins1989; Hovan et al., Reference Hovan, Rea, Pisias and Shackleton1989). Loess deposition provides direct information about paleoatmospheric circulation and paleowinds (Lagroix and Banerjee, Reference Lagroix and Banerjee2002; Muhs and Bettis, Reference Muhs and Bettis2003; Muhs and Budahn, Reference Muhs and Budahn2006) and can also serve as a proxy for paleoprecipitation and paleotemperature (Maher and Thompson, Reference Maher and Thompson1995; Deng et al., Reference Deng, Zhu, Jackson, Verosub and Singer2001).
Although loess studies have been commonplace in Alaska for more than a century (e.g., Tarr and Martin, Reference Tarr and Martin1913), they are still fewer in number and scope than studies focusing on the Chinese Loess Plateau and other Asian dust deposits. Most Alaskan studies have focused on one of the following areas: (1) deposition (Begét and Hawkins, Reference Begét and Hawkins1989); (2) loess origin and provenance (Péwé, Reference Péwé1955; Lagroix and Banerjee, Reference Lagroix and Banerjee2002; Muhs and Budahn, Reference Muhs and Budahn2006; Muhs et al., Reference Muhs, Budahn, Skipp and McGeehin2016); (3) chronology (Berger, Reference Berger1987; Westgate et al., Reference Westgate, Stemper and Péwé1990; Berger et al., Reference Berger, Péwé, Westgate and Preece1996; Preece et al., Reference Preece, Westgate, Stemper and Péwé1999; Berger, Reference Berger2003); (4) magnetic properties (Begét et al., Reference Begét, Stone and Hawkins1990; Liu et al., Reference Liu, Hesse, Rolph and Begét1999, Reference Liu, Hesse, Beget and Rolph2001; Vlag et al., Reference Vlag, Oches, Banerjee and Solheid1999); and (5) paleosol significance (Muhs et al., Reference Muhs, Ager, Bettis, McGeehin, Been, Begét, Pavich, Stafford and Stevens2003, Reference Muhs, McGeehin, Beann and Fisher2004, Reference Muhs, Ager, Skipp, Beann, Budahn and McGeehin2008). The ultimate goal of these studies has been to determine the utility and implications of Alaskan loess records for paleoclimate reconstructions, largely by constraining atmospheric circulation patterns, wind intensities, and trends in precipitation and temperature change. In general, little has been written about the grain-size distribution of Alaskan loess and its implications for paleoclimate, despite the fact that such studies have been successfully conducted on Asian loess deposits. Such studies could provide crucial new insight into some of the most important topics in Alaskan paleoclimate research, including high-latitude atmospheric circulation patterns and wind intensity during the last glacial–interglacial cycle and beyond.
Grain-size analysis provides information on depositional mechanisms of sediments as well as insight into spatiotemporal changes in deposition, which may be related to climate. Many strategies have been employed to gather paleoclimate information from grain-size data, particularly with regard to loess. Mass accumulation rates have been used as indicators of continental or source-area aridity (Pye, Reference Pye1995), and median grain diameter is commonly used as a proxy for mean wind intensity (An et al., Reference An, Kukla, Porter and Xiao1991; Porter and An, Reference Porter and An1995; Pye, Reference Pye1995; Xiao et al., Reference Xiao, Porter, An, Kumai and Yoshikawa1995). This latter measure has received much attention in the literature but is a less meaningful metric in polymodal sediments than in unimodal sediments. Recently, numerical grain-size partitioning has been employed to better describe changes in the distribution of polymodal (particularly eolian) sediments (Sun et al., Reference Sun, Bloemendal, Rea, Vandenberghe, Jiang, An and Su2002, Reference Sun, Bloemendal, Rea, An, Vandenberghe, Lu, Su and Liu2004, Reference Sun, Su, Bloemendal and Lu2008; Lim and Matsumoto, Reference Lim and Matsumoto2006; Xiao et al., Reference Xiao, Chang, Si, Qin, Itoh and Lomtatidze2009; Park et al., Reference Park, Hwang, Yoon and Choi2014). The theoretical basis for this technique rests on the idea that different transport mechanisms produce unique modal grain sizes in the sediment they deposit (Harding, Reference Harding1949; Middleton, Reference Middleton1976; Ashley, Reference Ashley1978; Bagnold and Barndorff-Nielson, Reference Bagnold and Barndorff-Nielsen1980). Thus, a polymodal grain-size distribution is the weighted sum of the modal distribution of all contributing sediment inputs and depositional processes. Numerical grain-size partitioning statistically models polymodal distributions as a mixture of unimodal distributions and quantitatively partitions the data into genetically distinct components (Sun et al., Reference Sun, Bloemendal, Rea, Vandenberghe, Jiang, An and Su2002). Changes in the relative proportions and modes of each component can then be interpreted in terms of changes in each depositional mechanism. Although this technique has been widely applied to Asian dust sources, it has yet to be used in Alaska.
In this article, we use a mixture of Weibull distributions to numerically partition the grain size of the eolian deposits at the Dry Creek archaeological site, located in the Nenana Valley of central Alaska, into two primary components. The aim of this study is to provide a high-resolution record of late Pleistocene–Holocene wind intensities in the Nenana Valley and to demonstrate the applicability and utility of numerical grain-size modeling for Alaskan loess deposits.
BACKGROUND
Study site
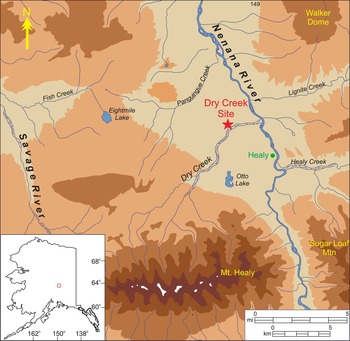
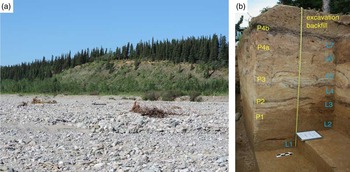
The Dry Creek archaeological site is located north of Healy, Alaska, in the central part of the state (Fig. 1). It is located on a south-facing bluff overlooking Dry Creek that is 3 km west from its confluence with the Nenana River (Fig. 2). Geographically, the site is in the northern foothills of the Alaska Range, about 10 km north of the range proper. Dry Creek is noteworthy not only for its archaeological importance (Thorson and Hamilton, Reference Thorson and Hamilton1977; Graf et al., Reference Graf, DiPietro, Krasinski, Gore, Smith, Culleton, Kennett and Rhode2015) but also as a type-section for the late Quaternary stratigraphy of the Nenana River Valley. A nearly continuous postglacial loess mantle between 1 and 3 m in thickness blankets the Nenana River Valley, absent only where the river exits the Alaska Range (Thorson and Bender, Reference Thorson and Bender1985). The Dry Creek site is perhaps the best-studied portion of this loess cap, and its stratigraphy has been well documented (Thorson and Hamilton, Reference Thorson and Hamilton1977). Stratigraphically, the site consists of 1–2 m of eolian deposits resting atop a Healy-age outwash terrace. Seven loess units, four sands, and five weakly developed paleosols have traditionally been identified at the site, capped by a modern cliff edge sand (Fig. 2). Mineralogically, the loess is quite uniform, consisting primarily of quartz, muscovite, and metamorphic rock fragments, reflecting the schistose nature of the regional bedrock.
(color online) Location of the Dry Creek site in the Nenana River Valley, central Alaska.

(a) Dry Creek site as viewed from the southern bank of Dry Creek. (b) Photograph of the Dry Creek stratigraphic profile from the 2009–2011 excavation with locations and designations of loess units (blue) and paleosols (yellow) noted.

The site’s chronology has been well established because of its importance for early North American archaeology (Thorson and Hamilton, Reference Thorson and Hamilton1977; Powers et al., Reference Powers, Guthrie and Hoffecker1983; Bigelow and Powers, Reference Bigelow and Powers1994; Graf et al., Reference Graf, DiPietro, Krasinski, Gore, Smith, Culleton, Kennett and Rhode2015). Radiocarbon ages suggest that the eolian package preserved at the site began accumulating sometime prior to about 13.5 ka, and deposition has continued until recent times.
Regional climatology
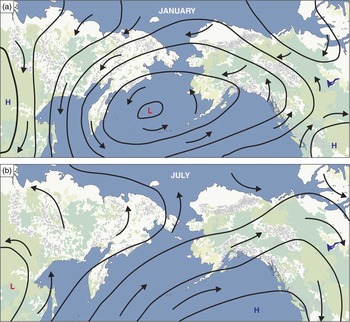
Modern Beringian climate patterns are the result of the interplay between four main pressure cells: the Siberian High, Canadian Low, Aleutian Low, and Pacific Subtropical High (Mock et al., Reference Mock, Bartlein and Anderson1998). During the winter, the Canadian and Siberian highs are well developed to the northeast and west of Alaska, respectively, while the Aleutian Low dominates over the Bering Sea. This results in strong winds moving across central Alaska from the northeast, flowing from the Canadian High to the Aleutian Low (Fig. 3a). During the summer, the Aleutian Low and Canadian High pressure cells are diminished and the Pacific Subtropical High strengthens and migrates northward to affect southern and central Alaska, resulting in weaker winds blowing across central Alaska from the southwest (Fig. 3b). Winds capable of entraining and depositing loess occur during both seasons, following the prevailing directional trends described previously, but dust storms are more commonly observed during the summer and fall months when snow and ice cover are absent from the major floodplains that serve as regional sediment sources (Begét, Reference Begét2001; Muhs et al., Reference Muhs, Ager, Bettis, McGeehin, Been, Begét, Pavich, Stafford and Stevens2003; Muhs and Budahn, Reference Muhs and Budahn2006; Hatfield and Maher, Reference Hatfield and Maher2009; Graf and Bigelow, Reference Graf and Bigelow2011; Muhs et al. Reference Muhs, Budahn, Skipp and McGeehin2016). In the Nenana Valley, modern winds have come predominantly from the north for the past decade, save for February, April, and July, which have southerly average winds (http://www.wrcc.dri.edu/htmlfiles/westwinddir.html).
(color online) Synoptic-scale atmospheric circulation patterns over Beringia. (a) January circulation, with the Aleutian Low dominating over the northern Pacific, Canadian High to the east, Siberian High to the west, and northerly–northeasterly winds in central Alaska. (b) July circulation, with the Pacific Subtropical High dominating over the northern Pacific and southerly–southwesterly winds in central Alaska. (Adapted from Mock et al., Reference Mock, Bartlein and Anderson1998)

Beringia has seen major changes in boundary conditions since the end of the last glacial maximum (LGM)—namely, a decrease in ice sheet size, reduction in glaciers, and formation of the Bering Strait—which could have had significant implications for the fundamental workings of its climate system in the past. Some studies of paleowind have suggested marked shifts in wind patterns between interglacial and glacial times (Lagroix and Banerjee, Reference Lagroix and Banerjee2002, Reference Lagroix and Banerjee2004; Muhs and Budahn, Reference Muhs and Budahn2006). During glacial times, “winter-type” circulation may dominate, with winds coming predominantly from the northeast, whereas “summer-type” circulation with weaker southwesterly winds may dominate during interglacial periods, although these findings are far from ubiquitous (Jensen et al., Reference Jensen, Evans, Froese and Kravchinsky2016). Katabatic winds were also common in the past, and there is evidence for major post-LGM deflation by such high-velocity winds in the Nenana River Valley (Thorson and Bender, Reference Thorson and Bender1985). Such winds may run contrary to the prevailing wind directions at any given time.
MATERIALS AND METHODS
Sample collection, grain-size distributions, and geochemistry
The sediment samples analyzed in this study were collected approximately 20 m east of the Dry Creek excavation area during the summer of 2012. Bulk samples were taken every 2.5 cm, starting at the base of the outcrop and ending just beneath the modern sand deposit, totaling to 57 samples over 1.6 m Prior to analysis, bulk samples were dried, and random powder mounts were prepared from a subset of samples for X-ray diffraction to determine mineralogy. Samples for particle-size analysis were pretreated with 30% H2O2 until reaction ceased to remove organic particles. X-ray analyses indicated that carbonates were absent, so HCl pretreatment was unnecessary. Samples were then suspended in 1 L of deionized water, dispersed with 10 mL of 10% (NaPO3)6, and sonicated for 3 minutes to ensure complete disaggregation. Particle-size analysis was performed using a Malvern MasterSizer 2000 with a Hydro MU dispersion unit. Data were collected in quarter-φ increments and were converted to grain sizes using the Mie theory. Duplicate analyses were performed periodically to ensure accuracy. Raw grain-size data are presented in Supplementary Table 1. Elemental concentrations of 10 major oxides (SiO2, Al2O3, CaO, Na2O, K2O, Fe2O3, MgO, MnO, TiO2, and P2O5) and 18 trace elements (As, Ba, Co, Cr, Cu, Mo, Nb, Ni, Pb, Rb, Sc, Sr, Th, U, V, Y, Zn, and Zr) were determined for each sample on a Rigaku ZSX-Primus 2 wavelength-dispersive X-ray fluorescence spectrometer with a 4.0 kW rhodium target X-ray tube. Bulk samples were shatter boxed for 2 minutes, mixed with a cellulose binder in a 6:1 ratio, and prepared as pressed pellets for analysis. These data are included in Supplementary Table 2.
Data analysis
Although there are several functions that may be used to numerically model grain-size distributions, the most commonly applied are the lognormal and the Weibull distributions. The Weibull distribution was chosen for this study for two primary reasons: first, because it is able to accommodate both symmetrical and positively and negatively skewed distributions, and second, because most wind speeds can be best modeled using a Weibull function and it logically follows that loess grain-size distributions should mimic those of their transport mechanism (Sun et al., Reference Sun, Bloemendal, Rea, An, Vandenberghe, Lu, Su and Liu2004).
A Weibull distribution is defined by the probability density function
 $$f(\delta ,a,b){\,\equals\,}{a \over {b^{a} }}\delta ^{{a{\minus}1}} e^{{({\delta \over b})a}} ,\delta \,\gt\,0,$$
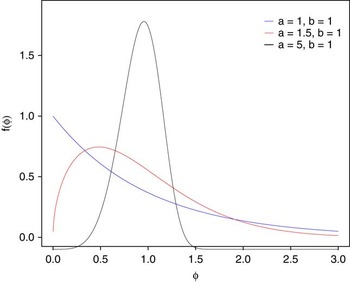
where a and b are called the shape and scale parameters, respectively. Figure 4 illustrates three Weibull distribution shapes: extremely right skewed for a=b=1, moderately right skewed for a=1.5 and b=1, and nearly symmetric for a=5 and b=1. A mixture Weibull distribution is defined by the probability density function
 $$\eqalignno{&f\left( {\delta ,a_{1} ,b_{1} ,a_{2} ,b_{2} ,p} \right){\equals} \cr& p\left( {{{a_{1} } \over {b_{1} ^{{\,\,a_{1} }} }}\delta ^{{a_{1} {\minus}1}} e^{{\left( {{\delta \over {b_{1} }}} \right)^{{a_{1} }} }} } \right){\plus}(1{\minus}p)\left( {{{a_{2} } \over {b_{2} ^{{\,\,a_{2} }} }}\delta ^{{a_{2} {\minus}1}} e^{{\left( {{\delta \over {b_{2} }}} \right)^{{a_{2} }} }} } \right),\delta \,\gt\,0$$
where a 1 and a 2 are the scale parameters, b 1 and b 2 are the shape parameters, and p (0<p<0.5) is a weight that estimates the proportion of observations that belong to the less-prevalent Weibull distribution.
Weibull distributions with varying values of a and b: extremely right skewed (blue), moderately right skewed (red), and symmetrical (black).

For each of the 57 samples, it was of interest to model the distribution of the grain diameters (in µm). Grain diameters ranged from 0.2 to 2380 µm, resulting in substantial axis compression. Consequently, grain diameter was transformed to a base-2 logarithm (φ) scale. Additionally, because some of the values of the φ increments were negative, 12.5 was added to all transformed values so that all were strictly positive, to adhere to the requirement that the values of a Weibull variable are strictly positive. We call this transformed variable δ. This one-to-one transformation preserves the integrity of the data and is easily reversed for interpretation back into the original grain diameters. Data analysis was performed on the transformed δ values. The open-source software R was used for all data analysis (R Development Core Team, 2014). For each of the 57 samples, the first step was to determine the shape of the distribution of δ. This was accomplished via a histogram with a kernel density estimate superimposed on the histogram. The kernel density estimate was especially helpful in determining the shape and, in particular, whether the distribution was unimodal or bimodal. It was determined that 36 of the 57 samples had a unimodal distribution, and the remaining 21 a bimodal distribution. For those bimodal samples, a mixture distribution was used to model δ.
The function mix in the mixdist package was then used to fit either a single Weibull or a mixture of Weibull distributions to each of the 57 samples. Once the family of distributions is specified, the function mix uses a combination of a Newton-type method and the expectation maximization (EM) algorithm to find parameter estimates that provide the best fit of the specified distribution to the data. The resultant fit is the set of parameter estimates that minimizes the mean square error between the data and the fitted distribution. To ensure convergence of the algorithm, it was necessary to select starting values for the mean and standard deviation individually for each of the 57 samples. Starting values were determined by visual inspection of the location of the peak (or peaks) in the data. These data are summarized in Supplementary Table 1.
Age-depth model
The Dry Creek archaeological site is an important, but often-debated, part of the late Pleistocene archaeological record in central Alaska. Although there is clear evidence of human populations in eastern Beringia following the LGM, the material remains left by these early Americans have been the subject of extensive debate in the archaeological community. Lithic assemblages dating between about 9 and 13 ka are commonly found at south-facing bluff localities such as Dry Creek, but there is both spatial and temporal variability in the types of artifacts found during this interval. Numerous explanations for this variability have been proposed, but no true consensus has yet been reached on the issue. Dry Creek is, perhaps, the best known of the Pleistocene archaeological sites in central Alaska and, as such, has factored heavily in this debate. In order to better constrain the chronology of the two late Pleistocene archaeological components at the site, an abundance of radiocarbon ages have been obtained from the nearly 350 m2 excavated since the 1970s. The original work at the site produced 18 radiocarbon ages (Thorson and Hamilton, Reference Thorson and Hamilton1977), many of which were deemed incongruent and dismissed as a result of contamination from locally derived lignite dust. The site was revisited in the mid-1990s by Bigelow and Powers (Reference Bigelow and Powers1994), resulting in six new accelerator mass spectrometry radiocarbon ages collected on wood charcoal from the lower part of the stratigraphy. Because none of these original 24 ages were from cultural features, but rather from natural charcoal, Graf et al. (Reference Graf, DiPietro, Krasinski, Gore, Smith, Culleton, Kennett and Rhode2015) revisited the site in 2011 with the intention of dating hearths from the late Pleistocene occupations in loess units 2 and 3. Their work resulted in an additional six ages.
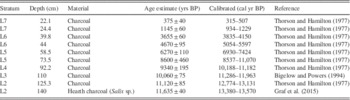
Clearly, Dry Creek has been both extensively and securely aged over the past 40 years of research. Although this is certainly a benefit for this study, the manner in which the ages have been recorded in the literature has led to some difficulties as well. Because the ages from the site were collected with the intention of dating paleosols, depositional units, and archaeological components, exact depths below surface remained unpublished for virtually all samples. Thorson and Hamilton (Reference Thorson and Hamilton1977) display the stratigraphic location of each age, but Bigelow and Powers (Reference Bigelow and Powers1994) record only relative descriptions of the sampling locations. Because both ages and corresponding depths are crucial for the development of an age-depth model, this severely limited the number of 14C ages that could be included in the model utilized in this study. The 10 ages used to calculate the age model for this study are summarized in Table 1. The majority of ages used here are from Thorson and Hamilton (Reference Thorson and Hamilton1977). Because the locations of their ages are presented graphically, it was only possible to approximate the position of each age within the individual stratigraphic units. However, many of Thorson and Hamilton’s ages appear to come from the same stratigraphic location. In such instances, only one age was selected from each level. For instance, in their figure 4, Thorson and Hamilton (Reference Thorson and Hamilton1977) presented ages of 3430±75 and 3655±60 from the uppermost part of paleosol 4a in loess 6. Because individual depths could not be assigned to each age only 3655±60 was included in the age model in this study for that stratigraphic level. This same difficulty led to a rejection of five of Thorson and Hamilton’s (Reference Thorson and Hamilton1977) 18 ages for this model, in addition to the five ages Thorson and Hamilton themselves dismissed. Only one age was used from Bigelow and Powers (Reference Bigelow and Powers1994), also as a result of the lack of depth information. The one age included from this study comes from the upper portion of paleosol 1, which is thicker and more easily traceable from the original sampling locality to the sampling locality for this study. Finally, one age from Graf et al. (Reference Graf, DiPietro, Krasinski, Gore, Smith, Culleton, Kennett and Rhode2015) was included to extend the age model to the lowermost portions of the profile. This sample is the only one of the 10 used to develop the age model for this study that had measured depth data available (K.E. Graf, personal communication, 2016). Only one of the six ages from the Graf et al. (Reference Graf, DiPietro, Krasinski, Gore, Smith, Culleton, Kennett and Rhode2015) study was included in this model because their loess 2 ages were all derived from within 2 vertical centimeters of one another. It is also worth noting that the ages from Graf et al. (Reference Graf, DiPietro, Krasinski, Gore, Smith, Culleton, Kennett and Rhode2015) are from cultural features, rather than from natural charcoal. Although the cultural ages do not appear to be discordant with natural ages obtained by Thorson and Hamilton (Reference Thorson and Hamilton1977), the possibility remains that the lower part of the section may be older than is modeled here. Once the ages were selected and their corresponding depths in the original excavation block approximated, these locations were correlated across the 20 or so meters between the main excavation block and the sampling locality for this study. This is easily done using simple lithostratigraphic correlation methods because the thicknesses and character of the depositional units do not change significantly over this distance. Although cryoturbation is present at the site, soil micromorphology suggests that this primarily affects the upper portion of the profile (generally above loess 4) and results in less-than-centimeter-scale disruptions (Graf et al., Reference Graf, DiPietro, Krasinski, Gore, Smith, Culleton, Kennett and Rhode2015). Micromorphology also indicates that no major hiatuses in deposition are present at the site. Furthermore, the organic stringers and upper sand units in the profile are largely continuous, easily followed across distances of tens of meters, and serve as marker positions for the locations of radiocarbon ages. The extrapolated positions of each age are noted in Figure 5. This method of extrapolation, although necessary because of the absence of charcoal in the section from which grain-size samples were collected, introduces inherent errors, which must be addressed. However, we believe that errors have been minimized as much as possible and that the age model presented here is a reasonable one given the expressed uncertainties.
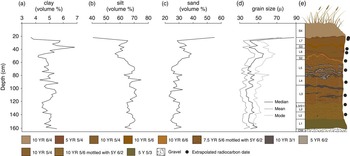
Grain-size distribution versus depth. (a) Volume percent clay (<4 μm). (b) Volume percent silt (4–62.5 μm). (c) Volume percent sand (62.5–2000 μm). (d) Mean, median, and mode. (e) Schematic illustration of the Dry Creek stratigraphy at the sampling location for this study (L, loess units; OW, outwash; S, sand units) with locations of radiocarbon ages shown. Paleosols are dark colored “stringers” located mainly within loess units. Cryoturbation has affected loess units 5–7, resulting in folding of paleosols. Colors correspond to field moist Munsell colors of each unit.

Selected Dry Creek radiocarbon ages used for age model development.

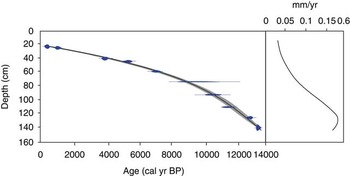
All radiocarbon ages were calibrated using the program CLAM v2.2 (Blaauw, Reference Blaauw2010) within the open-source statistical environment R v3.1.2 (R Development Core Team, 2014). All ages are given in calibrated years before present (cal yr BP) weighted by the calibrated probabilities of the ages, using the IntCal 13.14 calibration curve (Reimer et al., Reference Reimer, Bard, Bayliss, Beck, Blackwell, Bronk Ramsey and Buck2013). These calibrated ages were then used to generate an age-depth model at increments of 0.5 cm, using a third-order polynomial regression (Fig. 6). The resulting calendar age point estimates for each depth are based on the weighted average of 100,000 iterations calculated within the CLAM program.
(color online) Age-depth model and mass accumulation rates calculated using CLAM for the Dry Creek section. Estimated errors denoted with bars. Uncertainty in the model is shown in gray. Sources of radiocarbon ages include Thorson and Hamilton (Reference Thorson and Hamilton1977), Bigelow and Powers (Reference Bigelow and Powers1994), and Graf et al. (Reference Graf, DiPietro, Krasinski, Gore, Smith, Culleton, Kennett and Rhode2015).

RESULTS
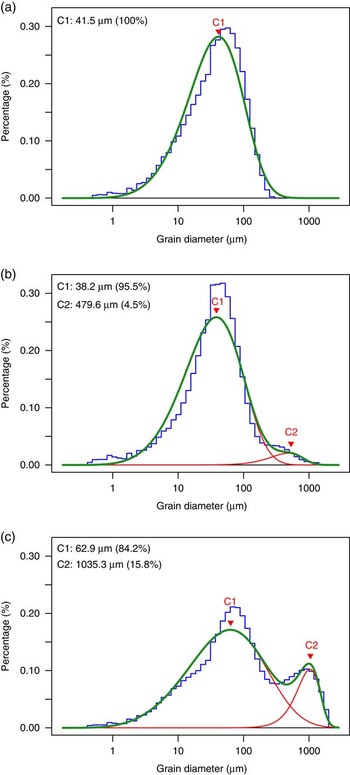
Bulk grain-size distributions are presented in Figure 5. Samples are composed of 3–7% clay (<4 μm), 40–75% silt (4–62.5 μm), and 22–56% sand (62.5–2000 μm). Median grain size ranges from 37 to 89 μm; modal grain size, from 43 to 72 μm; and mean grain size, from 31 to 75 μm—all typical size ranges for Alaskan loess, which tends to be somewhat sandier and less clayey than loess deposits elsewhere (Muhs et al., Reference Muhs, Ager, Bettis, McGeehin, Been, Begét, Pavich, Stafford and Stevens2003). Visual examination of the distribution histograms for each sample reveals that, broadly, the grain-size distributions of the Dry Creek samples fall into one of two categories: unimodal distributions or bimodal distributions with one fine component similar to the unimodal samples described previously and one coarse component. Both types of distributions are represented throughout the section, though unimodal distributions dominate, comprising 63% of the samples analyzed. Samples with a unimodal distribution were fit using a single Weibull distribution, whereas those with a bimodal distribution were fit using a two-component mixed Weibull distribution (Fig. 7).
Examples of grain-size distributions and Weibull-partitioned components from Dry Creek. (a) Unimodally distributed sample with only C1 present (sample DCb-31). (b) Bimodally distributed sample with a small proportion modal size of C2 (sample DCb-3). (c) Bimodally distributed sample with a large proportion and modal size of C2 (sample DCb-57). Raw data indicated by blue histogram, C1 and C2 shown in red, and fitted curve in green. (For interpretation of the references to color in this figure legend, the reader is referred to the web version of this article.)

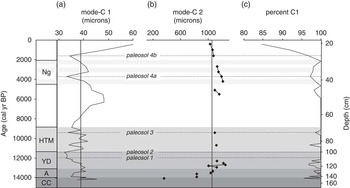
The fine component (component 1, C1) at Dry Creek is present in all samples. It has a modal size between 33.5 and 62.5 μm, with an average value of 39 μm (4.68 φ), and is fine-skewed. Modal size is large near the base of the section, decreases gradually over the lower 100 cm, and increases again above 80 cm, with a highly variable interval between 80 and 100 cm depth (Fig. 8a). Largest modal sizes occur at 14.1, 13.3, 12.9, 10.3, 6.3, and 0.4 ka, and smallest modal sizes occur at 13.9, 11.1, 3.7, and 1.6 ka. The coarse component (component 2, C2) is not uniformly distributed throughout the section. It is more common near the base and top of the profile but can be found sporadically throughout. The mode of the C2 component ranges from 481 to 1304 μm, with an average value of 1055 μm (−0.77 φ). Maxima for the C2 component occur at 12.7 and 4.2 ka, and minima at 13 and 0.4 ka (Fig. 8b). The C1 component dominates all samples, accounting for at least 85% of each, but commonly as much as 100% (Fig. 8c).
Results of grain-size partitioning using the mixed Weibull distribution. (a) Modal size of C1 in microns with average value (39.2) denoted by line. (b) Modal size of C2, where present, in microns with average value (1075.1) denoted by line. (c) Proportion of C1 in each sample. Results are plotted against time in cal yr BP and depth in centimeters. A, Allerød; CC, Carlo Creek; HTM, Holocene thermal maximum; Ng, Neoglacial; YD, Younger Dryas.

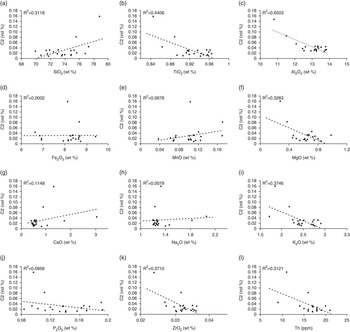
Elemental concentrations were determined for each sample in an effort to identify geochemical indicators of provenance change throughout the profile. Both major and trace element concentrations in the bulk sediment were found either to be remarkably consistent throughout or to vary primarily in conjunction with the abundance of the C2 component (Fig. 9, Supplementary Table 2). There is a moderately strong positive relationship between the abundance of the C2 component and the concentration of Si, and a moderately strong negative relationship between C2 and Ti, Al, Mg, K, Zr, and Th. The good correlation between elemental concentration and abundance suggests that the chemistry of these elements is largely being driven by the abundance of C2 in each sample, rather than by changes in provenance through time. C2 additionally appears to be enriched in quartz and depleted in Ti, Al, Mg, K, Zr, and Th, as compared with C1.
Plots showing the relationship between the abundance of C2 (in volume percent) and elemental concentrations of SiO2 (a), TiO2 (b), Al2O3 (c), Fe2O3 (d), MnO (e), MgO (f), CaO (g), Na2O (h), K2O (i), P2O5 (j), ZrO2 (k), and Th (l) and associated R-squared values. All major element concentrations are given in weight percent; trace elements are in parts per million.

DISCUSSION
Interpretation of grain-size components
The Dry Creek site is located in the northern foothills of the Alaska Range, overlooking Dry Creek about 3 km from its confluence with the Nenana River (Fig. 1). Given this geographic position, there are a number of potential sediment sources that could have contributed to deposition of the loess package at the site over the last several thousand years. Most proximal is the glaciofluvial outwash terrace on which the latest Pleistocene and Holocene loess cap has accumulated. This terrace rises at least 25 m above the current floodplain of Dry Creek and is poorly sorted and conglomeratic, composed primarily of cobble- to boulder-sized clasts of quartz, quartz-muscovite schist, and other lithic fragments. The unlithified outwash deposits fines near the top and has been subjected to extensive physical and chemical weathering since the late Pleistocene, when it is inferred to have been deposited during the Healy glaciation (Péwé et al., Reference Péwé, Hopkins and Giddings1965; Ritter, Reference Ritter1982; Dortch et al., Reference Dortch, Owen, Caffee, Li and Lowell2010) . The silty-sandy matrix of the outwash could have easily been entrained by southerly winds and deposited atop the bluff. Dry Creek itself is another potential sediment source. The creek is a braided stream that originates in the northern flank of the Alaska Range. Bed load in its shallow channels is similar lithologically to the glaciofluvial outwash deposits in the region, largely consisting of igneous and metasedimentary cobbles (Thorson and Hamilton, Reference Thorson and Hamilton1977). Suspended sediment is predominantly silt derived from the Birch Creek Schist (also called the Fairbanks Schist) and tends to be mainly quartz and muscovite, although appreciable amounts of chlorite, lithic fragments, rutile, and magnetic minerals have been reported (Thorson and Hamilton, Reference Thorson and Hamilton1977). The modern braid plain is commonly subaerially exposed, particularly during dry summers and in the fall (Fig. 2), leaving silt and sand available for entrainment and eolian transport. Perhaps the most obvious source for eolian sediment in the area surrounding Dry Creek is the Nenana River. The Nenana River exits the Alaska Range approximately 10 km south of its confluence with Dry Creek and flows northward as a narrow braided river where it has incised through several outwash terraces of varying late Quaternary ages (Wahrhaftig and Black, Reference Wahrhaftig and Black1958). Sediment from the Nenana River is dominated by quartz, muscovite, and rock fragments (primarily metamorphic and metasedimentary), though chlorite, epidote, rutile, magnetics, and zoisite/clinozoisite are reported as common mineral constituents (Thorson and Hamilton, Reference Thorson and Hamilton1977). Historic dust entrainment from the Nenana River during windstorms has been reported, and Muhs and Budahn (Reference Muhs and Budahn2006) cited it as an important source for loess in the Fairbanks area to the north. Broadly speaking, both the Tanana and Yukon Rivers to the north of Dry Creek are important regional loess sources as well. The Yukon is separated from Dry Creek by nearly 300 km as well as by the Yukon Tanana Uplands, so its importance as a sediment source at Dry Creek is likely negligible, but the Tanana, only about 100 km to the northeast, could reasonably contribute sediment to the site. Geochemical surveys of Nenana, Tanana, and Yukon River silts have been performed by Muhs and Budahn (Reference Muhs and Budahn2006), but the elemental concentrations in that study were determined only for sediment in the 2–53 μm size fraction. The loess at Dry Creek is much coarser than this, and small sample sizes prevented the analysis of particle-size separates. As a consequence, our bulk geochemical analyses performed on sediment with a wider range of grain sizes did not plot on the provenance diagrams constructed by Muhs and Budahn (Reference Muhs and Budahn2006). However, given the regional importance of the Tanana River, it seems reasonable to consider it a possible source at Dry Creek.
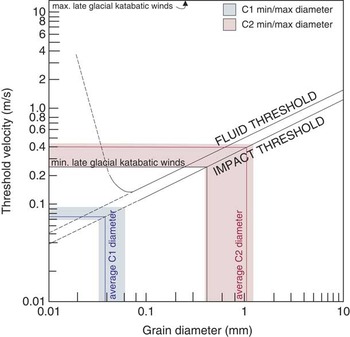
The grain size of an eolian deposit is dependent on three factors: the grain-size distribution of the sediment source, the distance the sediment has been transported, and wind intensity. We suggest that neither the grain-size distribution of the sediment sources described previously nor their distance from Dry Creek have changed significantly since the LGM. Vegetation also plays a major role in loess deposition in two major ways: (1) vegetation height can affect surface roughness, and therefore wind velocity; and (2) certain types of vegetation (e.g., spruce forest) serve as more effective sediment traps than others (e.g., herb tundra), and all types of vegetation serve as better traps than no vegetation (Muhs et al., Reference Muhs, Ager, Bettis, McGeehin, Been, Begét, Pavich, Stafford and Stevens2003). Following the LGM, central Alaska was covered by sparse herb tundra vegetation, which transitioned to shrub tundra and finally boreal forest by 9–10 ka (e.g., Graf and Bigelow, Reference Graf and Bigelow2011, and references therein). Because changes in vegetation occur throughout the time interval of this study, vegetation must be ruled out as a factor influencing grain-size distributions in order to ascribe any sort of climatic meaning to those distributions. To some extent, this is impossible to do. Vegetation likely plays at least some role in loess accumulation at Dry Creek. However, if vegetation were the driving force behind grain-size variations at Dry Creek, one might expect to see broad changes in particle size that correspond to vegetation transitions. This does not appear to be the case here. Additionally, spruce forest has been present at Dry Creek for at least the past 9000 yr or so, during which time variations in the grain-size distribution of the loess at Dry Creek are observed. If grain-size variations were solely the result of changes in vegetation, this would not be the case, so some additional factor must be at play. Moreover, spruce forest is a more effective sediment trap than tundra vegetation (Muhs et al., Reference Muhs, Ager, Bettis, McGeehin, Been, Begét, Pavich, Stafford and Stevens2003). Therefore, sediment accumulation rates should be higher during times when the surface vegetation is dominated by spruce, rather than by herb or shrub tundra. Instead, the reverse is true at Dry Creek. Sediment accumulation rates are highest in the late Pleistocene and drop during the Holocene. This suggests that, although loess accumulation probably started at Dry Creek as a result of the herb/shrub tundra transition during the late Pleistocene, subsequent changes in vegetation type have had little effect on the character of the loess at the site. Thus, we may interpret changes in the modal size of C1 and C2 of the loess to represent changes in competence of sediment-transporting winds. In order to do this, however, it is necessary to identify the provenance of each component. C1 has a modal size almost entirely in the coarse silt category, save for the most recently deposited loess. Loess with a modal size in this range is the most common component in Asian dust and has thus been widely studied (Vandenberghe, Reference Vandenberghe2013). It is interpreted to have been transported in low to near-surface suspension clouds during seasonal dust storms (Tsoar and Pye, Reference Tsoar and Pye1987) over a distance of tens of kilometers (Vandenberghe, Reference Vandenberghe2013). In one instance, a transport distance of nearly 100 km was recorded for this size subgroup (Pendea et al., Reference Pendea, Gray, Ghaleb, Tantau, Badarau and Nicorici2009), but this seems to be the exception rather than the rule. Sources for this subgroup are most commonly glaciofluvial deposits and alluvial plains (Smalley et al., Reference Smalley, O’Hara-Dhand, Wint, Machalett, Jary and Jefferson2009). At Dry Creek, C1 is interpreted to represent deposition of Nenana River silt by northerly–northeasterly winds. Southerly sources are likely too close to Dry Creek to result in sediment this fine, particularly when it is easily possible for most wind to entrain and transport grains as large as fine sand for distances of several kilometers. It is possible that input from the Tanana River is responsible for the fine-skewed nature of C1, which would also suggest northerly winds, but this remains to be tested at additional sites. The loess cap at Dry Creek thickens and coarsens slightly to the north (Thorson and Hamilton, Reference Thorson and Hamilton1977), also supporting an interpretation of dominant northerly winds. Maximum and minimum wind velocities associated with the deposition of C1 range between 0.07 and 0.095 m/s (Fig. 10), estimated from laboratory experiments (Thorson and Bender, Reference Thorson and Bender1985).
Estimated minimum threshold velocities for entrainment (fluid threshold) and deposition (impact threshold) for Weibull-partitioned components C1 (in blue) and C2 (in red). Shaded areas denote minimum and maximum threshold velocities for deposition based on minimum and maximum modal sizes of C1 and C2; red and blue lines represent average modal size of each component. Modified from Thorson and Bender (Reference Thorson and Bender1985) with their estimated minimum and maximum calculated late glacial katabatic wind velocities marked in black. (For interpretation of the references to color in this figure legend, the reader is referred to the web version of this article.)

C2 has a modal size in the range of medium to very coarse sand. Sediment of this size is uncommon in loess deposits and is generally transported via saltation or, in the case of medium sand, very short-term suspension (Vandenberghe, Reference Vandenberghe2013, and references therein). As such, the source of C2 must have been quite proximal. The sands at the Dry Creek site have long been interpreted as derived from Dry Creek itself, or perhaps from the outwash at the base of the eolian profile (Thorson and Hamilton, Reference Thorson and Hamilton1977; Bigelow et al., Reference Bigelow, Begét and Powers1990), and we concur with this interpretation. These sediment sources would require strong southerly winds, perhaps the katabatic winds flowing off of the Alaska Range as suggested by Thorson and Bender (Reference Thorson and Bender1985) and Bigelow et al. (Reference Bigelow, Begét and Powers1990). Wind velocities necessary to deposit C2 range from 0.3 to 0.45 m/s (Fig. 10), which are comparable to the katabatic wind velocity in the Nenana River Valley calculated by Thorson and Bender (Reference Thorson and Bender1985) for the late glacial period. As vegetation transitioned from grass dominated to shrub dominated to tree dominated (Bigelow and Powers, Reference Bigelow and Powers2001) and surface roughness increased, the velocity of these winds may have decreased during the Holocene. However, assuming Thorson and Bender’s (Reference Thorson and Bender1985) assertion that actual katabatic wind velocities lie between their maximum and minimum estimates, they likely would still have been competent to entrain and deposit C2, particularly given that the modern cliff-head sand at the site falls into the C2 size category.
This interpretation of wind regimes follows the model proposed by Muhs and Budhan (2006) for central Alaska, wherein primary winds come from the north and katabatic winds occasionally transport from the south, leading to the formation of eolian deposits, which are a mixture of sediment from northerly and southerly sources. Because of the proximity of Dry Creek to the southerly sediment sources, there is a disparity in grain size between the sediment deposited by katabatic winds and regional winds. Because of this disparity, the use of grain-size partitioning on this suite of samples is possible and allows for the analysis of what are essentially two separate grain-size records at Dry Creek: one recording the intensity of regional northerly winds carrying C1 over the past 15,000 yr and another recording the occurrence and intensity of episodic southerly katabatic winds carrying C2 over the same time interval.
This study is not the first to use grain size as a proxy for wind intensity in central Alaska, nor even at Dry Creek. Bigelow et al. (Reference Bigelow, Begét and Powers1990) asserted that the sand 1 layer identified at the site by Thorson and Hamilton (Reference Thorson and Hamilton1977) represented increased wind intensities related to katabatic winds and a rapid, short-lived environmental shift during the Younger Dryas. Their assertion was challenged by Waythomas and Kaufman (Reference Waythomas and Kaufman1991), who argued that sand 1 was not as ubiquitous throughout the Nenana Valley as Bigelow et al. (Reference Bigelow, Begét and Powers1990) had suggested, and that the stratigraphy of the Nenana Valley showed little regional regularity. They furthermore argued that such coarse-grained deposits need not be the result of hundreds or thousands of years of sedimentation but, instead, might have been produced from hour- to day-long events. Additionally, they argued that the presence of additional sand layers at Dry Creek, which are not addressed by Bigelow et al. (Reference Bigelow, Begét and Powers1990), indicate that a single climate event cannot be the cause of what appears to be a repeating sedimentological feature. Instead, they proposed that the variable presence of unvegetated bluffs created by downcutting rivers is responsible for variations in the particle size at Dry Creek. Waythomas and Kaufman (Reference Waythomas and Kaufman1991) raise the additional point that, at that time, the evidence for any time interval of climatic change associated with the Younger Dryas in the interior of Alaska was spotty at best. To some extent, this is still the case; evidence for a Younger Dryas climate reversal abounds in southern Alaska but is less straightforward in the interior, perhaps indicating moisture, but not temperature responses (Graf and Bigelow, Reference Graf and Bigelow2011). Begét et al. (Reference Begét, Bigelow and Powers1991) responded to Waythomas and Kaufman’s (Reference Waythomas and Kaufman1991) concerns, citing Wahrhaftig and Black (Reference Wahrhaftig and Black1958), Thorson (1975), and Thorson and Hamilton (Reference Thorson and Hamilton1977) as evidence that some degree of continuity does exist in the Nenana Valley loess. Although Begét et al. (Reference Begét, Bigelow and Powers1991) do not cite this work, Powers and Hoffecker (Reference Powers and Hoffecker1989) and Hoffecker et al. (Reference Hoffecker, Waythomas and Powers1988) presented additional evidence that there is a consistent stratigraphy in the region. A regional stratigraphy suggests that the patterns observed in grain-size distributions are the result of regional-scale processes, rather than short-term, local variations in sediment availability. Begét et al. (Reference Begét, Bigelow and Powers1991) also argued that sand 1 is too laterally extensive to have been derived from transient bluff exposures or blowouts along Dry Creek.
The model proposed by Bigelow et al. (Reference Bigelow, Begét and Powers1990) does not precisely mirror that proposed in our study. They suggested that the winds transporting sand 1 and transporting the loess units were one and the same, whereas in our study we argue that they come from different directions and represent sediment derived from different sources. Nevertheless, Bigelow et al.’s (1990) interpretations for a valley-wide stratigraphy and against the importance of ephemeral sediment sources have bearing on the work presented here. Furthermore, the model proposed in our study may, in fact, help to resolve some of the additional issues raised by Waythomas and Kaufman (Reference Waythomas and Kaufman1991). Southerly katabatic winds driven by glaciation in the northern Alaska Range provide a more effective mechanism for repeating sand-rich layers in the stratigraphy in a way that the Younger Dryas model proposed by Bigelow et al. (Reference Bigelow, Begét and Powers1990) does not. It also explains the high proportion of silt in the sand layers at the site. Silt and sand deposition were concurrent at Dry Creek; if silt and sand are deposited by different mechanisms, an increase in the proportion of one need not correspond with an absence of the other.
Late Quaternary wind intensities
The modal sizes of C1 and C2, as well as the relative proportions of C1 and C2, were plotted against calibrated radiocarbon ages in order to examine the chronology of late Quaternary changes in wind strength in the Nenana River Valley (Fig. 8). Variations in the modal size of C1 broadly correspond with six major climatic events over the last ~15,000 yr. Modal sizes are higher than average, suggesting intensification of northerly winds and, thus, the Aleutian Low during three time intervals: 14.2–14 ka, 7.5–4 ka, and ~2.5–1.6 ka. The first of these intervals coincides with ages usually assigned to the Older Dryas, a brief cold period identified in some parts of North America between the Bolling and Allerød warm intervals, but records of the Older Dryas are scarce in this part of Alaska. Instead, we suggest that the oldest part of the profile at Dry Creek represents high velocity winds associated with the Carlo Creek glacial readvance in the Nenana Valley, which is generally aged between 14 and 16 ka (Dortch et al., Reference Dortch, Owen, Caffee, Li and Lowell2010). The latter two intervals correspond broadly with proposed Neoglacial readvances during the Holocene between 7.6 and 5.8 ka and after 3 ka (Calkin, Reference Calkin1988; Powers and Hoffecker, Reference Powers and Hoffecker1989; Anderson et al., Reference Anderson, Abbott and Finney2001). Weaker winds are indicated by minima in the modal size of C1, specifically from 14 to 13.3 ka, 12.6 to 11 ka, 9.7 to 8 ka, 3.9 to 2.5 ka, and 1.5 to 0.9 ka. The first of these intervals corresponds the Allerød warm period. Of interest are the relatively weak wind intensities recorded here during the Younger Dryas, commonly aged from 12.9 to 11.7 ka in central Alaska. The effects of the Younger Dryas in central Alaska have long been debated; some climate records indicate cool and/or dry conditions during this interval (Hu et al., Reference Hu, Brubaker and Anderson1993; Abbott et al., Reference Abbott, Finney, Edwards and Kelts2000; Bigelow and Edwards, Reference Bigelow and Edwards2001), whereas others indicate little to no deviation from previous conditions (Anderson et al., Reference Anderson, Lozhkin, Eisner, Kozhevnikova, Hopkins, Brubaker and Colinvaux1994; Bigelow and Powers, Reference Bigelow and Powers2001). Younger Dryas perturbations appear to be most intense along the southern coast of Alaska, and it has been suggested than increased insolation and the geographic isolation of central Alaska from the northern Pacific are causes of the variability observed (Bigelow and Edwards, Reference Bigelow and Edwards2001). For the Dry Creek record, increased summer insolation during this interval (Bartlein et al., Reference Bartlein, Anderson, Edwards and McDowell1991) may have resulted in a weakening of the Aleutian Low and decreases in regional northerly wind strength and lower C1 modal sizes. Variable wind strength is indicated between 11.4 and 9.4 ka, roughly coinciding with the expression of the Holocene thermal maximum (HTM) in central Alaska (Kaufman et al., Reference Kaufman, Ager, Anderson, Anderson, Andrews, Bartlein, Brubaker, Coats, Cwynar and Duvall2004). Kaufman et al. (Reference Kaufman, Axford, Henderson, McKay, Oswald, Saenger and Anderson2016) find that that the early Holocene (11.7–8.2 ka) in eastern Beringia was marked by fluctuating temperatures, rather than a prolonged period of warmth as has been previously suggested. Their evidence of fluctuating temperature combined with the findings of fluctuating wind intensity in our study suggest that the HTM in Alaska was a time of rapid oscillations in climate, rather than protracted warmth as is seen elsewhere in the world. The largest increase in C1 modal size occurs near the top of the section, just below the modern cliff-edge sand. Here the mode of C1 reaches its maximum of 62.5 μm. Although the geochemical data did not indicate a major provenance shift throughout the profile (Supplementary Table 2), we suggest that this coarsening represents a transition toward southerly prevailing winds and a much closer sediment source, such as occur at the site today. This sediment would likely have come from the Nenana River as well, but the portion of the river to the south of the site rather than to the north, thus accounting for the uniformity of the geochemical data throughout the section.
We interpret the occurrence and modal size of C2 to indicate the prevalence and strength of higher-velocity, katabatic southerly winds in the Nenana River Valley, and it may therefore be used as a record of glacier extent in the northern Alaska Range. C2 is observed most commonly prior to ~12 ka and after 4 ka at Dry Creek, suggesting increased katabatic windstorm frequency and expanded glaciers during these intervals. Higher storm frequency before 12 ka is likely the result of expanded glaciers and the retreating Cordilleran ice sheet in the Alaska Range following the LGM. Higher ice volume in the mountains would have led to intense density-driven katabatic winds, particularly as the foothills and lowlands warmed comparatively during deglaciation. Glaciation controlled the character of C2 during the late glacial period, but it is noteworthy that the largest modal sizes of C2 are not associated with this time period when there is no record of large alpine glaciers in the Alaska Range. Rather, the largest modal size in C2 is observed at 12.9 ka, at the onset of the Younger Dryas chronozone. As discussed previously, evidence for a climatic reversal associated with the Younger Dryas in central Alaska is somewhat convoluted. It has been argued that cooler sea-surface temperatures in the northern Pacific caused an increase in southerly wind strength during the Younger Dryas. As migrating air currents move over chilled air resting atop a glacier or ice sheet, potential for displacement of the chilled air mass exists, even if ice volume is relatively low, provided that the prevailing winds are strong enough (Thorson and Bender, Reference Thorson and Bender1985). This means that, during the Younger Dryas, strong southerly winds directed against the Alaska Range may have displaced cold air atop mountain glaciers down into the Nenana River, which, according to the model proposed in this study, would have resulted in a proposed valley-wide increase in sand deposition (Bigelow et al., Reference Bigelow, Begét and Powers1990) without necessitating an increase in the modal size of C1. This also may explain why there is such variability in proxy records in interior Alaska during the Younger Dryas: sites that are located nearer the southern coast of Alaska or proxies that might record changes in southerly winds (such as the modal size of C2) should show increased Younger Dryas effects, whereas sites farther from the coast or that were not sensitive to changes in southerly wind intensity (such as the modal size of C1) should not. The C2 peak between 5.5 and 5.1 ka is somewhat more puzzling, because it occurs during what has widely been recognized as a period of glacial retreat during the middle Holocene (Ten Brink and Waythomas, Reference Ten Brink and Waythomas1985; Levy et al., Reference Levy, Kaufman and Werner2004; Daigle and Kaufman, Reference Daigle and Kaufman2009; Kaufman et al., Reference Kaufman, Axford, Henderson, McKay, Oswald, Saenger and Anderson2016; LaBrecque and Kaufman, Reference LaBrecque and Kaufman2016) and thus cannot be explained simply in terms of ice volume, but it does not occur during a widely recognized climate reversal, such as the Younger Dryas. It is possible that this peak is the result of error in the age model used in this study and that the three C2 peaks near the top of the profile actually correspond to the three Neoglacial periods described previously, although this is a somewhat dissatisfying explanation and perhaps not a likely one, given the apparently good correlation between the rest of the profile and existing climate records. This peak may be the result of a short-lived, previously undescribed glacial advance during the middle Holocene, which would seem a bold interpretation to make given the abundance of work that has been performed on Nenana Valley glaciation over the last several decades. A final explanation may be that this particular peak is not, in fact, related to ice volume but to another factor affecting katabatic wind frequency and intensity—namely, regional wind patterns. As Northern Hemisphere temperatures increased following the LGM, southerly regional winds caused by the Pacific Subtropical High in the northern Pacific likely began to prevail in southern Alaska (Hopkins, Reference Hopkins1982). These southerly regional winds, weaker but more consistent than those that dominated during the Younger Dryas, could have displaced cold air sitting atop reduced glaciers in the Alaska Range that would not otherwise have been displaced. The weaker regional southerly winds would have resulted in weaker katabatic winds and explains why the modal size of C2 during this interval is smaller than during the Younger Dryas, despite their similar cause.
Three late Holocene periods of Neoglacial expansion have been recorded across Alaska at 4.5–4 ka, 3.3–2.9 ka, and 2.2–2.0 ka (Solomina et al., Reference Solomina, Bradley, Hodgson, Ivy-Ochs, Jomelli, Mackintosh and Nesje2015; Kaufman et al., Reference Kaufman, Axford, Henderson, McKay, Oswald, Saenger and Anderson2016), which broadly correspond with the late Holocene C2 record at Dry Creek. The Dry Creek record does not show three distinct events during this time interval, perhaps as a result of decreasing deposition rates throughout the Holocene (Fig. 6), but it is likely that the abundance of C2 in the upper part of the profile reflects Neoglacial cooling and glacier expansion from the late Holocene until the recent.
Paleosol development and landscape stability
In periglacial settings dominated by loess, soil development and silt deposition are competing processes (Muhn and Bettis, 2003). Pedogenesis may only occur when the rate of silt deposition slows to such a point that chemical weathering and humification may take place. Soil development also requires some degree of landscape stability so that freshly weathered material remains in place, rather than being eroded away. Geochemically, soil development is generally associated with changes in the concentrations of three types of elements: (1) base cations (Ca, Na, K, Mg); (2) redox-sensitive elements (Fe, Mn); and (3) organic compounds (C, P). When the concentrations of these elements deviate predictably from mean values for loess, pedogenesis is indicated. Ca, Na, and K become depleted as a result of the weathering of unstable primary minerals, such as feldspars, amphiboles, pyroxenes, or micas. Ca and Mg can become enriched when carbonate precipitation occurs in a soil. Redox-sensitive elements are lost under reducing (poorly drained) conditions, gained under oxidizing (well-drained) conditions, and remobilized when drainage is variable. Organic matter increases in soils as plants, fungi, and microbes colonize, increasing C and causing a surface depletion/subsurface enrichment pattern in P. Thus, from examining the geochemistry of paleosols-loess sequences, it should be possible to reconstruct many characteristics of a buried soil that is no longer actively forming.
Thorson and Hamilton (Reference Thorson and Hamilton1977) identified five paleosols in the stratigraphic sequence at Dry Creek: three Cryepts in the lower part of the section (paleosols 1, 2, and 3), an Ochrept (paleosol 4a), and an Orthod (paleosol 4b). They described the paleosols as having well-developed A horizons and, commonly overlying B horizons, and labeled several of the paleosol intervals up to 35 cm thick. Thorson (2005) identified the lower paleosols as well-drained grassland soils with bioturbation soil carbonate, lepidocrocite, and 12%–14% clay. Hoffecker et al. (Reference Hoffecker, Waythomas and Powers1988) referred to the paleosols as “well developed.” Such well-developed paleosols should show clear geochemical evidence, then, for protracted periods of landscape stability in the past and would represent major hiatuses in deposition at the site. There is, however, little if any evidence in the major element concentrations gathered in this study indicating that this is the case. As discussed previously, base cation concentrations at the site correlate somewhat well with the abundance of the C2 component (Fig. 9f–j), which suggests that very little chemical weathering and remobilization of elements has occurred in the profile. The poor correlation of redox-sensitive elements with C2 (Fig. 9d and e) is likely the result of remobilization, although this could just as likely be from drainage changes resulting from modern freeze-thaw processes and overprinting from the modern surface soil as from relict soil development. Both soil color and elemental analysis indicate increasing organic C concentrations in paleosols, but the characteristic P depletion/enrichment is lacking. In fact, aside from the organic C, there is not one instance in which trends in elemental concentrations at Dry Creek correlate with the location of one of the “well-developed” buried soils. Additionally, soil micromorphology performed at the site (Graf et al., Reference Graf, DiPietro, Krasinski, Gore, Smith, Culleton, Kennett and Rhode2015) shows a complete lack of weathering-related pedofeatures. These findings would indicate that the paleosols at Dry Creek are not nearly as well developed as they have been described in the past. A quick examination of the soil profile in Figure 2 suggests that this should not be so surprising a finding. Rather than 35-cm-thick “paleosol intervals,” it is clear that the paleosols at Dry Creek generally consist of little more than 1- to 2-cm-thick, generally discontinuous accumulations of organic matter. Paleosol 1 is the most discontinuous of the five buried soils, consisting of lenses of organic matter less than 1 cm thick. This morphology, combined with the lack of chemical evidence for weathering, could indicate that what has been referred to as a paleosol is actually simply the accumulation of organic matter along relict permafrost table positions during the late glacial period, when permafrost may have been quite close to the ground surface and sedimentation was likely rapid. Paleosol 2 is somewhat better developed, is 3–4 cm thick, and is continuous across the site but still lacks any evidence for chemical weathering. Paleosol 3 is the most developed but would be better characterized as a complex of centimeter-scale, dark organic-rich and white-to-gray leached couplets, with little mixing between or within couplets that it is one cohesive buried soil. Paleosol 4a is certainly better developed than paleosols 1 and 2 but is still represented by a 3- to 4-cm-thick discrete accumulation of organic matter in loess that is generally reddened, again likely a result of spodic processes occurring in paleosol 4b near the surface today. Paleosol 4b is the thickest and best-developed buried soil at the site and, based on the radiocarbon chronology, may represent a few hundred years of stability. Certainly, none of the other paleosols at the site attest to any longer-term landscape stability.
However, that is not to say that the paleosols do not represent short periods of landscape stability at Dry Creek. They almost certainly do, and there is evidence in the grain-size data to support this. If paleosols formed as a result of reduced deposition, they should be associated with accompanying decreases in wind intensity and, consequently, with lower modal sizes in the C1 component. This is, in fact, exactly what is observed (Fig. 8). Minima in C1, indicating weaker winds and probably less deposition, coincide with the location of paleosols throughout the profile. Paleosol 2 corresponds to a minimum in the C1 component following the Younger Dryas interval, and paleosols 4a and 4b to minima between the Neoglacial events of the late Holocene. Paleosol 3 is perhaps the most intriguing. The light-dark couplets of paleosol 3 seem to coincide with fluctuations in wind intensity during the HTM and probably indicate very short periods of landscape stability in a rapidly fluctuating climate. No single couplet is well developed, but the paleosol 3 complex as a whole could suggest a protracted interval of climate fluctuation between conditions that were ideal for soil development and those that were not. It is likely that the paleosols at Dry Creek represent minor depositional hiatuses or, more likely, periodic slowing (but not cessation) of silt deposition and that the actual rate of deposition is likely more variable than is depicted in Figure 6. These hiatuses are impossible to incorporate into the site’s sedimentation model, however, given the current resolution of the site’s radiocarbon chronology, but the largely unweathered state of each paleosol suggests that the effects of this on the age model are likely minor. Nevertheless, the paleosols do provide important information regarding landscape stability in the Nenana Valley since the LGM.
CONCLUSIONS
Using a mixture of Weibull distributions to numerically partition grain size distributions, we observe two grain size components in the late Quaternary loess cap at the Dry Creek site: C1, a fine-skewed component with modal size between 33.5 and 62.5 μm, and C2, a symmetrical component with modal size between 481 and 1304 μm. We attribute the deposition of C1 to regional-scale northerly winds carrying silt from the Nenana River and possibly the Tanana River, and C2 to deposition of locally derived medium to very coarse sand by southerly katabatic winds.
The modal size of Weibull-partitioned component C1 is proportional to the strength of regional winds. Northerly winds associated with the Aleutian Low were intense during the Carlo Creek glacial readvance, during three late Holocene Neoglacial expansions, and within the last 1000 yr. Wind strength was low during the Allerød and Younger Dryas, suggesting a weakened Aleutian Low during warmer climatic intervals. The HTM in the Nenana River Valley was marked by variable wind intensities, likely resulting from variable temperatures across Beringia.
Weibull-partitioned component C2 is present in just under half of the samples collected from the site. The presence and modal size of this component reflect the frequency and intensity of southerly katabatic winds in the Nenana River Valley. Such winds were episodic and common prior to 12 ka, likely as a result of expanded glaciers and the retreating Cordilleran ice sheet in the northern Alaska Range, as well as after 4 ka, in association with late Holocene Neoglacial events. There is evidence for intense southerly winds between 5.5 and 5.1 ka, perhaps as a result of a longer residence time of the Pacific Subtropical High further northward. The velocity of these winds did not vary significantly over this time period.
This study provides compelling evidence that grain-size partitioning techniques may be applied to Alaskan loess as a way to reconstruct paleoatmospheric circulation and regional-scale paleoclimate. Application of this technique to the Alaskan loess record at other key sites could yield valuable, high-resolution information about Quaternary climate across the region.
Acknowledgments
The authors would like to acknowledge the Baylor University Department of Geoscience and Texas A&M University’s Center for the Study of the First Americans for funding the analytical and field portions of this research, respectively. This study was conducted in conjunction with research funded by National Science Foundation award #BCS-1460369. We would also like to thank Dr. Kelly Graf and Dr. Ted Goebel for their logistical support during fieldwork, Dr. Sally Horn and Matthew Boehm for their assistance with calibrating the radiocarbon ages and constructing the age model used in this work, and Dr. Steve Dworkin, Dr. Lee Nordt, Dr. Joseph Ferraro, Dr. Mark Sweeney, and three anonymous reviewers for their helpful comments on a previous version of this manuscript.
SUPPLEMENTARY MATERIAL
To view supplementary material for this article, please visit https://doi.org/10.1017/qua.2017.3