

Introduction
The importance of identifying and providing interventions to support optimal environments and treatment for neurodevelopmental conditions (NDCs) is increasingly being acknowledged.
Diagnostic criteria for both Attention Deficit Hyperactivity Disorder (ADHD) and Autism have broadened, contributing to the increase in prevalence estimates. Current prevalence of ADHD in adults is approximately 3% and similarly, 3% of adults are estimated to be autistic (Ayano et al. Reference Ayano, Tsegay, Gizachew, Necho, Yohannes, Abraha, Demelash, Anbesaw and Alati2023; O’Nions et al. Reference O’Nions, Petersen, Buckman, Charlton, Cooper, Corbett, Happé, Manthorpe, Richards, Saunders, Zanker, Mandy and Stott2023). Prevalences such as these would suggest that ADHD and Autism are common conditions.
NDC’s are recognised as lifespan conditions. Whilst diagnostic criteria require differences be present and to have associated impact from childhood, and specifically before the age of twelve for ADHD, scaffolding can be sufficient, and environments suitably modified that difficulties may not present until adulthood, when environments can become more challenging and demands increase. (APA 2013). In addition, differences in diagnostic rates associated with gender for both autism and ADHD have been described, both being diagnosed later in females compared to males (Gu et al. Reference Gu, Dawson and Engelhard2023; Skogli et al. Reference Skogli, Teicher, Andersen, Hovik and Øie2013).
Co-occurrence with ADHD and autism is clearly described in addition to symptom overlap (Lebena et al. Reference Lebeña, Faresjö, Faresjö and Ludvigsson2023; Sigurdardottir et al. Reference Sigurdardottir, Hannesdottir, Hauksdottir, Ollendick, Davidsdottir and Halldorsdottir2025; Thapar et al. Reference Thapar, Cooper and Rutter2017). Both ADHD and autism are often accompanied by intellectual, language and/or motor disorders (Selinus et al. Reference Selinus, Molero, Lichtenstein, Anckarsäter, Lundström and Bottai2016).
Symptom overlap and diagnostic co-occurrence means allocating to a single diagnostic category can be difficult and risks missing areas of difference present, but not included within a specific diagnostic definition, that might benefit from support (Bonti et al. Reference Bonti, Zerva, Koundourou and Sofologi2024). In addition, there are inherent problems with application of arbitrary thresholds used within current classification systems that result in failure to identify individuals with milder difficulties that nonetheless impact significantly on lived experience (Astle et al. Reference Astle, Holmes, Kievit and Gathercole2022).
Consideration of clinical and service delivery comprising of a neurodevelopmental rather than a single condition approach has been recommended consequently (Astle et al. Reference Astle, Holmes, Kievit and Gathercole2022; NAIT 2021; NHS England 2025).
Co-occurrences with mental ill health are high. Addressing neurodevelopmental needs poses the potential to prevent development of mental illness, optimise physical health, reduce suicide and for ADHD reduce overall mortality (O’Nions et al. Reference O’Nions, El Baou, John, Lewer, Mandy, McKechnie, Petersen and Stott2025; Shaw et al. Reference Shaw, Doherty, McCowan and Eccles2022; Smith DaWalt et al. Reference Smith DaWalt, Hong, Greenberg and Mailick2019).
Two third of young adults referred to secondary care mental health services in Sweeden were found to have NDCs, most of which had not been detected previously. NDCs are thought to confer an “at risk” state of developing moderate to severe mental illness, further supporting the importance of detection and intervention (Eberhard et al. Reference Eberhard, Billstedt and Gillberg2022).
A further Swedish psychiatric population study found a smaller (18.9–35%), but still significant, proportion of persons seeking psychiatric care to have unrecognised autism (Nyrenius et al. Reference Nyrenius, Eberhard, Ghaziuddin, Gillberg and Billstedt2022)
In Ireland autism diagnosis and support falls within the remit of Primary Care and Disability Services, though at present there are limited state provided services for assessment of autism in adults. Similarly, until 2021 there were no clinical services for adult ADHD, for continuity of support for young people diagnosed in CAMHS nor for people presenting in adulthood. An Adult ADHD Model of Care (MOC) was launched in 2021 in acknowledgement of this (HSE 2021).
This research took part in one of the adult ADHD teams, based in South Central Dublin, set up as part of the adult MOC.
One of the pathways is for young adults transitioning from Child and Adolescent Mental Health Services (CAMHS) with diagnoses of ADHD to the Adult ADHD team for ongoing treatment.
Youth mental health has been identified as an area for national prioritization (HSE 2024). 50% of mental health problems emerge by the age of 16 years and 75% by the age of 25 (Kessler et al. Reference Kessler, Berglund, Demler, Jin, Merikangas and Walters2005). In young adulthood problems become more complex and emerging disorders develop, such as psychosis and personality disorder (Kessler et al. Reference Kessler, Berglund, Demler, Jin, Merikangas and Walters2005).
Planned transitions have been demonstrated to improve engagement and outcomes, these should address current medical and psychosocial support needs. (Tuomainen et al. Reference Tuomainen, Schulze, Warwick, Paul, Dieleman, Franić, Madan, Maras, McNicholas, Purper-Ouakil, Santosh, Signorini, Street, Tremmery, Verhulst, Wolke and Singh2018)
Given the significance of recognition of NDCs in preventing development of secondary mental illness and described co-occurrence of NDCs we undertook to explore the rates of co-occurrence of autism in our young adults with ADHD.
The aim of this paper is to estimate the co-occurrence of autism as a diagnosis and identify sub threshold autism features within this young adult population with ADHD.
In addition, we look at gender differences within and between the ADHD only and dual ADHD and autism groups. Across the lifespan females are referred later and diagnosed later when compared to males for both ADHD and autism (Mciver et al. Reference Maciver, Roy, Johnston, Boilson, Curnow, Johnstone-Cooke and Rutherford2025). A male bias towards presentation within diagnostic criteria potentially contributes to identification of the nuanced ways gendered expectations influence presentation. Neurodivergent females may present with fewer observable traits, have more advanced social skills and or more socially acceptable special interests (Zener Reference Zener2019).
We explore the use of the RAADS-14 both as a screener to identify autism and autistic features with the aim of understanding support needs.
The RAADS-14 sub scores comprise of mentalization, sensory differences and social communication and offer an opportunity to explore differences between genders in endorsement of features.
The RAADS 14
The screening questionnaire used in this study was the RAADS-14 Screen (Eriksson et al. Reference Eriksson, Andersen and Bejerot2013). The RAADS-14 Screen is a fourteen-item self-rating scale used for Autism screening. The RAADS-14 Screen is an abridged version of the more comprehensive eighty item RAADS-R (Ritvo et al. Reference Ritvo, Ritvo and Guthrie2011). The RAADS-R was specifically tailored to address diagnostic features from both DSM-4 and ICD-10. It is self-reported and takes approximately five minutes to complete.
The RAADS-14 was specifically designed with the psychiatric outpatient clinic population in mind. There is high cooccurrence with autism and overlap of some features resulting in diagnostic confusion, in people attending psychiatric outpatient clinics. Within this group a cut-off score of 14 on the RAADS-14 has been shown to have a sensitivity of 0.97 and a specificity of 0.64 (Eriksson et al. Reference Eriksson, Andersen and Bejerot2013) demonstrating good discriminative utility.
ADHD populations were described as having higher than average psychiatric population scores but lower than autistic peoples scores. Median scores for autism of 32, ADHD 15, and psychiatric disorders of 11, are described. Possible scores range from 0 to 42.
The RAADS-14 comprises of three subscales covering the areas of mentalization, sensory differences and social communication. It is designed for use in those without significant intellectual disability. Mentalizing differences comprises of one language item, three social relatedness differences, and two focused interest differences. Social anxiety includes two social relatedness and one language item. Sensory sensitivities comprise of three sensory motor differences.
Sub scores are potentially clinically helpful in understanding individual profiles of non-autistic ADHD people, where for example autism assessment is not thought to be clinically indicated from assessment but high scores on sensory sensitivities indicate further assessment is warranted in this area.
Method
The study was carried out in the adult ADHD team in South Central Dublin over a twelve-month period from April 2024 to March 2025 using a comparative cohort design.
The service at the time of writing comprised of 1.8 WTE clinicians and was open to young adults transitioning from CAMHS with diagnoses of ADHD and ongoing support needs in addition to providing consultation to secondary care adult mental health services where queries of ADHD arose. Ethics approval was granted by Research Ethics Committee Midlands Area and Corporate Division (HSE Dublin & Midlands), reference RRECB0224MB.
All young people transferring from CAMHS with ADHD to the adult ADHD service were eligible for inclusion. Posters advising that the clinic was involved in research were on display with an open invitation to ask for further information. Demographic data and diagnostic status were collected at the point of transfer.
All patients had a structured assessment which comprised of- review of provided reports, review of the developmental history, longitudinal history, completion of a current psychosocial assessment, current ADHD symptomatology, an observational assessment (in the form of a mental state examination), and performing a diagnostic formulation (referencing DSM criteria for current ADHD, co-occurring NDCs or co-occurring mental illnesses), and RAADS-14 scale completed.
This is consistent with NICE guidance that after transition to adult services, adult healthcare professionals should carry out a comprehensive assessment of the person with ADHD that includes personal, educational, occupational and social functioning, and assessment of any coexisting conditions (NICE 2018).
From these assessments, patients who did not have a diagnosis of autism at transfer, but where clinical judgement suggested this should be considered from features identified during the assessment, were offered an autism assessment by the team. Autism assessments used a combination of the Autism Clinical Interview Adults (ACIA), RAADS-R and The Royal College of Psychiatrists Interview Guide for the Diagnostic assessment of Able Adults with Autism (Berney et al. Reference Berney and Brugha2017; Ritvo et al. Reference Ritvo, Ritvo and Guthrie2011; Wigham et al. Reference Wigham, Ingham, Le Couteur, Berney, Ensum and Parr2020).
The total number of autistic and ADHD young adults following on from the additional assessments was then presented as a percentage of the total number involved in the study.
The cohort was then divided into two groups for comparison.
Group 1 were autistic and ADHD young adults (dual diagnosis).
Group 2 comprised of patients with ADHD without an autism diagnosis (ADHD only).
Data cleaning and preprocessing for comparative analysis between and within dual diagnosis and ADHD only groups
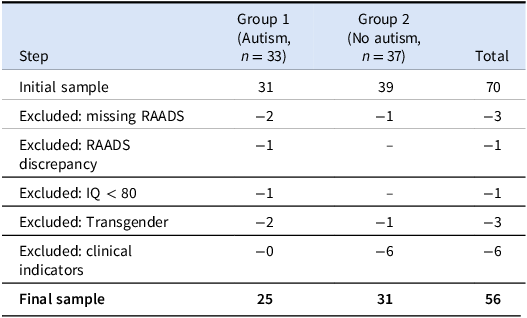
In Group one (dual diagnosis), 6 participants were excluded: 2 due to missing RAADS data, 1 due to a discrepancy in RAADS score, 1 due to IQ < 80, 2 due to transgender status (this number was too small to be considered separately).
This resulted in 25 participants in Group one (12 male, 13 female) proceeding to analysis.
In Group two, six participants were excluded: 1 due to missing RAADS data, 1 due to transgender status, and 7 due to clinical features suggestive of autism (1 of which was returned to the data set post negative autism assessment). This resulted in 31 participants in Group two (15 male, 16 female).
The final analytic sample used for between and within group comparison therefore comprised of 56 participants (n = 25 with dual diagnosis; n = 31 ADHD only).
Statistical analysis
Independent t tests were employed to compare the RAADS-14 total and subscale scores between the groups and to examine the effect of gender within each group. For these comparisons Cohens d was calculated to indicate effect size. Scores between groups one and two were then subjected to a ROC analysis.
Diagnostic threshold analysis
Two RAADS-14 thresholds were evaluated for diagnostic classification:
Conventional threshold for a psychiatric population: RAADS −14 ≥ 14.
Optimised threshold: Determined via ROC curve analysis.
Using the pROC package in R: a ROC curve was generated with autism diagnosis as the outcome and total RAADS-14 score as the predictor. The threshold that maximised Youden’s Index (sensitivity + specificity −1) was identified (RAADS ≥ 24.5).
The area under the curve (AUC) was calculated to assess discriminative ability. Confusion matrices for both thresholds were constructed to compute: Accuracy sensitivity, specificity, positive predictive value (PPV), negative predictive value (NPV).
Results
Incidence of autism analysis
Seventy young adults were referred and proceeded to assessment during the timeframe. The participants were divided into two groups: autistic and ADHD young people with a confirmed autism diagnosis (Group one, n = 31) and those with ADHD only diagnoses (Group two, n = 39).
Within group two (ADHD diagnoses only) there was a subset (n = 7) with significant autism features identified at assessment in their longitudinal, developmental history and on clinical observational assessment. These patients were offered autism assessments as described. Six met diagnostic criteria for autism and were excluded from group two. One was subsequently returned to group two as their diagnostic assessment was negative.
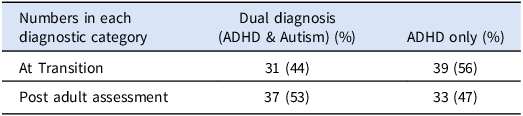
Of the original data set, 37 individuals at the end of the study period had confirmed diagnoses of autism, i.e. 53% of the young adults with ADHD also met criteria for autism (see Table 1 for Diagnostic status at point of transfer and after assessment and Table 2 for details of data processing).
Diagnostic status at point of transfer and after assessment within the adult team

Table 1. Long description
The table compares the numbers in each diagnostic category at transition and post-adult assessment. It has two rows and three columns. The columns are labeled ‘Numbers in each diagnostic category’, ‘Dual diagnosis (ADHD & Autism) (%)’, and ‘ADHD only (%)’. The row labels are ‘At Transition’ and ‘Post adult assessment’. Row 1: At Transition, 31 (44), 39 (56). Row 2: Post adult assessment, 37 (53), 33 (47).
Data processing defining cohort group1 (dual diagnosis) and group 2 (ADHD) only

Table 2. Long description
The table has five rows and four columns. The columns are labeled Step, Group 1 (Autism, n = 33), Group 2 (No autism, n = 37), and Total. The rows are labeled Initial sample, Excluded: missing RAADS, Excluded: RAADS discrepancy, Excluded: IQ < 80, Excluded: Transgender, Excluded: clinical indicators, and Final sample. Row 1: Initial sample, 31, 39, 70. Row 2: Excluded: missing RAADS, -2, -1, -3. Row 3: Excluded: RAADS discrepancy, -1, 0, -1. Row 4: Excluded: IQ < 80, -1, 0, -1. Row 5: Excluded: Transgender, -2, -1, -3. Row 6: Excluded: clinical indicators, 0, -6, -6. Row 7: Final sample, 25, 31, 56.
The cases not originally detected were female (n = 3) male (n = 2), and transgender (n = 1).
Between group comparisons dual diagnosis and ADHD only
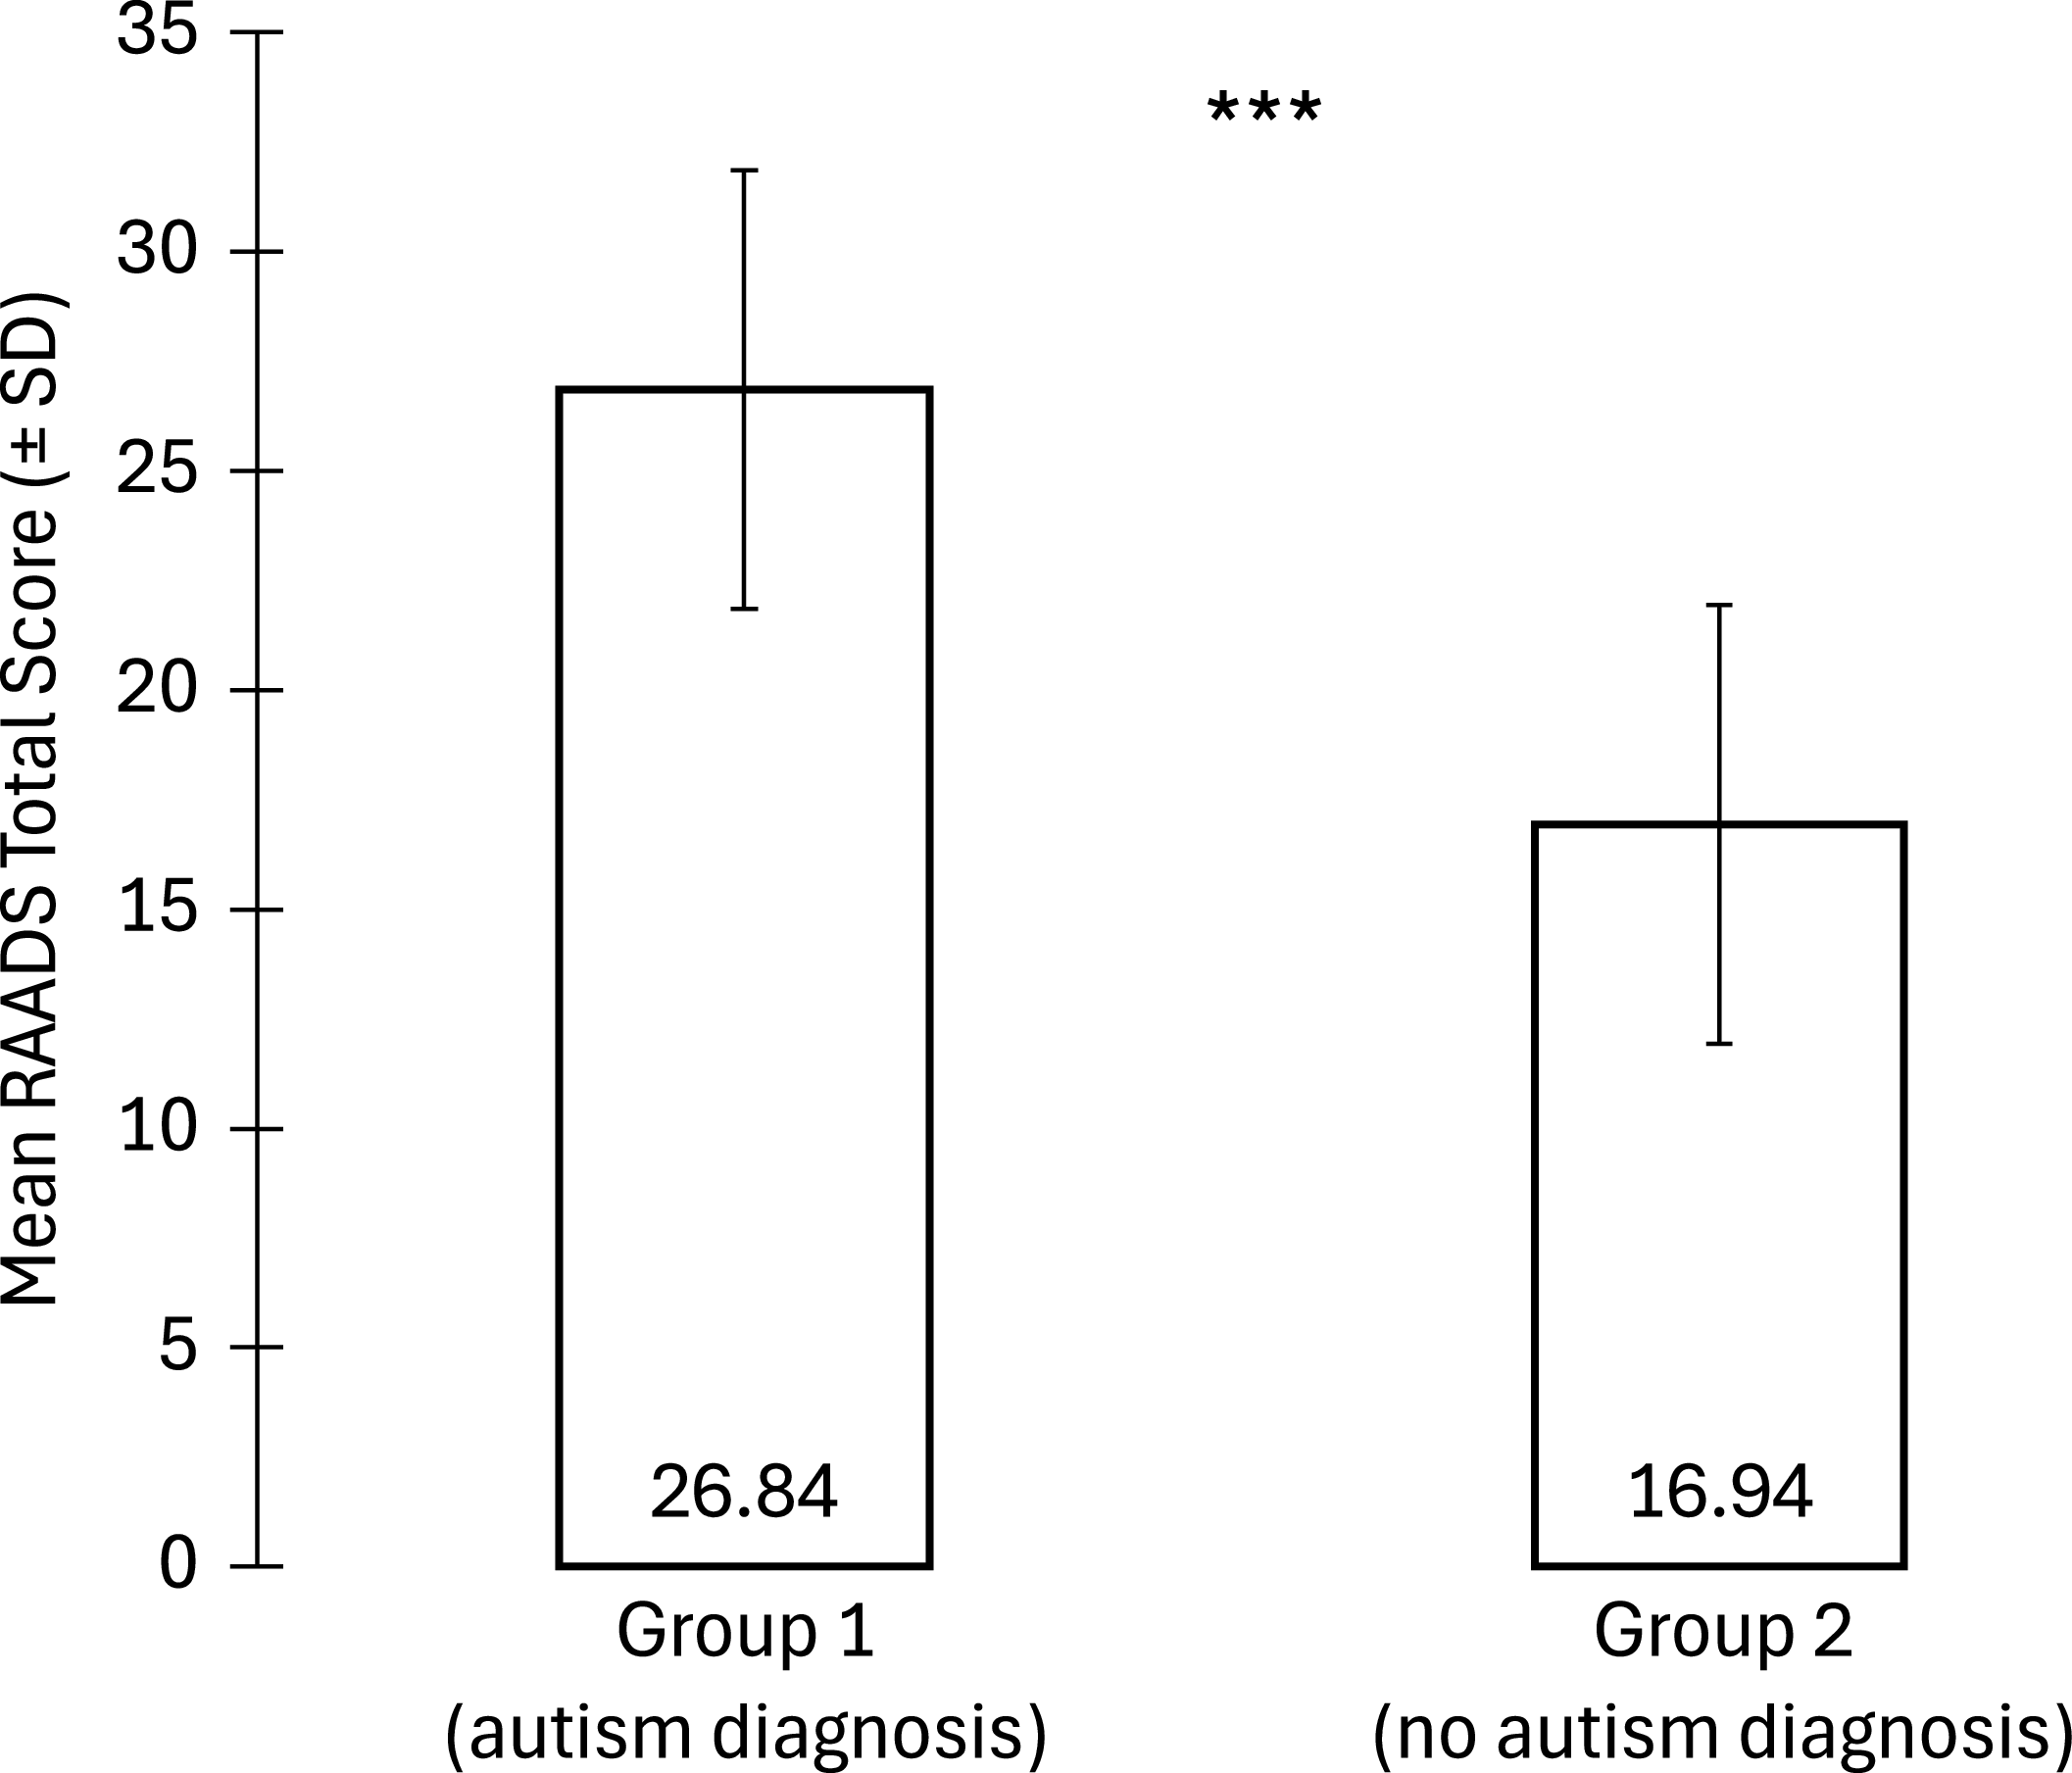
Total RAADS-14 scores differed significantly between the dual diagnosis and ADHD only groups. Participants in group one had significantly higher total RAADS-14 scores (M = 26.84, SD = 9.58) than those in group two (M = 16.94, SD = 8.55), t(df) = 4.09, p < 0.001, Cohen’s d = 1.10, indicating a large effect size. The 95% CI of 0.53–1.67, is broad reflecting the small sample size (see Fig. 1).
Mean RAADS-14 total scores for participants with and without an autism diagnosis. Group 1 (Dual diagnosis) had significantly higher scores (M = 26.84, SD = 9.58) than Group 2 (ADHD only); M = 16.94, SD = 8.55), t(df) = 4.09, p < 0.001, Cohen’s d = 1.10, indicating a large effect size. significance: * p < 0.05, ** p < 0.01, *** p < 0.0001.

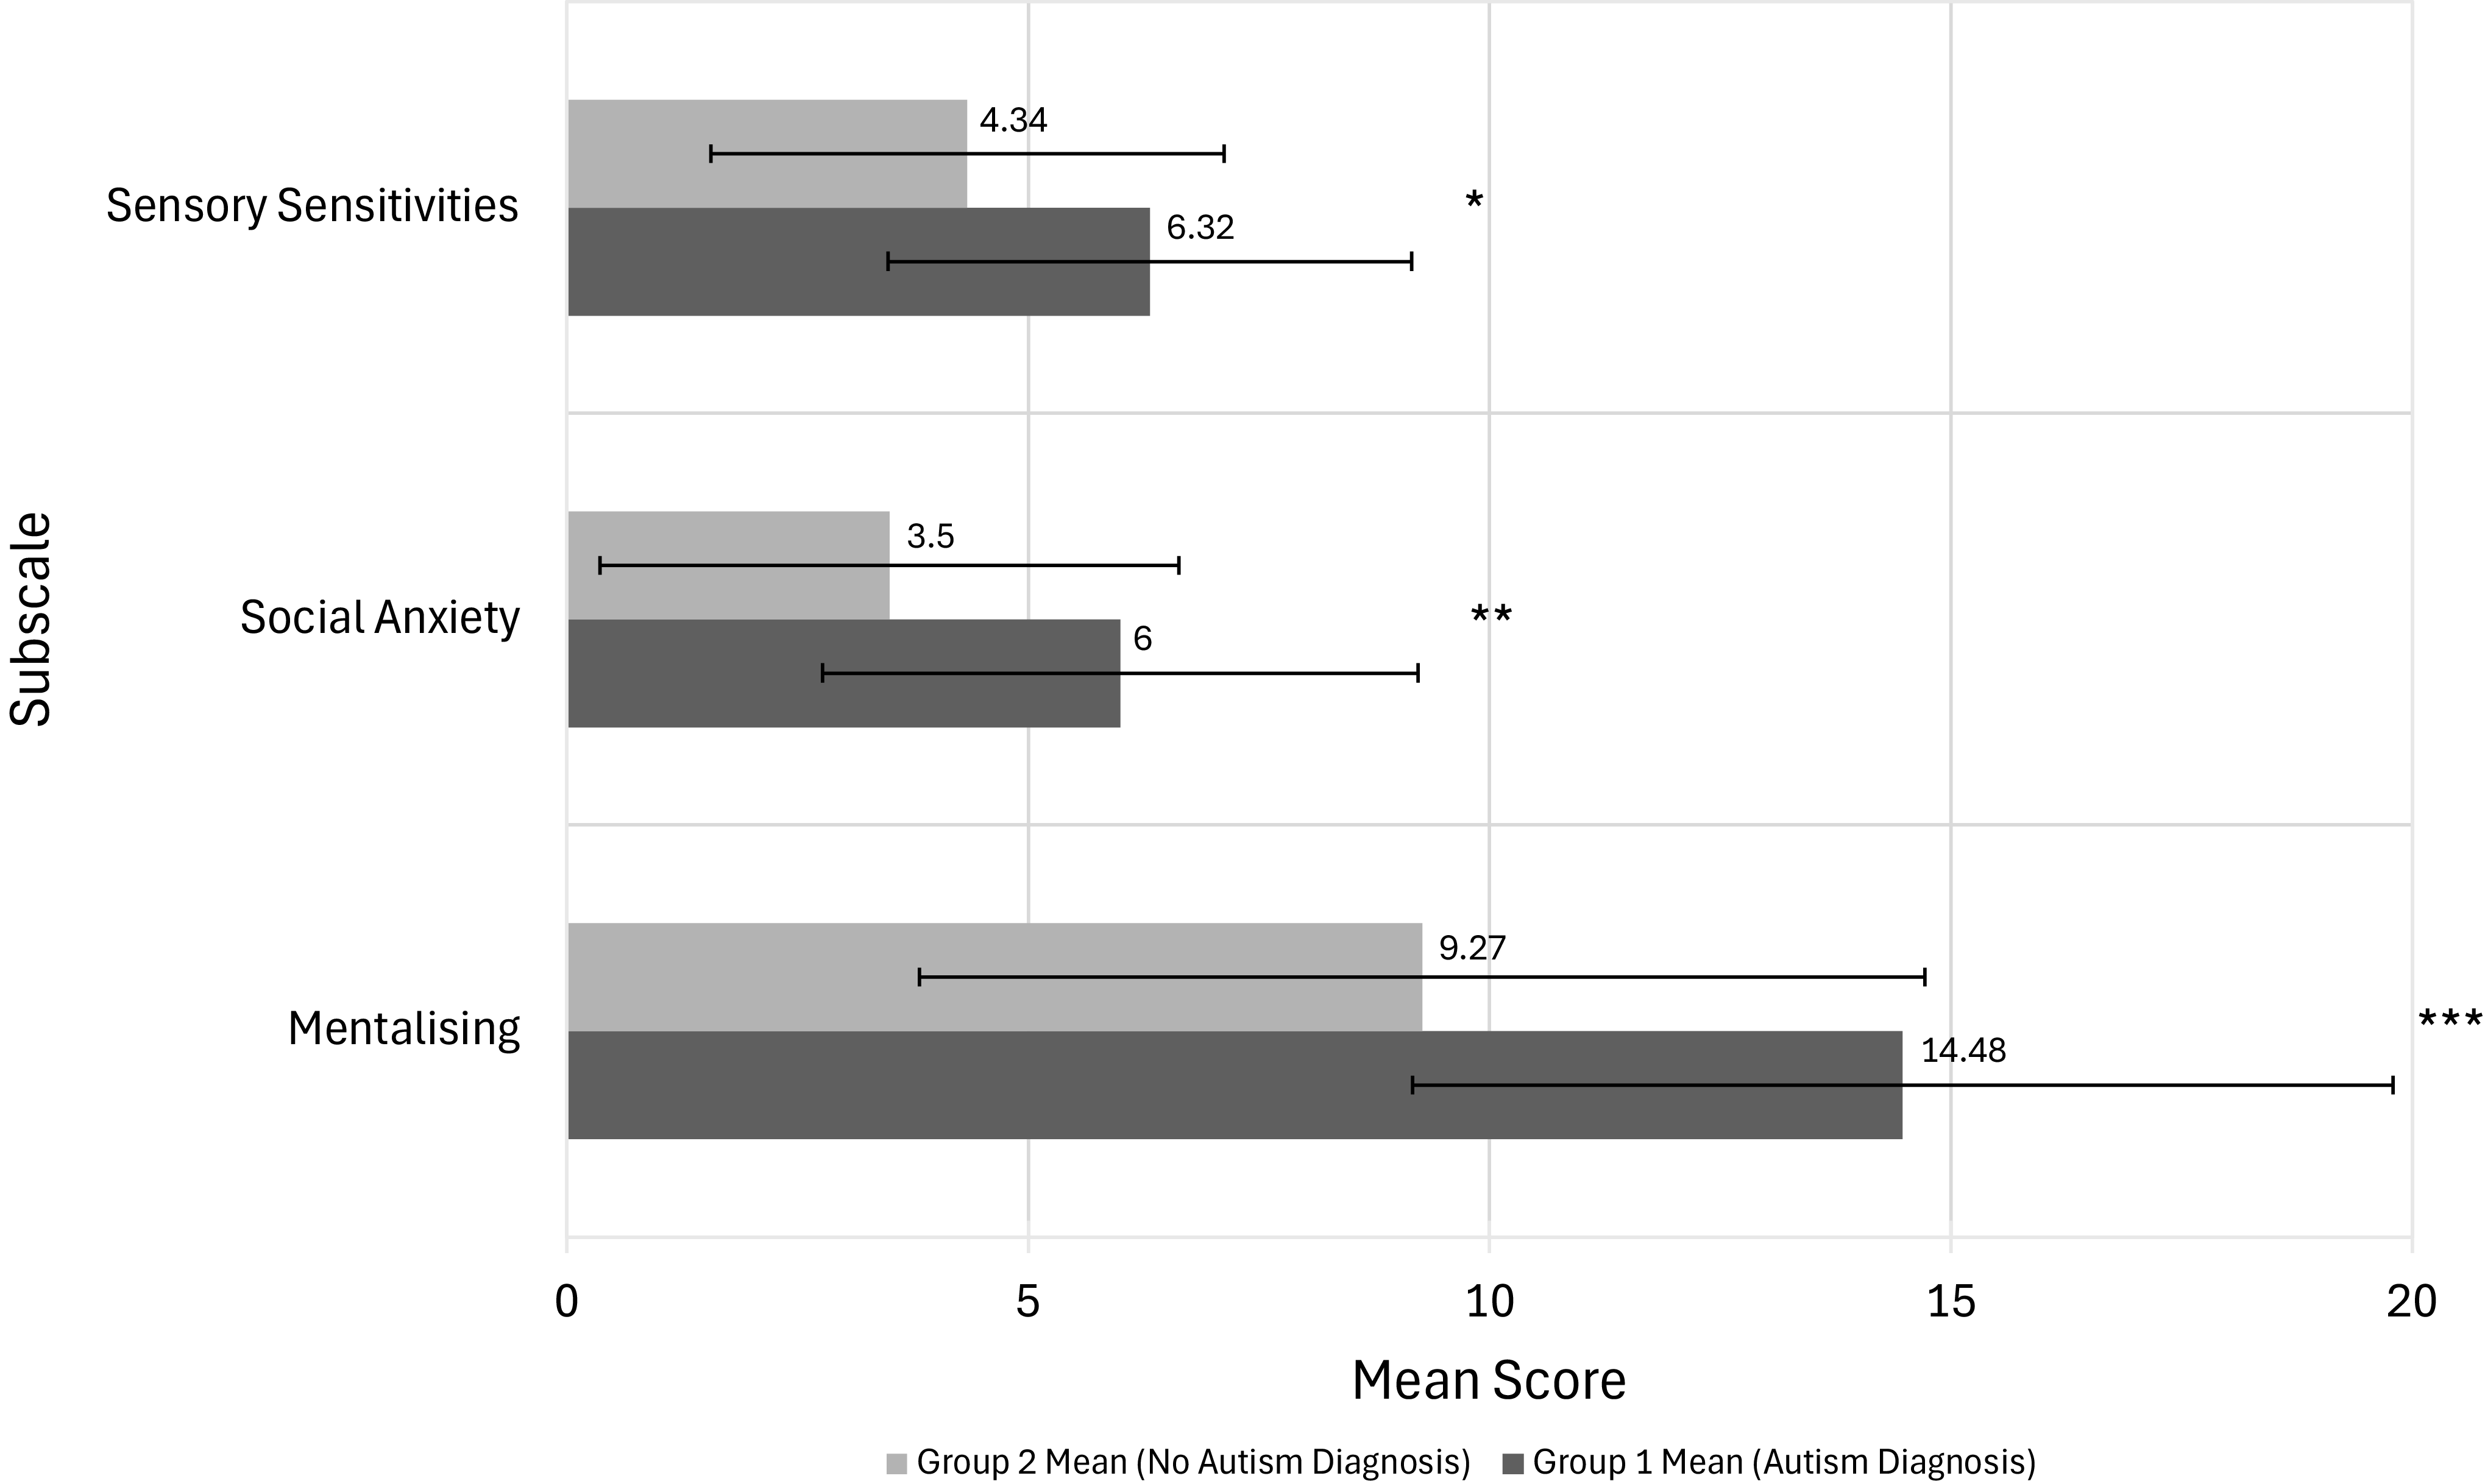
Subscale comparisons also showed significant inter-group differences. Group one scored higher across all RAADS-14 subscales, with statistically significant differences at p < 0.0001 for Mentalising, p < 0.01 for Social Anxiety, and p < 0.05 for Sensory Sensitivities (see Fig. 2).
Comparison of mean RAADS-14 subscale scores between ADHD individuals with and without an autism diagnosis. Error bars represent ±1 SD. Statistical significance was assessed using independent samples t-tests. Significance: * p < 0.05, ** p < 0.01, *** p < 0.0001.

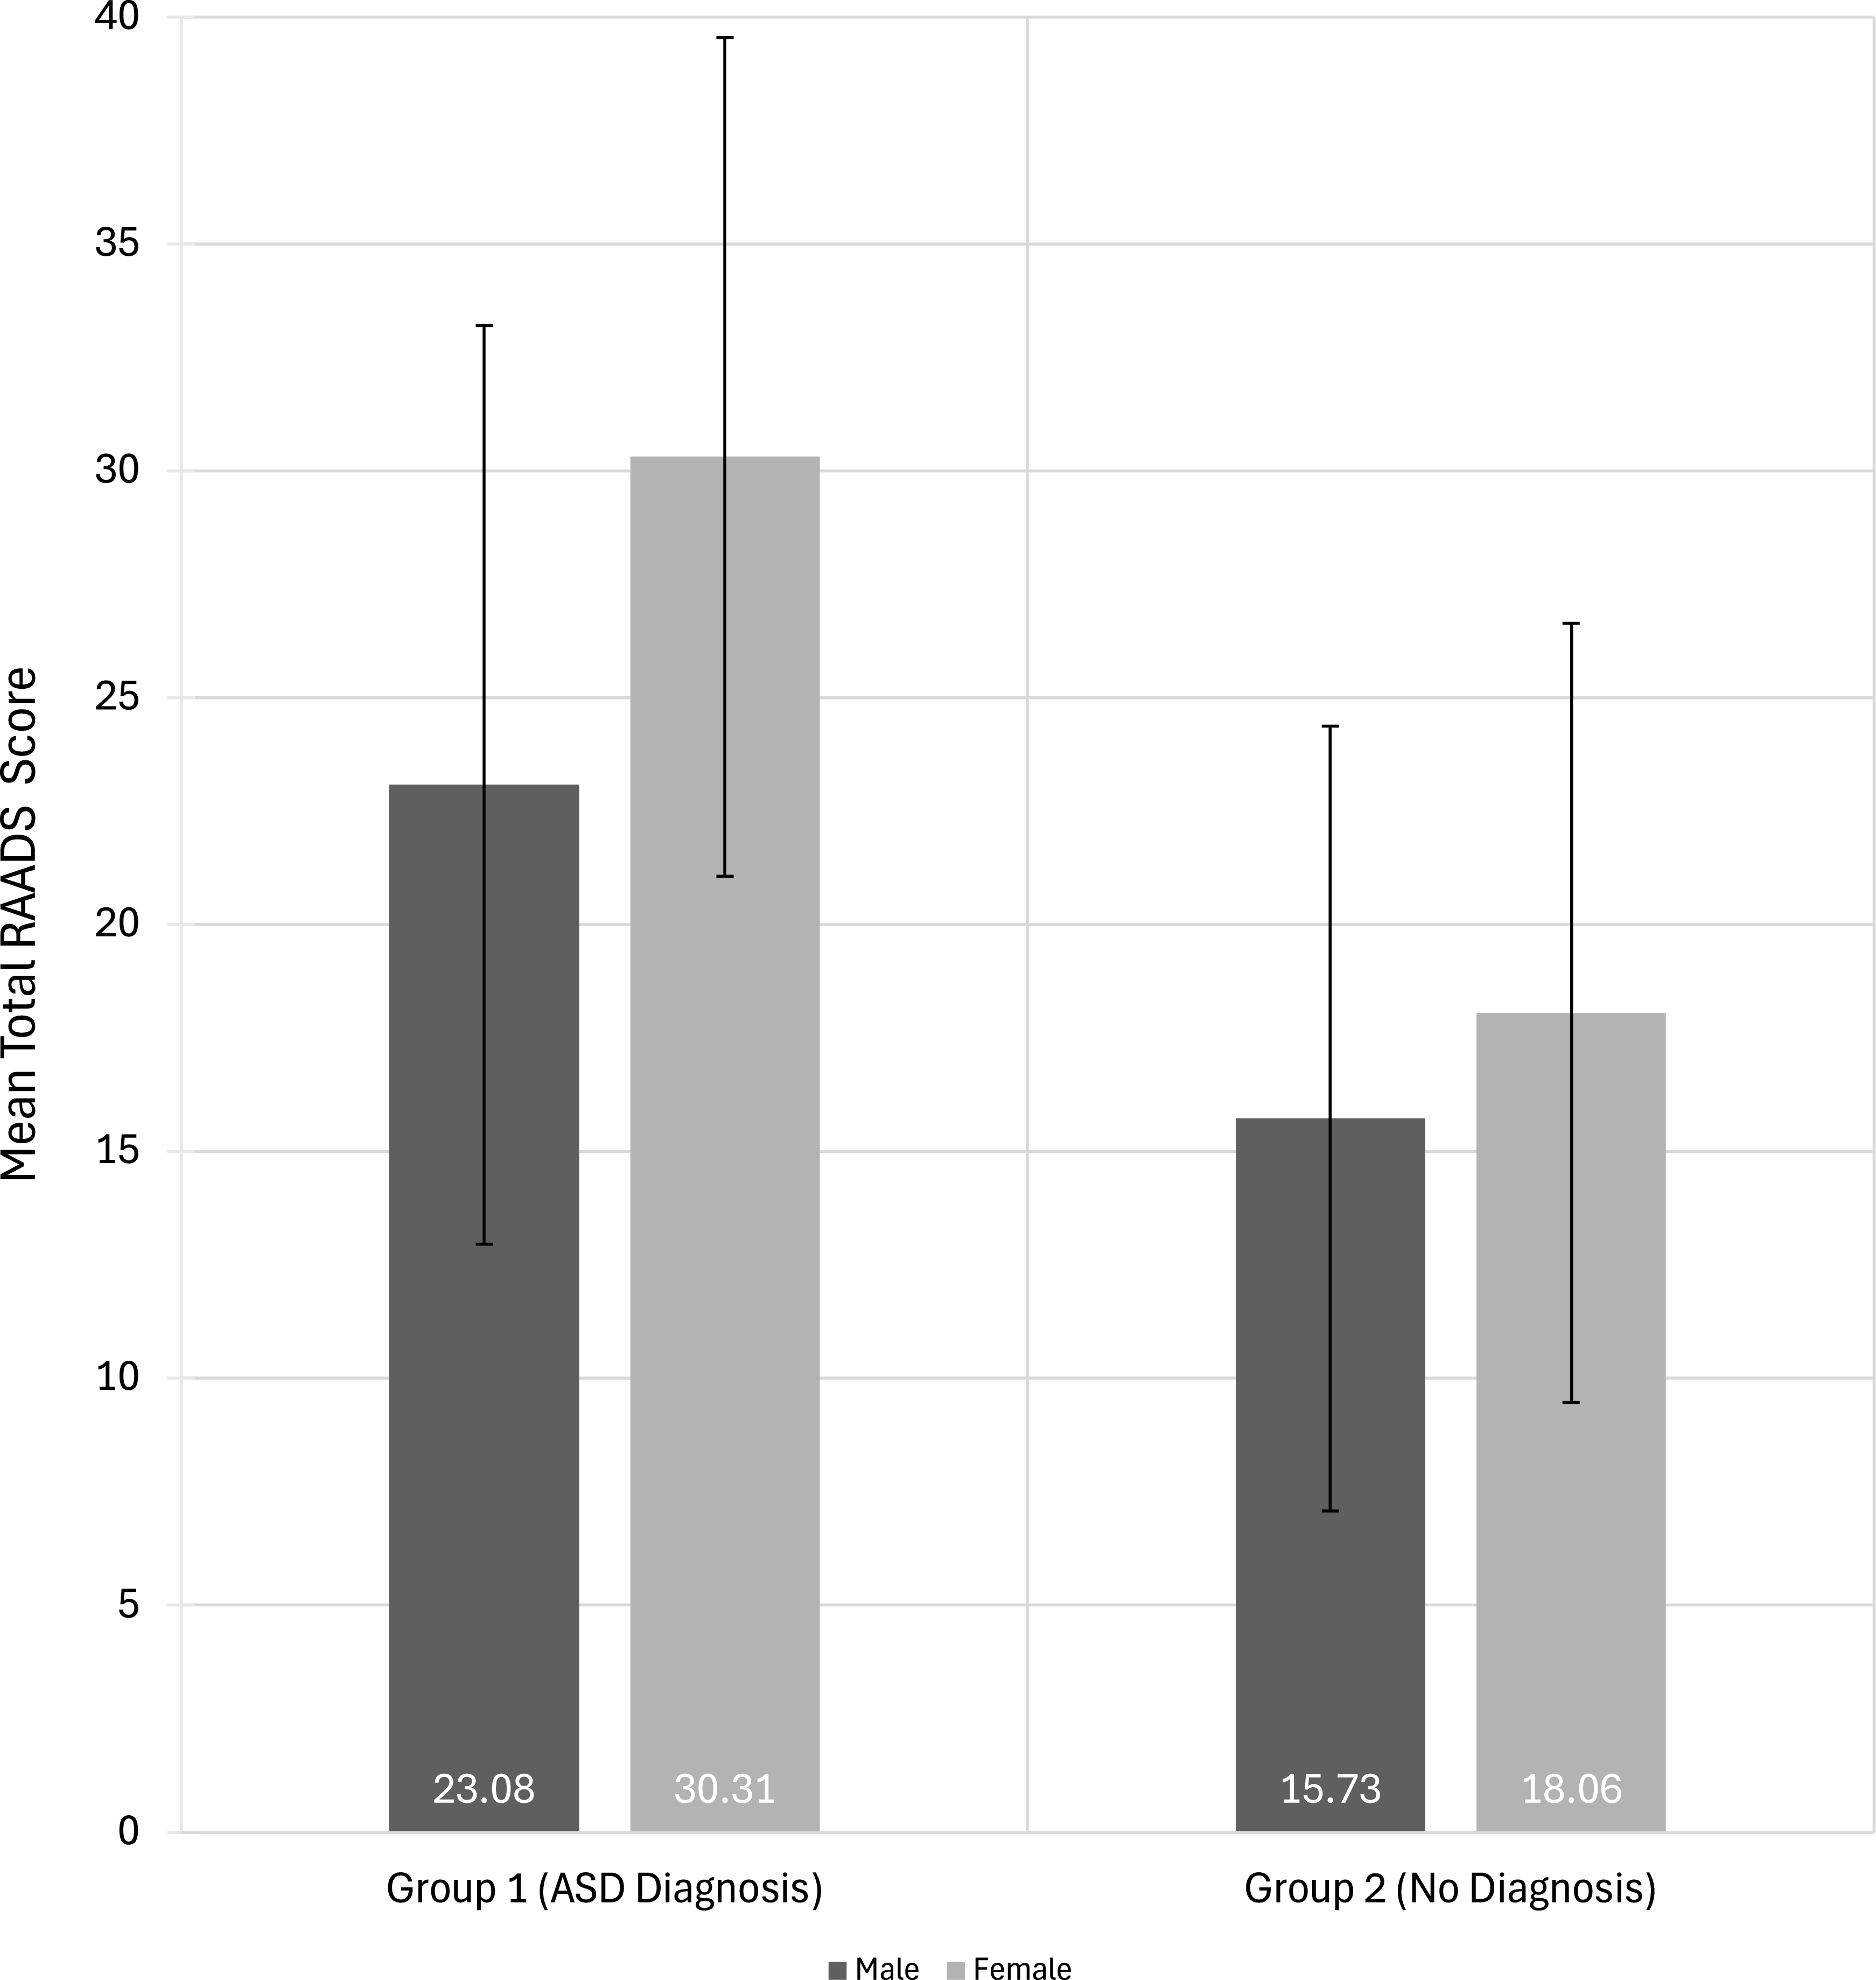
Gender differences were additionally examined between groups. Within group one, autistic females reported higher total RAADS-14 scores (M = 30.31, SD = 9.25) than autistic males (M = 23.08, SD = 10.13). In contrast, the gender difference in group two (ADHD only) was smaller, with females scoring M = 15.73 (SD = 8.59) and males M = 18.06 (SD = 8.65) (see Fig. 3).
Bar chart showing the mean RAADS-14 total scores with standard deviation error bars for males and females in each diagnostic group. Autistic females (Group 1) reported higher mean scores (M = 30.31) than autistic males (M = 23.08), while the difference between genders was smaller in the ADHD only group (Group 2).

Within group gender comparisons
The main statistically significant difference between males and females in both groups was for significant differences in females for sensory sensitivities.
For group one (dual diagnosis)
Autistic females scored higher than autistic males across all subscales:
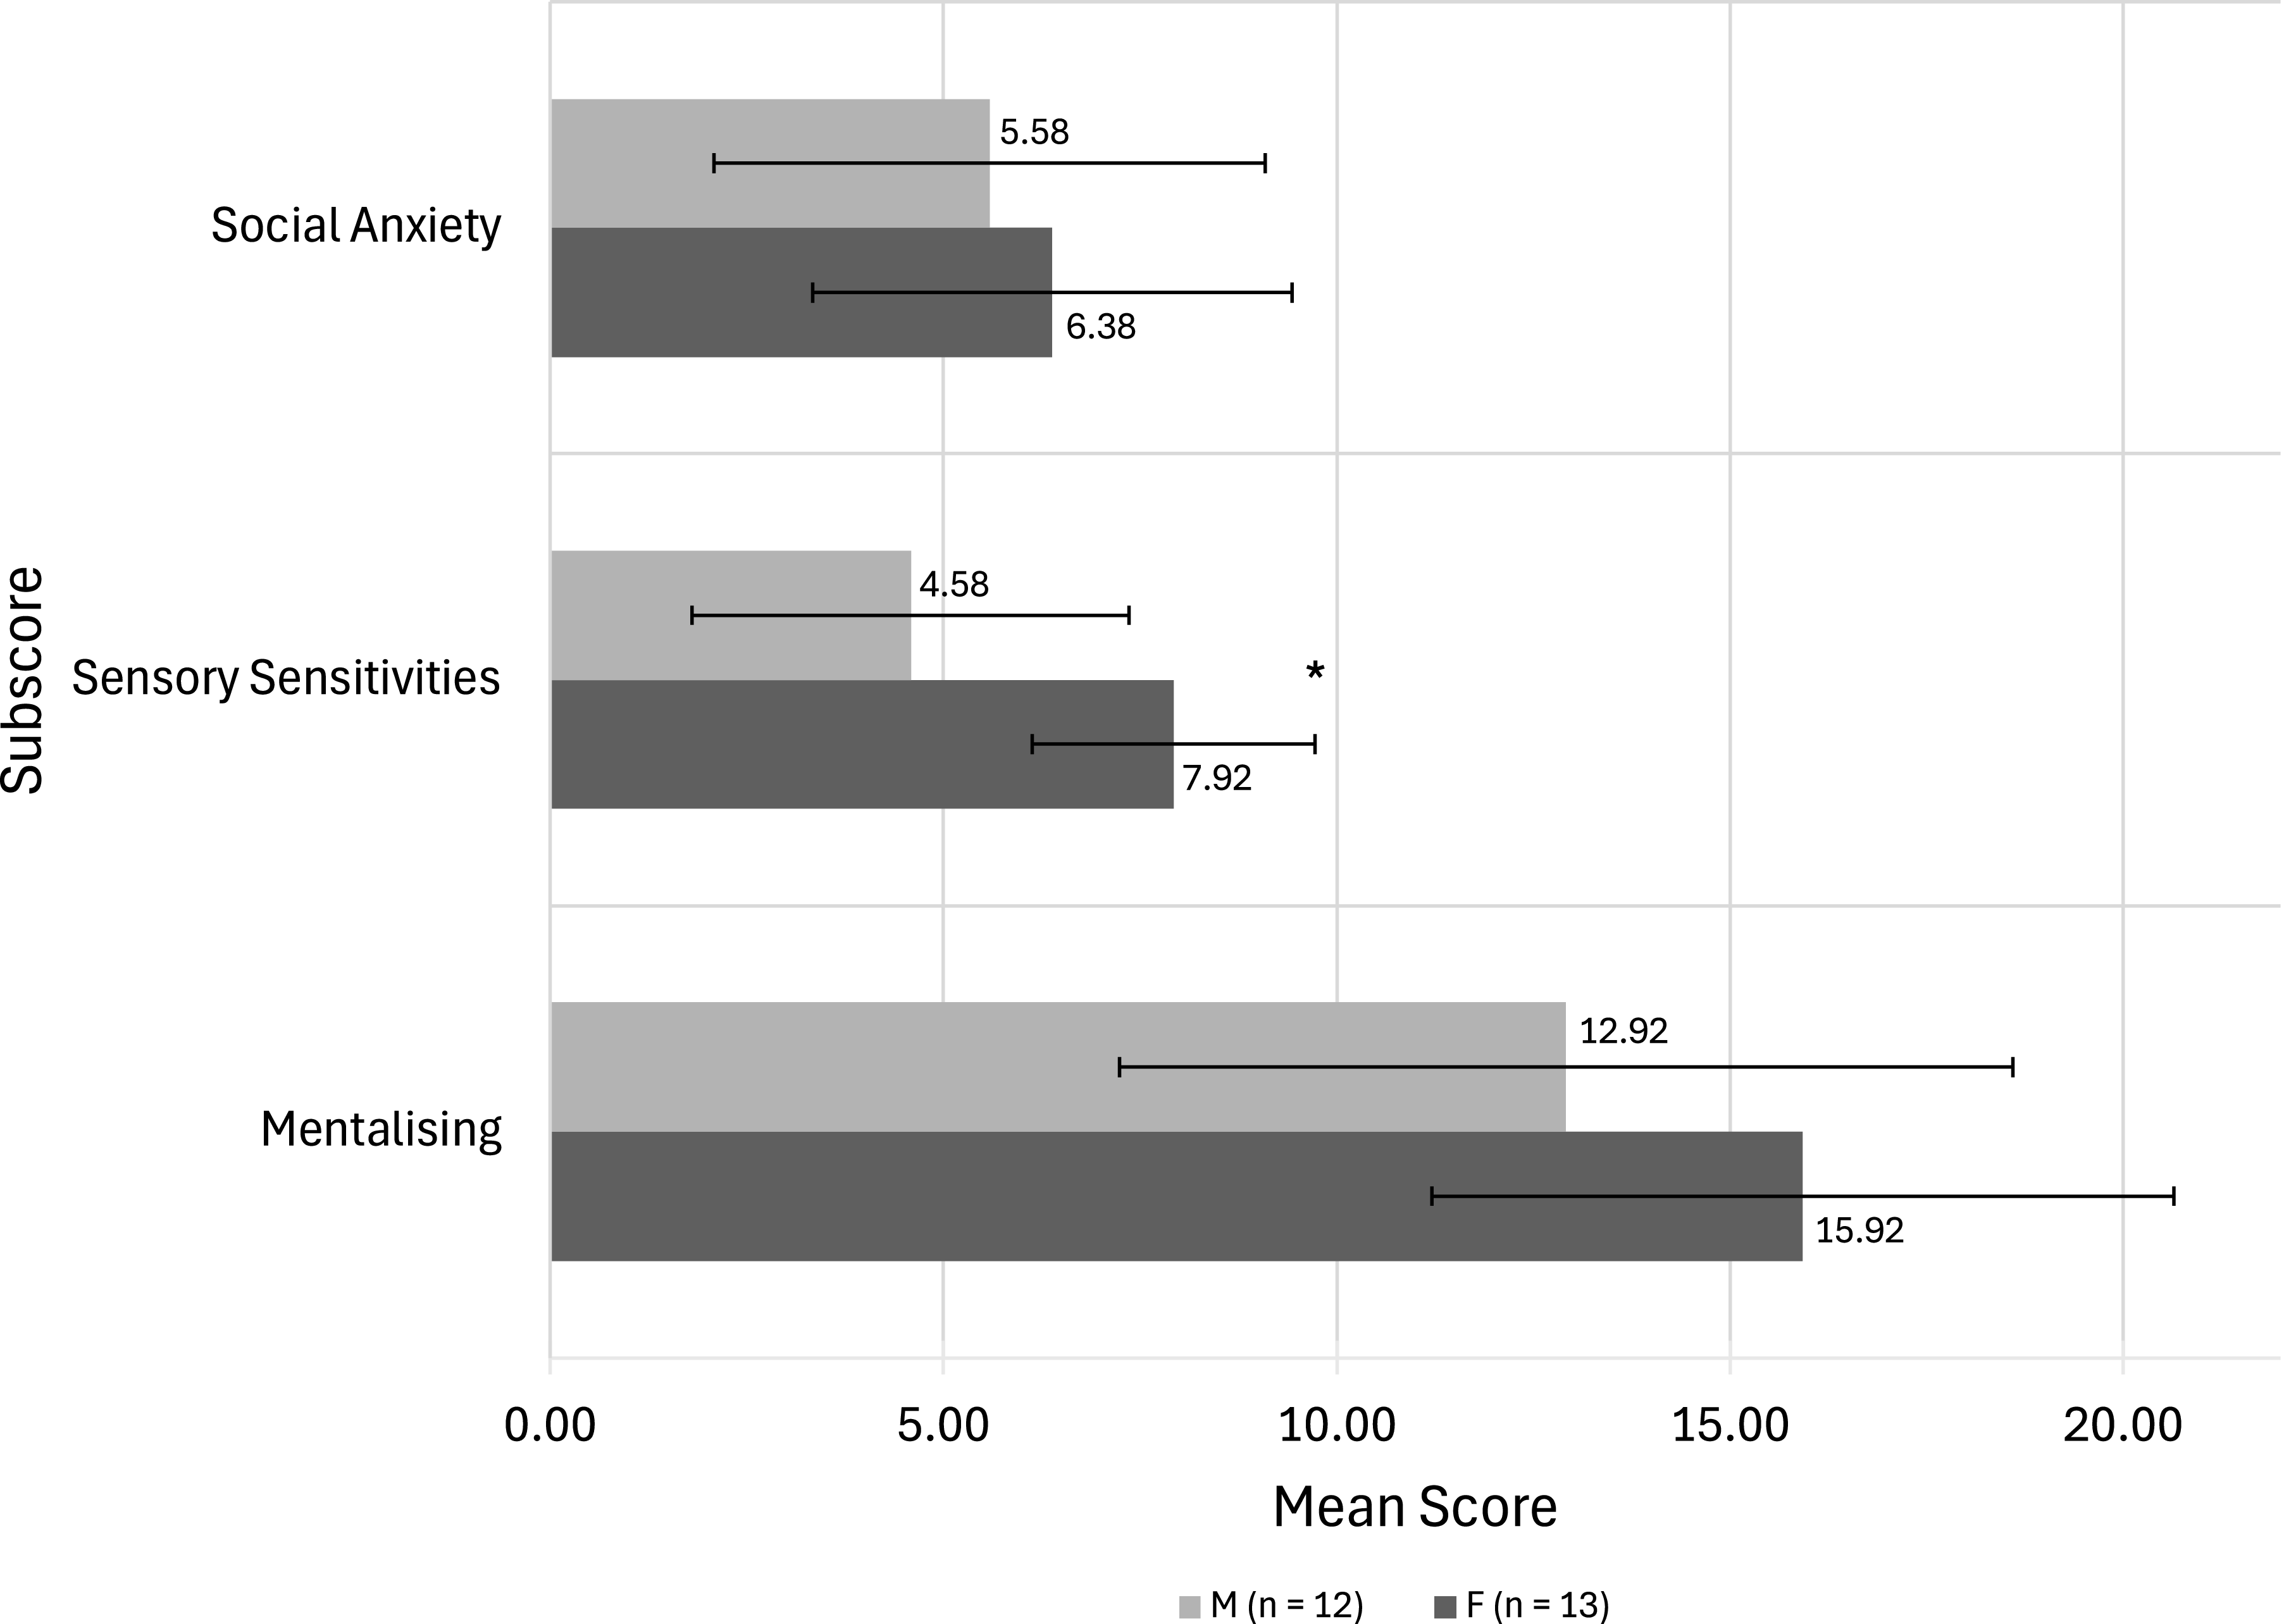
Mentalising: M(female) = 15.92 (SD = 4.72) vs M(male) = 12.92 (SD = 5.68); p = 0.166, Cohen’s d = 0.58 (medium effect, not statistically significant).
Social Anxiety: Autistic females scored 0.80 points higher than autistic males, M(female) = 6.38 (SD = 3.04) vs M(male) = 5.58 (SD = 3.50); p = 0.549, Cohen’s d = 0.25 (small effect, not statistically significant).
Sensory Sensitivities: Autistic females scored 3.34 points higher than autistic males, M(female) = 7.92 (SD = 1.80) vs M(male) = 4.58 (SD = 2.78); p = 0.002, Cohen’s d = 1.44 (large effect, statistically significant) (see Fig. 4).
Group 1 – Autism Diagnosis subscore comparison by gender. Mentalising: Autistic females scored higher than autistic males (15.92 vs 12.92); p = 0.166, Cohen’s d = 0.58 → medium effect, but not statistically significant. Social Anxiety: Slightly higher in autistic females than autistic males (6.38 vs 5.58); p = 0.549, Cohen’s d = 0.25 → small effect, not significant. Sensory Sensitivities: Markedly higher in autistic females than autistic males (7.92 vs 4.58); p = 0.002, Cohen’s d = 1.44 → large effect, statistically significant. Significance: * p < 0.05, ** p < 0.01, *** p < 0.0001.

For group two (ADHD only)
Gender differences were small or absent for most subscales:
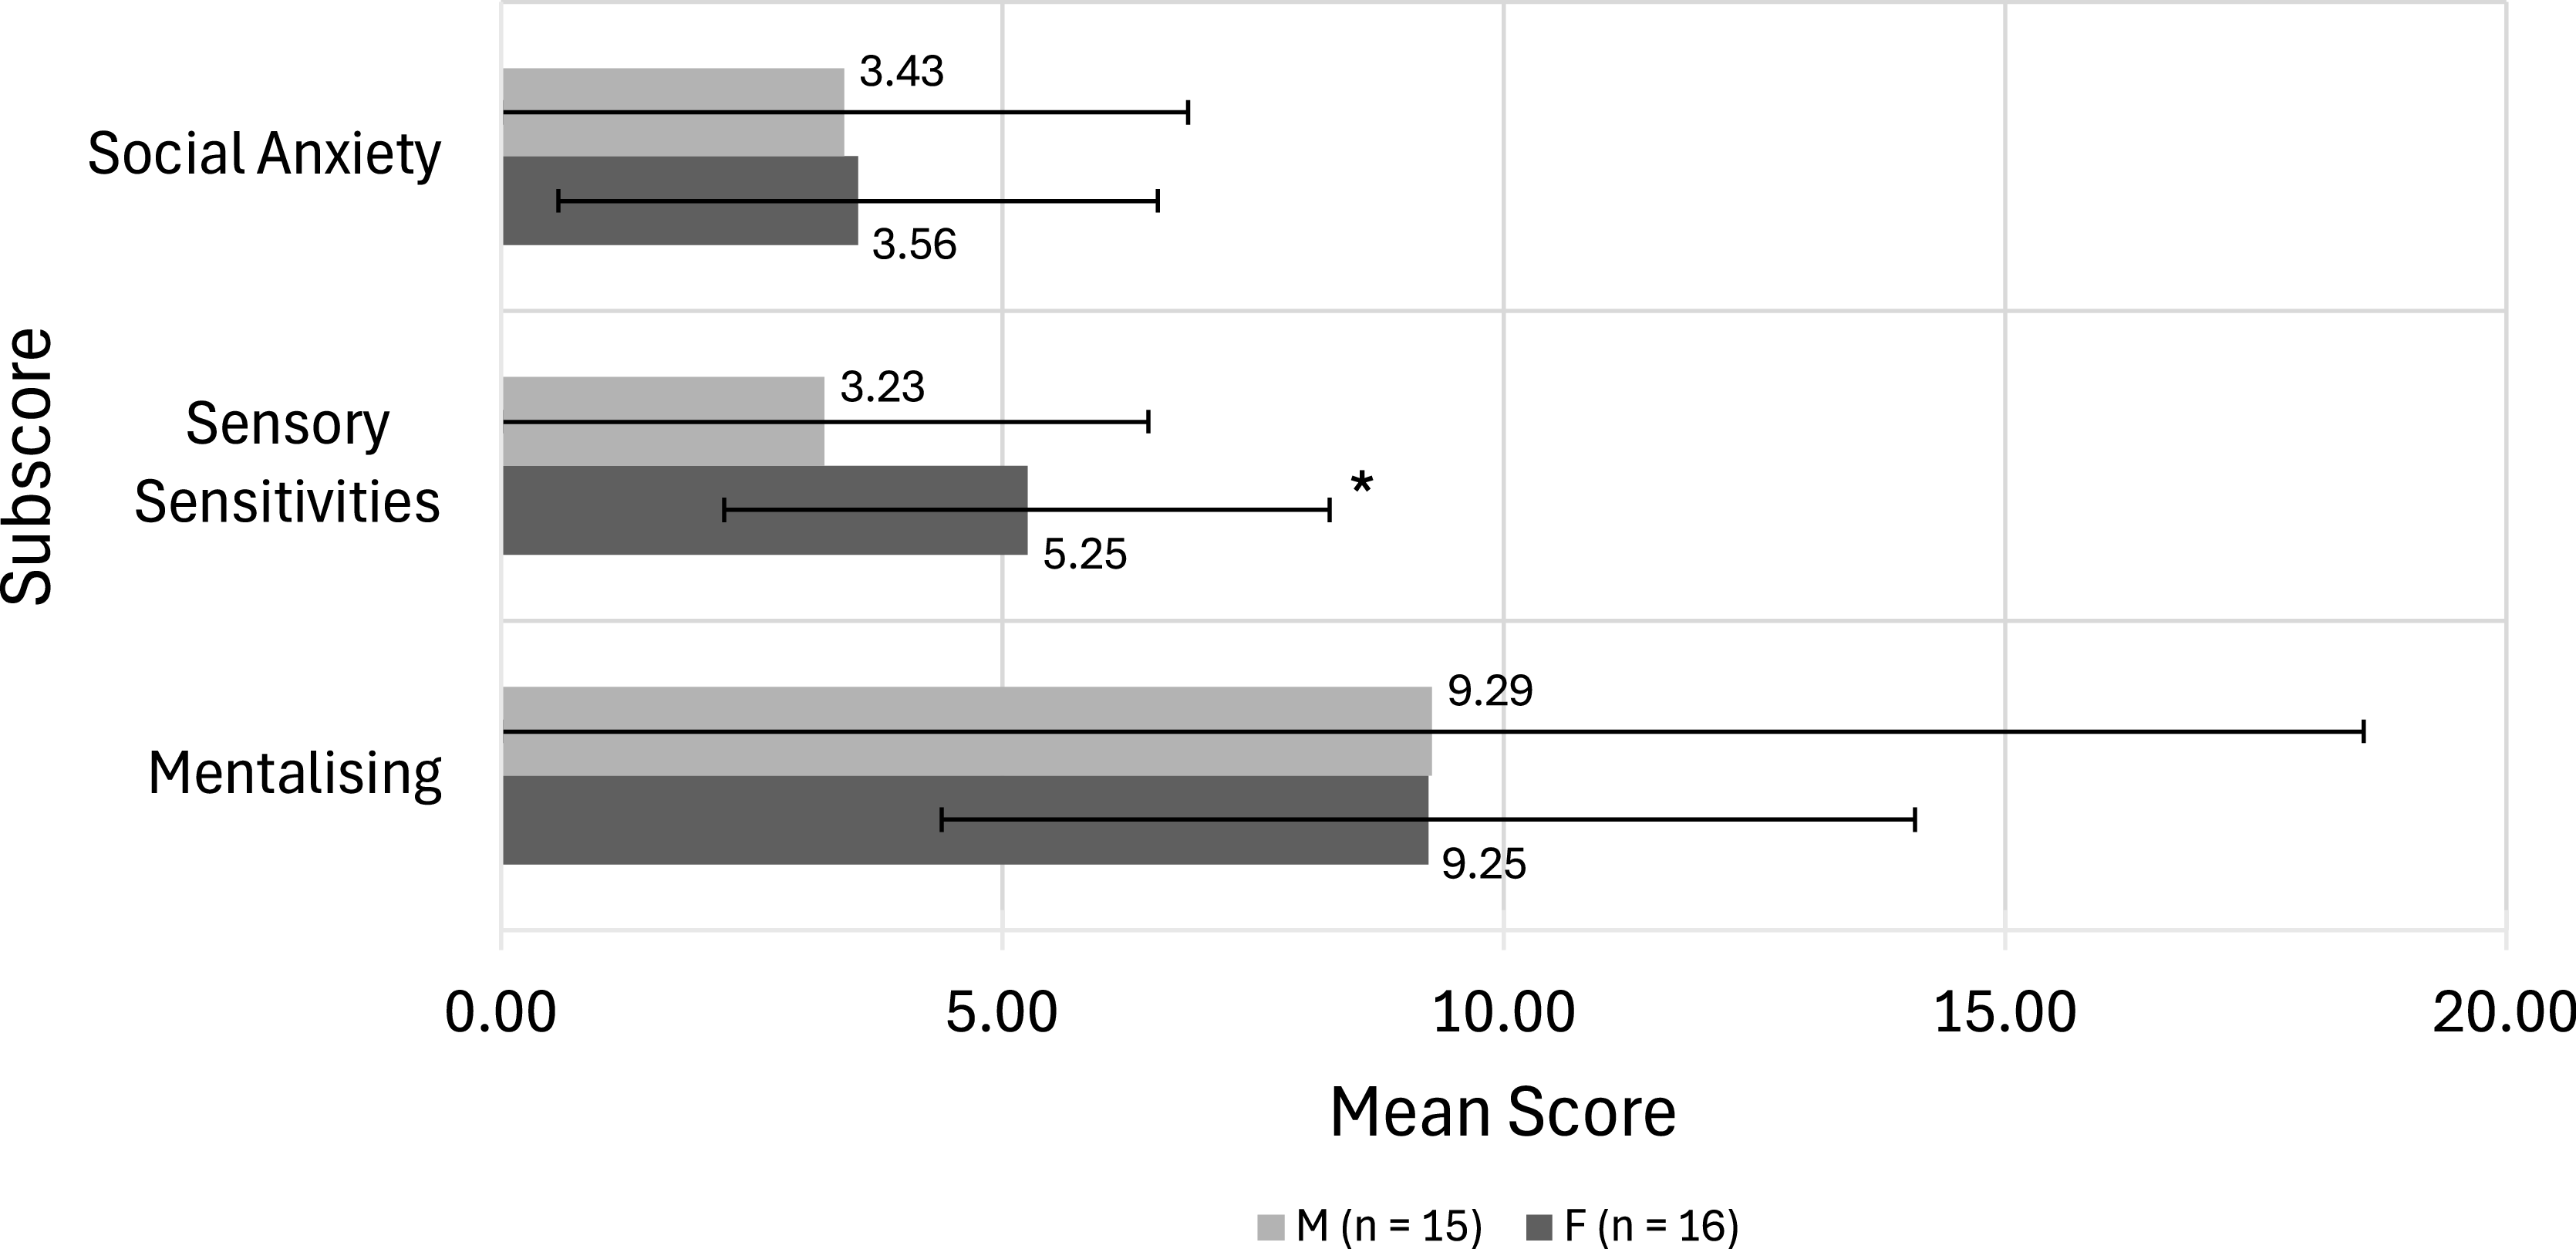
Mentalising: M(female) = 9.25 (SD = 4.85) vs M(male) = 9.29 (SD = 6.22); p = 0.986, Cohen’s d = −0.01 (negligible effect, not statistically significant).
Social Anxiety: M(female) = 3.56 (SD = 2.99) vs M(male) = 3.43 (SD = 3.55); p = 0.910, Cohen’s d = 0.04 (negligible effect, not statistically significant).
Sensory Sensitivities: Females scored 2.02 points higher than males, M(female) = 5.25 (SD = 3.02) vs M(male) = 3.23 (SD = 2.05); p = 0.042, Cohen’s d = 0.77 (medium effect, statistically significant) (see Fig. 5).
Group 2 – No Autism Diagnosis, ADHD only, sub score comparison by gender. Mentalising: No difference (9.25 vs 9.29); p = 0.986, Cohen’s d = −0.01 → negligible effect, not significant. Social Anxiety: Minimal difference (3.56 vs 3.43); p = 0.910, Cohen’s d = 0.04 → negligible effect, not significant. Sensory Sensitivities: Higher in females (5.25 vs 3.23); p = 0.042, Cohen’s d = 0.77 → medium effect, statistically significant. Significance: * p < 0.05, ** p < 0.01, *** p < 0.0001.

Diagnostic threshold analysis
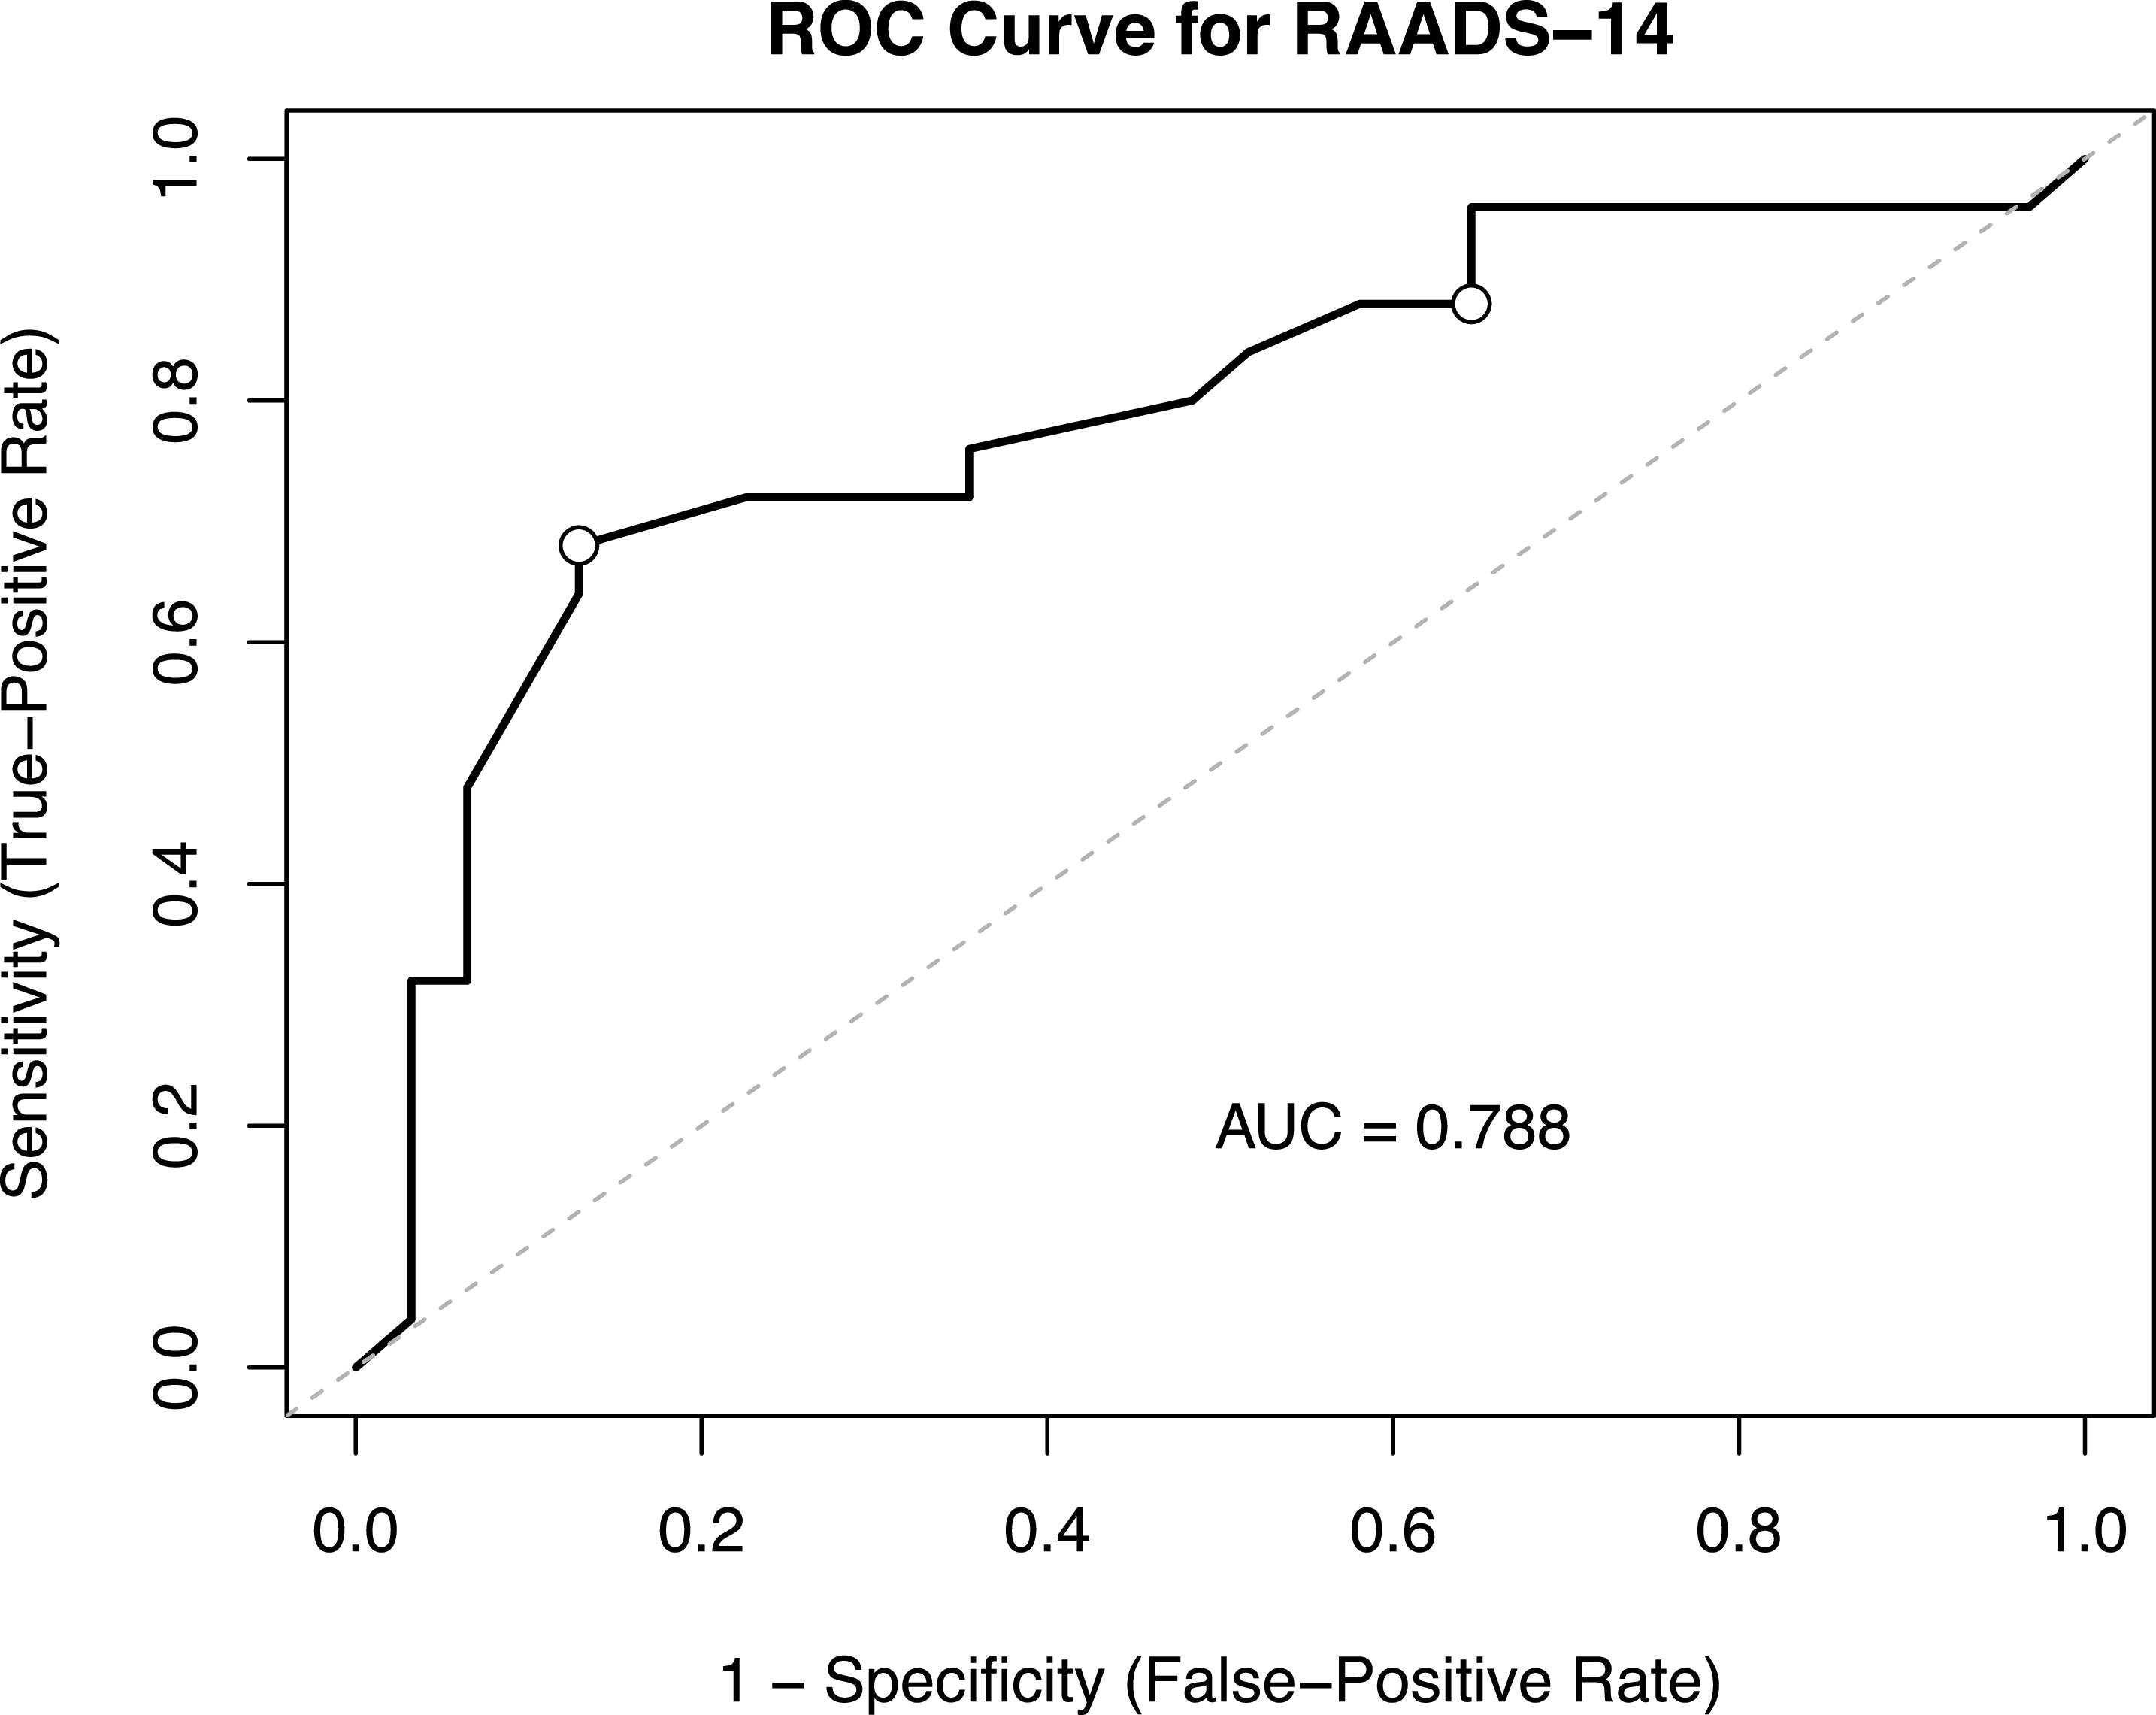
A calculation of Area Under the Curve for the ROC analysis using the 24.5 cut of gave a result of 0.788. 95% CI was 0.662-0.9148. This demonstrates fair-to-good discriminative ability. The relatively wide CI reflects the small sample size.
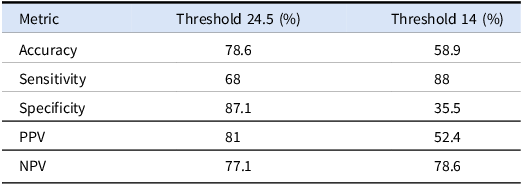
The threshold of 24.5 had an accuracy of 78.6%, sensitivity of 68%, specificity of 87.1% with PPV (positive predictive values) of 81% and NPV of 77.1% (see Fig. 6).
Discriminating power of the RAADS-14 Screen Receiver operating characteristics (ROC) A Threshold of 24 had a sensitivity = 0.68 and specificity = 0.8709677 Threshold that maximised Youden’s Index (sensitivity + specificity − 1): (RAADS ≥ 24.5). A different method, Closest to Top-Left, produced the same result.

In comparison a threshold of 14 gave an accuracy of 58.9%, sensitivity of 88%, specificity of 35.5%, PPV of 52.4 % and NPV of 78.6% (see Table 3).
Comparison of Confusion Matrices: A comparison of confusion matrix was used to evaluate and compare the performance of different cut off (14 vs 24.5) by looking at accuracy, sensitivity, specificity, positive predictive value (PPV) and negative predictive value (NPP)

Table 3. Long description
A table with two columns and five rows comparing performance metrics at two different thresholds: 24.5 percent and 14 percent. The metrics include accuracy, sensitivity, specificity, positive predictive value (PPV), and negative predictive value (NPV). Row 1: Accuracy, Threshold 24.5 (percent): 78.6, Threshold 14 (percent): 58.9. Row 2: Sensitivity, Threshold 24.5 (percent): 68, Threshold 14 (percent): 88. Row 3: Specificity, Threshold 24.5 (percent): 87.1, Threshold 14 (percent): 35.5. Row 4: PPV, Threshold 24.5 (percent): 81, Threshold 14 (percent): 52.4. Row 5: NPV, Threshold 24.5 (percent): 77.1, Threshold 14 (percent): 78.6.
Discussion
Our study set out to look at the occurrence of autism in a group of young adults with ADHD at the point of transition to an adult service. We were also interested in looking at overlap of features and gender differences between groups.
Co-occurrence of autism in the group of young adults with ADHD was high at 53%. Not all autistic ADHD young people had been identified at the point of transfer.
This is part can potentially be explained by separate pathways for autism and ADHD in Ireland with autism falling within the remit of Primary Care Services and Disability Services and ADHD falling under CAMHS. Single condition pathways risk additional neurodevelopmental disorders not being detected.
Overlap of feature of ADHD and Autism may contribute to only one condition being identified initially. Co-occurring mental illness may also contribute to complexity of presentation and missed diagnoses.
Women and girls are more likely to have their experiences misunderstood as internalising conditions and misdiagnosed with eating disorders, borderline personality disorders, anxiety and depression (Bougeard et al. Reference Bougeard, Picarel-Blanchot, Schmid, Campbell and Buitelaar2021).
Features may be masked through environmental accommodations and or employment of compensatory strategies and coping mechanisms that are not necessarily adaptive and functional. Increasing demands such as those that appear at life cycle transitions may result in these accommodations or adaptations no longer being viable or effective (Young Reference Young, Hollingdale, Absoud, Bolton, Branney, Colley, Craze, Dave, Deeley, Farrag, Gudjonsson, Hill, Liang, Murphy, Mackintosh, Murin, O’Regan, Ougrin, Rios, Stover, Taylor and Woodhouse2020).
Differences between the RAADS-14 scores in the autism and non-autism ADHD groups was statistically significant, with mean scores for the autism group being 26.84 (SD 9.58) and ADHD only group 16.94 (SD 8.55). The broad confidence range of 0.53 to 1.67 reflects the smaller sample size. Differences between the sub scores between groups were significant, and in particular, in the mentalizing and social anxiety sub scores with p values of <0.0001 and <0.01 respectively. A nonsignificant trend of difference in sensory sensitivity sub scores was observed.
Using the suggested cut-off of the RAADS-14 for a psychiatric population of 14 was highly sensitive at 88% with lower specificity at 35.5%. Using the suggested higher threshold of 24 yielded a threshold of 68% sensitivity and 87% specificity. The Area Under the Curve using the 24.5 cut off, of 0.788 suggests a fair to good discriminative ability. At this cut off there is a 78.8% chance that a randomly chosen individual with autism will have a higher RAADS score than a randomly chosen individual without autism. This suggests that this tool has clinical utility alongside clinical judgement. It is however important to exercise caution given the significant disadvantages conferred by missed diagnoses.
Higher scores in the ADHD population were described by the authors of the RAADS-14 though no specific cut off given. The lower cut off (14) as such may have application when triaging within a select group for further assessment, whilst the higher cut off (24) may be more appropriate when surveying a clinical population
Similar findings and suggested higher cut off,(21-22), were described when surveying autism using the RAADS-14 in a psychiatric population (Nyrenius et al. Reference Nyrenius, Eberhard, Ghaziuddin, Gillberg and Billstedt2022). Screening measures have been described as a helpful addition to the assessment of autism. When they are used it is with caution and in combination with other sources of information. Screening measures should not be used in isolation to determine whether further assessment of possible autism is indicated (PSI 2022). If used alone from these results there is a risk of missed diagnoses 22% of the time., demonstrating the importance of clinically judgement and multiple sources of information.
Autistic females scored higher than males in total RAADS-14 scores and in all sub section scores, suggesting that autistic females need to show a higher level of symptomatology to be detected. This has been proposed in the literature and diagnostic tools originally tested with predominance of male participants attributed (Kreiser and White Reference Kreiser and White2014). Autistic females have been shown to “mask” their autism features more than males, meaning that a significant proportion may be missed (Hull et al. Reference Hull, Petrides, Allison, Smith, Baron-Cohen, Lai and Mandy2017, Maciver et al. Reference Maciver, Roy, Johnston, Boilson, Curnow, Johnstone-Cooke and Rutherford2025)
Sensory sensitivities were significantly higher in both dual diagnosis and ADHD only females compared to males.
The presence of sensory sensitivities has been recognised as identifiers of NCDs (Elwin et al. Reference Elwin, Schröder, Ek, Wallsten and Kjellin2017). These findings would suggest their presence may be a significant hallmark of neurodevelopmental differences and especially in females.
We conclude that a significant proportion of young people seeking care for ADHD are also autistic. The RAADS-14 seems to be a suitable screening instrument for Autism in this group. Higher specificity (using the cut off, of 24) potentially reduces inefficiencies but, without clinical context could risk missed diagnoses. Screening tools need to be combined with clinical judgement.
Autism features were evident in the ADHD group who did not meet full diagnostic criteria for autism, reflected in the proportion of this group with scores over the cut off, of 14.
Not recognising cooccurrence risks over treating ADHD pharmacologically and missed opportunities for psychosocial supports. Subclinical threshold autism features in young adults with ADHD if present may benefit for specific targeted support for example sensory assessment and support.
The overlap of features evident in the two cohorts lends to the argument for consideration of neurodevelopmental approaches rather than single condition approaches when assessing for a NDC (Rutherford et al. Reference Rutherford, Maciver, Johnston, Prior and Forsyth2021).
Our understanding of autism, ADHD and other NDCs continues to evolve. Genetic mechanisms associated with neurodevelopmental differences are far more likely to reflect transdiagnostic processes than to be disorder-specific (Litman et al. Reference Litman, Sauerwald, Green Snyder, Foss-Feig, Park, Hao, Dinstein, Theesfeld and Troyanskaya2025). In turn they are more likely to reflect everyday life experiences (Astle et al. Reference Astle, Holmes, Kievit and Gathercole2022).
Transdiagnostic approaches encourage a broader assessment of cognition and behaviour compared to more limited symptom specific categorical diagnostic processes which can result in missed or inaccurate diagnosis, with important characteristics overlooked at the cost of identifying and meeting needs (Astle et al. Reference Astle, Holmes, Kievit and Gathercole2022).
Dimensional approaches allow for gradations in performance, negating artificial arbitrary diagnostic thresholds required in categorical approaches and more person-centred support. Adoption of such approaches will require significant service delivery change as current provision is centred around delivery of diagnostic targets.
Limitations
While only 56 of the cases were included in the analysis of differences between dual and ADHD only groups, differences between the dual diagnosis and ADHD only group with respect to RAADS-14 scores were significant with p values of <0.0001.
Significant differences were found for ADHD only females when compared to males on the sensory sensitivities’ subscale.
The final analytic sample is relatively small for a comparative cohort study. This limits the generalizability of the findings.
Young adults in our study who identified as transgender were omitted from the between and within group analysis, due to low numbers, though were included in the total prevalence analysis. This is a limitation which may be particularly impactful in the study of neurodivergence, as gender-diverse individuals are known to be disproportionately represented in this population (Corbett et al. Reference Corbett, Muscatello, Klemencic, West, Kim and Strang2023).
The potential for verification bias needs to be considered as the RAADS-14 was used at the point of intake. Selection for onward autism assessment was based on clinical judgement rather than the RAADS-14 score; however bias cannot be out ruled.
The RAADS-14 is based on DSM 4 criteria while diagnostic assessments carried out in the team adopted DSM 5 criteria, as it aligns with broader criteria for autism, despite this the RAADS-14 it is still thought to have validity.
Funding statement
This research received no specific grant from any funding agency, commercial or not-for-profit sectors.
Competing interests
Author(s) 1, 2, 4, 5 & 7 declare no competing interest. Author 3 has received research funding for clinical trials from Novartis, Roche and Harmony Biosciences (Zynerba). He has also received consultancy funding, paid to the University of Edinburgh, from Shionogi, Harmony Biosciences (Zynerba), Enthorin Therapeutics, Novartis, Roche and GEXVal. Author 6 is founder of Autistic Doctors International and AutDoc Solutions Ltd.
Ethical standards
The authors assert that all procedures contributing to this work comply with the ethical standards of the relevant national and institutional committee on human experimentation and with the Helsinki Declaration of 1975, as revised in 2008. The authors assert that ethical approval for publication has been provided by the Research Ethics Committee Midlands Area and Corporate Division (HSE Dublin & Midlands), reference RRECB0224MB.