



1. Introduction
Flow in a thin film is affected by the boundary conditions of the film, especially when the thickness of the film approaches that of the interfacial layer (Oron, Davis & Bankoff Reference Oron, Davis and Bankoff1997; Bocquet & Charlaix Reference Bocquet and Charlaix2010). As an example, the presence of slippage at a solid–liquid interface affects flows in thin films as observed in the dewetting dynamics of thin polymer films (Kargupta, Sharma & Khanna Reference Kargupta, Sharma and Khanna2004; Fetzer et al. Reference Fetzer, Jacobs, Münch, Wagner and Witelski2005; Münch, Wagner & Witelski Reference Münch, Wagner and Witelski2005; Bäumchen & Jacobs Reference Bäumchen and Jacobs2009). The dynamics is more complex in bilayer or stratified films, because the flow depends on the relative viscosities and interfacial energies of the two layers in addition to the interfacial boundary conditions (Brochard-Wyart, Martin & Redon Reference Brochard-Wyart, Martin and Redon1993; Pototsky et al. Reference Pototsky, Bestehorn, Merkt and Thiele2004; Merabia & Bonet Avalos Reference Merabia and Bonet Avalos2008; Jachalski et al. Reference Jachalski, Peschka, Münch and Wagner2014). Liquid–liquid interfaces, in particular those between two polymers, often exhibit apparent slip (de Gennes Reference de Gennes1989; Brochard-Wyart & de Gennes Reference Brochard-Wyart and de Gennes1990; de Gennes & Brochard-Wyart Reference de Gennes and Brochard-Wyart1990), and have been studied with molecular dynamics simulations (Koplik & Banavar Reference Koplik and Banavar2006; Razavi, Koplik & Kretzschmar Reference Razavi, Koplik and Kretzschmar2014; Poesio, Damone & Matar Reference Poesio, Damone and Matar2017) and experiments (Lee et al. Reference Lee, Park, Morse and Macosko2009; Xu, Zhang & Shi Reference Xu, Zhang and Shi2016). Such an effective reduction of friction has important practical implications, e.g. for smart liquid-impregnated surfaces (Howell Reference Howell2015; Keiser et al. Reference Keiser, Keiser, Clanet and Quéré2017). The stability and dewetting of thin multilayer polymer films is also a subject of interest for physicists (Lambooy et al. Reference Lambooy, Phelan, Haugg and Krausch1996; Segalman & Green Reference Segalman and Green1999; Lal et al. Reference Lal, Malkova, Mukhopadhyay, Narayanan, Fluerasu, Darling, Lurio and Sutton2017; Peschka et al. Reference Peschka, Bommer, Jachalski, Seemann and Wagner2018), and finds applications in industry e.g. materials manufactured from coextrusion processes (Zhao & Macosko Reference Zhao and Macosko2002; Ponting, Hiltner & Baer Reference Ponting, Hiltner and Baer2010; Bironeau et al. Reference Bironeau, Salez, Miquelard-Garnier and Sollogoub2017; Chebil et al. Reference Chebil, McGraw, Salez, Sollogoub and Miquelard-Garnier2018).
Capillary-driven levelling occurs when an excess of interfacial area is relaxed by smoothing topographical perturbations, such as a thin film with a surface feature: a bump, a valley, a hole, etc. Typically, the levelling is driven by the surface tension  $\gamma$ of the liquid–vapour interface. The curvature of the free interface results in a Laplace pressure, and a gradient in the curvature induces flow, thereby reducing the surface energy of the system. The flow is mediated by the viscosity
 $\eta$ of the liquid. Capillary-driven levelling is a useful tool for studying fluid flow in nanofilms and can be used to investigate the boundary conditions (de Gennes, Brochard-Wyart & Quéré Reference de Gennes, Brochard-Wyart and Quéré2003). With well-known initial conditions, capillary-driven levelling has been used to study various interfacial polymeric properties, such as glass transition anomalies, confinement effects and nanorheology in thin polymers films (Buck et al. Reference Buck, Petersen, Hund, Krausch and Johannsmann2004; Fakhraai & Forrest Reference Fakhraai and Forrest2008; Yang et al. Reference Yang, Fujii, Lee, Lam and Tsui2010; Rognin, Landis & Davoust Reference Rognin, Landis and Davoust2011; Teisseire et al. Reference Teisseire, Revaux, Foresti and Barthel2011; Chai et al. Reference Chai, Salez, McGraw, Benzaquen, Dalnoki-Veress, Raphaël and Forrest2014). Previous work on nanorheology in thin films has shown that, in addition to the importance of surface tension and viscosity, the flow is sensitive to the boundary conditions (Münch et al. Reference Münch, Wagner and Witelski2005; Xu et al. Reference Xu, Bandyopadhyay, Shi, An, Sharma and Joo2011; Jachalski et al. Reference Jachalski, Peschka, Münch and Wagner2014). The capillary-levelling technique was applied to a variety of geometries and configurations, which range from imprinted nano-patterns (Stillwagon & Larson Reference Stillwagon and Larson1988; Buck et al. Reference Buck, Petersen, Hund, Krausch and Johannsmann2004; Rognin et al. Reference Rognin, Landis and Davoust2011; Teisseire et al. Reference Teisseire, Revaux, Foresti and Barthel2011), to steps (McGraw, Jago & Dalnoki-Veress Reference McGraw, Jago and Dalnoki-Veress2011), trenches (Bäumchen et al. Reference Bäumchen, Benzaquen, Salez, McGraw, Backholm, Fowler, Raphaël and Dalnoki-Veress2013), holes (Backholm et al. Reference Backholm, Benzaquen, Salez, Raphaël and Dalnoki-Veress2014; Bertin et al. Reference Bertin, Niven, Stone, Salez, Raphaël and Dalnoki-Veress2020) and inhomogeneous mixtures (McGraw et al. Reference McGraw, Salez, Bäumchen, Raphaël and Dalnoki-Veress2013).
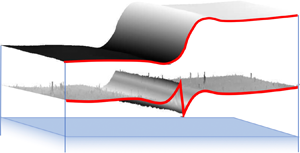
In the present work, we focus on the influence of a deformable liquid–liquid interface between two immiscible polymers by studying the capillary-driven levelling of a stepped bilayer film. The latter is depicted schematically in figure 1(a). A stepped polymer film is placed on a flat film of another, immiscible polymer supported on a rigid substrate. The initial surface perturbation can be described as a Heaviside function, where the vertical height profile varies abruptly from one thickness to another as the horizontal  $x$-direction is varied. The system is invariant in the other horizontal direction. During the subsequent evolution, the height profile
 $h(x,t)$ can be described as a function of both the horizontal position
 $x$ and time
 $t$. Furthermore, the dynamics is expected to depend on the relative viscosities of the bilayer. Indeed, one can expect that, if the viscosity of the bottom flat film is much higher than that of the top stepped film, then the former is much like a rigid substrate: the top film can flow like a liquid film on a solid substrate. In contrast, if the bottom film has a relatively negligible viscosity, then the top film can flow with little hindrance at the bottom, akin to a freestanding liquid film. For these reasons, it is of value to consider the two extreme cases of a single film on a solid substrate and a freestanding film.
(a) Schematic of the as-prepared sample, with the indicated materials. The upper portion of the stepped film, the lower portion of the stepped film and the bottom film all have the same thickness  $h_{0}$. (b) Atomic force microscopy profiles of the liquid–air interface and the liquid–liquid interface. The two scans are shifted in the vertical direction to reconstruct the actual profile of the sample.

In the case of a thin liquid film on a solid substrate (McGraw et al. Reference McGraw, Jago and Dalnoki-Veress2011, Reference McGraw, Salez, Bäumchen, Raphaël and Dalnoki-Veress2012; Salez et al. Reference Salez, McGraw, Bäumchen, Dalnoki-Veress and Raphaël2012a), there is typically a no-slip boundary condition at the solid–liquid interface and a no-shear-stress boundary condition at the liquid–air interface. Using the lubrication approximation for Stokes flow, the interface profile follows the thin-film equation (Oron et al. Reference Oron, Davis and Bankoff1997) with a parabolic Poiseuille velocity profile. In earlier works on stepped films, it was found that the thin-film equation admits a self-similar solution in the rescaled variable  $x/t^{1/4}$ (McGraw et al. Reference McGraw, Salez, Bäumchen, Raphaël and Dalnoki-Veress2012; Salez et al. Reference Salez, McGraw, Bäumchen, Dalnoki-Veress and Raphaël2012a).
In contrast, for a freestanding film, there are no-shear-stress boundary conditions at each of the two interfaces. As a consequence, the excess surface energy of a symmetric topographical perturbation must be dissipated through elongational flow, instead of shear flow, as was found in soap films (Acheson Reference Acheson1990). Within a long-wave approximation, the flow profile is consistent with plug flow. The interface profile  $h(x,t)$ follows a system of coupled partial differential equations (Erneux & Davis Reference Erneux and Davis1993) which admits a self-similar solution in the rescaled variable
 $x/t^{1/2}$ (Ilton et al. Reference Ilton, Couchman, Gerbelot, Benzaquen, Fowler, Stone, Raphaël, Dalnoki-Veress and Salez2016). We note that freestanding films are described by the same equations as that for supported films on slippery substrates with an infinite slip length, since the absence of friction at the solid–liquid interface implies the absence of any shear stress at that interface (Münch et al. Reference Münch, Wagner and Witelski2005).
For a thin liquid film placed onto another, immiscible thin liquid film, the flow profile depends on the viscosity ratio between the two films, as well as on the ratio between the two relevant interfacial tensions. While the levelling of a liquid film atop a more viscous liquid is expected to be similar to that of a liquid film atop a solid substrate, the opposite case of liquid film atop a lower-viscosity liquid is non-trivial and is the primary focus of the present article. Here, we use experiments and low-Reynolds-number hydrodynamics in order to investigate the flow in such a geometry. Based on previous works on supported and freestanding films, we expect the widths of the interfacial perturbations to follow some combinations of the limiting  $\sim t^{1/4}$ and
 $\sim t^{1/2}$ relaxation laws. We demonstrate that the main viscous dissipative mechanism cross-overs in time from being Poiseuille like, to elongational and then to Couette like, and that this double cross-over is tuneable with the viscosity ratio.
2. Methods
2.1. Experiments
The sample preparation and experimental protocol follow modified versions of the ones described in previous works (McGraw et al. Reference McGraw, Jago and Dalnoki-Veress2011; Peschka et al. Reference Peschka, Bommer, Jachalski, Seemann and Wagner2018). Figure 1(a) shows a schematic of the sample, with a stepped film of poly(methyl methacrylate) (PMMA) atop a polystyrene (PS) film supported on a silicon (Si) substrate. PS and PMMA are an immiscible pair (Tanaka, Takahara & Kajiyama Reference Tanaka, Takahara and Kajiyama1996). The thin polymer films are prepared by spin coating PS or PMMA from solutions in toluene (Fisher Chemical, Optima), onto  $1\ \textrm {cm} \times 1\ \textrm {cm}$ Si wafers (University Wafer) and freshly cleaved mica sheets (Ted Pella, Inc.), respectively. The PMMA molecular weight is
 $M_{{w}} =56\ \textrm {kg}\ \textrm {mol}^{-1}$ (Polymer Source, Inc., polydispersity index
 $\leq$1.08). The PS molecular weights are
 $M_{{w}} =53.3$, 183 and 758.9 kg mol
 $^{-1}$ (Polymer Source, Inc. and Scientific Polymer Products, Inc., polydispersity index
 $\leq$1.06). After spin coating, all films are annealed at 150
 $^{\circ }$C, i.e. above the glass transition temperatures of both polymers, for 10 minutes to remove any residual solvent and to relax the polymer chains. The films of PMMA are then floated from the mica surface onto a bath of ultra-pure water (18.2 M
 ${\rm \Omega}$ cm). A floating film of PMMA is transferred off the water surface onto the PS-coated Si substrate to create a flat bilayer film supported on Si. The molecular weight of the PMMA is low enough such that the polymer chains are not highly entangled: a thin film of this polymer easily fractures upon perturbation on the surface of water, which results in portions with straight edges (Bäumchen et al. Reference Bäumchen, Benzaquen, Salez, McGraw, Backholm, Fowler, Raphaël and Dalnoki-Veress2013). A second film of PMMA is fractured and transferred onto the flat bilayer, the sharp, fractured edge thus creating the step (see figure 1a). For each sample studied here, the upper portion of the PMMA stepped film, the lower portion of the PMMA stepped film, and the bottom PS film all have the same thickness,
 $h_{0}$, within 10 % of each other, as confirmed with ellipsometry (Accurion, EP3). The thicknesses used in this work are
 $h_{0}=100$, 180 and 240 nm.
To examine the evolution of the step with time, the samples are annealed above the glass transition temperature of both polymers ( ${\sim }100\,^{\circ }$C), with a temperature controlled stage (Linkam). The samples are held at the elevated temperature for a given period of time, during which flow and levelling occur, before being quenched back into the glassy state at room temperature. Surface profiles of the liquid–air interface are obtained with atomic force microscopy (AFM, Bruker). For some experiments, the liquid–liquid interface is exposed by dissolving of the top PMMA layer with a selective solvent (
 $\sim$67 % acetic acid and
 $\sim$33 % ultra-pure water). This procedure allows for AFM profiles of the liquid–liquid interface to be measured. Figure 1(b) shows typical AFM profiles of the liquid–air and liquid–liquid interfaces taken at the same location on the sample. The actual profile of the whole sample is reconstructed by vertically shifting the AFM profiles according to the original layer thickness.
The dynamics of capillary-driven levelling depends on two dimensionless numbers: the viscosity ratio  $\mu = \eta _1/\eta _2$ between the bottom (PS, 1) and top (PMMA, 2) layers, and the interfacial tension ratio
 $\varGamma = \gamma _1/\gamma _2$ between the liquid–liquid and liquid–air interfaces. The viscosity ratio is varied by changing the molecular weight of the bottom layer, as well as by changing the annealing temperature; this results in the viscosity ratio varying over 6 orders of magnitude, from
 $\mu \approx 5.3 \times 10^{-5}$ to
 $\mu \approx 1.4 \times 10^{1}$. The range of viscosity ratios
 $\mu$ was fixed by the accessible experimental time scales, such that levelling was slow enough to be monitored with AFM but fast enough to have reasonable experimental times. The individual viscosities were measured independently through the capillary levelling of simple stepped films of each single polymer, using the method described previously (McGraw et al. Reference McGraw, Jago and Dalnoki-Veress2011)(see table 1). Variations of the interfacial tension ratio over the experimental temperature range are negligible, so that the ratio is taken to be
 $\varGamma = 0.053$ (Wu Reference Wu1970); thus the liquid–air surface tension largely dominates that of the liquid–liquid interface.
The viscosity ratios  $\mu$, between the bottom (PS) and top (PMMA) layers, for various PS molecular weights
 $M_{{w}}$(PS), and annealing temperatures
 $T$. The viscosity ratios are obtained from: (i) a best fit of the theory to the experimental excess capillary energy (‘best fit’); and (ii) the capillary levelling of simple stepped films of each single polymer (‘independent’).

2.2. Theory
The system is modelled as two thin liquid layers atop each other, the ensemble being placed on a rigid substrate, as sketched in figure 1(a), and Cartesian coordinates ( $x$,
 $y$,
 $z$) are used, as shown in figure 1(b). The system is assumed to be infinite in both the
 $x$-direction and
 $y$-direction, and invariant by translation in the latter. The typical length scales of the experiment are well below the capillary length, thus gravitational effects can be neglected. In thin, highly viscous polymer films, with Reynolds and Mach numbers are much smaller than 1, relaxation is driven by capillarity, and inertial and compressibility effects can be neglected. Furthermore, the polymer melts may be treated as Newtonian liquids (McGraw et al. Reference McGraw, Salez, Bäumchen, Raphaël and Dalnoki-Veress2012), since the typical viscoelastic times, under the present experimental conditions, are of the order of a few seconds (Hirai et al. Reference Hirai, Yoshikawa, Takagi, Yoshida and Yamamoto2003) whereas the levelling time scales are much larger (minutes to hours). Finally, the film thicknesses are chosen to be large enough such that disjoining forces are weak in comparison with the Laplace pressure (Seemann, Herminghaus & Jacobs Reference Seemann, Herminghaus and Jacobs2001; Sharma & Verma Reference Sharma and Verma2004).
The velocity fields and excess pressure fields with respect to the atmospheric pressure are denoted as  $\boldsymbol {u_i} = (u_i, 0, w_i)$ and
 $p_i$, respectively. In the small-slope limit, the tangential stress balance at the liquid–liquid interface reads
 $\eta _1 ({\partial u_1}/{\partial z}) = \eta _2 ({\partial u_2}/{\partial z})$ (Jachalski et al. Reference Jachalski, Peschka, Münch and Wagner2014). In the regime where
 $\mu \ll 1$, this relation further leads to
 ${\partial u_2}/{\partial z} = 0$ to leading order. Together with a no-shear-stress boundary condition at the liquid–air interface, these are consistent with plug flow in the top layer: much like in the freestanding case discussed above. Within the lubrication approximation, the bottom layer is expected to display a horizontal Poiseuille-like flow. Furthermore, we assume continuity of the velocity field across the liquid–liquid interface, i.e. we impose a no-slip boundary condition. As a result, we expect an additional linear term in
 $z$ (like Couette flow for a simple shear geometry) in the horizontal velocity field of the bottom layer.
Within this framework, and invoking the lubrication-like scale separation, the heights  $h_i(x,t)$ of both interfaces (see figure 1b) follow a set of nonlinear partial differential equations (see appendix A for more details). We refer to this first model as the asymptotic model. We note that a similar derivation was made for the non-Newtonian case for the upper liquid using the Jeffreys model (Jachalski, Münch & Wagner Reference Jachalski, Münch and Wagner2015). The governing equations are
 \begin{gather} \partial_t (h_2 - h_1) = -[ (h_2 - h_1)u_2]', \end{gather}
 \begin{gather}\partial_t h_1 = -\left[(\gamma_2 h_2'''+\gamma_1 h_1''') \frac{h_1^{3}}{12\eta_1} +\frac{h_1 u_2}{2} \right]' = -\left[-p_1'\frac{h_1^{3}}{12\eta_1} +\frac{h_1 u_2}{2} \right]', \end{gather}
 \begin{gather}\gamma_2 h_2''' (h_2 - h_1) + (\gamma_2 h_2''' + \gamma_1 h_1''') \frac{h_1}{2} + 4 \eta_2 [u_2' (h_2-h_1)]' - \eta_1 \frac{u_2}{h_1} = 0, \end{gather}
where the prime indicates a derivative with respect to  $x$. The excess pressure field
 $p_1 = -\gamma _1 h_1''(x) - \gamma _2 h_2''(x)$ in the bottom film corresponds to the sum of the two interfacial Laplace pressure jumps in the small-slope limit. Notably, (2.1c) has the same form as the tangential stress balance for a single liquid film on a solid substrate with a large slip length (Münch et al. Reference Münch, Wagner and Witelski2005). The associated apparent slip length in our configuration is
 $b \sim h_1 / \mu$ (Jachalski et al. Reference Jachalski, Münch and Wagner2015), which is large if
 $\mu \ll 1$, i.e. if the bottom layer is much less viscous than the top one. We note that a similar analogy with flow over a slippery substrate has been proposed to describe the flow of nanobubbles on hydrophobic surfaces (Lauga & Brenner Reference Lauga and Brenner2004).
The heights of the two interfaces can be further expressed as perturbations from the equilibrium configuration:  $h_1(x,t) = \bar {h}_1 + \delta h_1(x,t)$ and
 $h_2(x,t) = \bar {h}_2 + \delta h_2 (x,t)$, where
 $\bar {h}_i$ denote the mean heights of the two interfaces:
 $\bar {h}_1= h_0$ and
 $\bar {h}_2= 5h_0/2$ in our specific geometry. We then assume that
 $\delta h_i \ll \bar {h}_i$, and keep only the leading-order linear terms. We stress that this condition is not strictly valid at the liquid–air interface, but: (i) the linearization allows us to obtain an analytical solution; and (ii) in both limiting cases of freestanding and supported films, the linearization does preserve the self-similar structure of the nonlinear problem (Salez et al. Reference Salez, McGraw, Bäumchen, Dalnoki-Veress and Raphaël2012a,Reference Salez, McGraw, Cormier, Bäumchen, Dalnoki-Veress and Raphaëlb; Ilton et al. Reference Ilton, Couchman, Gerbelot, Benzaquen, Fowler, Stone, Raphaël, Dalnoki-Veress and Salez2016). Therefore, our approach is still expected to provide some relevant features for the experimental system.
Using the Fourier transform  $\tilde {f}(k)$ of a function
 $f(x)$, defined as
 $\tilde {f}(k) = ({1}/{\sqrt {2 {\rm \pi}}}) \int \textrm {d}x f(x) \exp (\textrm {i} k x)$, we find from the linearization of the governing equations above, that
 \begin{equation} \frac{\partial \widetilde{\delta h_i}}{\partial t} = s_{{i},{j}}(k) \widetilde{\delta h_j}, \end{equation}
with  $s_{{i},{j}}$ representing the elements of the decay-rate matrix
 $\boldsymbol {s}$ associated with the mode
 $k$ (see appendix A). The Einstein summation convention is used in (2.2). The general solution to this set of equations is
 \begin{gather} \widetilde{\delta h_1} = \alpha \exp{(\lambda_1 t)} + \beta \exp{(\lambda_2 t)}, \end{gather}
 \begin{gather}\widetilde{\delta h_2} = \alpha K_1 \exp{(\lambda_1 t)} + \beta K_2 \exp{(\lambda_2 t)}, \end{gather}
where  $(\lambda _1, \lambda _2)$ and
 $(1,K_1), (1,K_2)$ are the eigenvalues and eigenvectors of
 $\boldsymbol {s}$, respectively. The two coefficients
 $\alpha$ and
 $\beta$ can be found using the initial conditions:
 $\delta h_1(x,t=0) = 0$, and
 $\delta h_2(x,t = 0) = h_0 [\varTheta (x) - 1/2]$, where
 $\varTheta$ denotes the Heaviside function (i.e.
 $\varTheta (x>0) = 1$,
 $\varTheta (x<0) = 0$).
We stress that the main assumption in the asymptotic model is the small-slope approximation. However, the initial profile is sharp in the experiments, with large slopes. Therefore, the early-time dynamics cannot be fully captured. To evaluate and extend the validity of the asymptotic model described so far, a second model was developed that does not assume any specific leading-order flow profiles in the two layers, and that takes into account all the terms of the Stokes equations. Thus, this model includes the contribution of vertical flow in the leading-order momentum balance, in contrast with the asymptotic model. We refer to this second model as the full-Stokes model (see details in appendix B). The stress boundary conditions are linearized in the profiles’ perturbations, in order to get an analytical solution that can be compared with the asymptotic model. As a result, the full-Stokes model exhibits governing equations similar to (2.2), with the exception of the matrix elements  $s^{Stokes}_{{i},{j}}$, which are more complicated functions of
 $k$ than
 $s_{{i}, {j}}$. Excellent self-consistent agreement between the solutions of the two models is found in the small-slope limit at small wavenumber (see appendix B).
3. Results and discussion
3.1. Interface profiles
In figure 2(a), we show the experimental profiles of the liquid–air and liquid–liquid interfaces at different stages of evolution for the case of PMMA with  $M_{{w}} = 56$ kg mol
 $^{-1}$, PS with
 $M_{{w}} = 53$ kg mol
 $^{-1}$ and an annealing temperature of 150
 $^{\circ }$C. We note that each pair of interface profiles at a given annealing time corresponds to a different sample, as the top layer must be removed in order to image the buried liquid–liquid interface. Thus, a series of equivalent samples was prepared in order to reconstruct the entire evolution. Each sample was annealed for a given time, its liquid–air interface was imaged, the PMMA layer removed, and finally the profile of the bottom layer at the same location was imaged. The liquid–air interface develops a ‘bump’ on the upper side of the step with positive curvature (i.e. negative second derivative of the profile), and a ‘dip’ on the lower side with negative curvature. With increasing annealing time, the bump and dip spread apart horizontally as the step levels. Furthermore, at late times, the bump and dip decrease in height. As discussed previously (Salez et al. Reference Salez, McGraw, Bäumchen, Dalnoki-Veress and Raphaël2012a), the bump and dip develop to alleviate the large gradients in Laplace pressure due to the highly curved corners of the original stepped geometry. At early annealing times (
 $t < 8$ min), there is a sharp feature near the centre of the step that seems to be a remnant of the initial corner of the step.
(a) Experimental profiles  $h(x,t)=h_i(x,t)$ of the liquid–liquid (
 $i=1$, bottom) and liquid–air (
 $i=2$, top) interfaces of a PMMA (
 $M_{{w}}= 56$ kg mol
 $^{-1}$) stepped layer on a PS (
 $M_{{w}} = 53.3$ kg mol
 $^{-1}$) layer (see figure 1), during levelling at
 $T= 150^{\circ }$C. The viscosity ratio for these samples is
 $\mu = 1.1 \times 10^{-4}$ (see table 1). The samples were fabricated with
 $h_0 = 180$ nm. (b) Theoretical profiles calculated using the asymptotic model. The times, rheological properties and geometry have been chosen to match the experimental conditions of the data shown in (a).

The liquid–liquid interface deforms significantly in response to the Laplace pressure due to the stepped liquid–air interface. Remarkably, the deformation of the liquid–liquid interface initially grows vertically, before levelling out, which implies that while the surface energy associated with the liquid–air interface decreases, it partially does so at the cost of an increasing surface energy of the liquid–liquid interface. On either side of the step one can observe features in the liquid–liquid interface which mimic that of the bump and dip of the liquid–air interface. The deformation of the liquid–liquid interface can be qualitatively understood by considering the interfacial tension ratio  $\varGamma =\gamma _1/\gamma _2$, as well as the viscosity ratio
 $\mu =\eta _1/\eta _2$ (see § 3.2 for a detailed study of the latter) introduced above. Since
 $\varGamma \ll 1$, the liquid–liquid interface is much more compliant than the liquid–air interface, and hence the liquid–liquid interface adapts and follows the liquid–air interface. Moreover, the total interfacial energy of the system is dominated by the liquid–air contribution, as demonstrated quantitatively below (see § 3.3).
Figure 2(b) shows the theoretical profiles generated from the asymptotic model, with all the physical parameters matching the experimental conditions of the data in figure 2(a). The model captures the essential features observed in the experiments, with the exception of a few early-time features (e.g. initial vertical growth of the liquid–liquid interface and sharp feature near the step corner). In fact, at early times, the small-slope approximation is violated since  ${\partial h_2}/{\partial x}|_{x=0}$ is of order one. We thus suspect vertical flows, which were neglected in the leading-order momentum balance of the asymptotic model, to be responsible for such features. The full-Stokes model, which accounts for vertical flow, does capture these early-time details (see appendix B), which supports our suggestion.
3.2. Effect of the viscosity ratio
Figure 3(a) shows the experimental liquid–air (i.e. PMMA–air) interface profiles, at an annealing temperature of 165  $^{\circ }$C, for various annealing times and PS molecular weights. For the experimental profiles in figures 2(a) and 3,
 $\mu$ is always much smaller than 1 – except in the case of
 $M_{{w}}({PS})=758.9$ kg mol
 $^{-1}$ at 165
 $^{\circ }$C, for which
 $\mu$ is of order unity (see table 1). As explained in § 3.1, the evolution of the system is mostly driven by the gradients in Laplace pressure along the liquid–air interface. The resulting pressure field in the top PMMA layer is transferred to the underlying PS layer, thereby inducing flow in the latter and thus deformation of the liquid–liquid interface. Finally, it is immediately clear from figure 3(a) that for samples having identical annealing temperatures, annealing times and geometry, the lower the viscosity of the underlying PS layer, the faster the levelling of the liquid–air interface. This highlights the importance of the bottom layer in the relaxation of the top layer, and is in line with the discussion in § 2.2 about the apparent slip length
 $b \sim h_1 / \mu$ in our configuration (Jachalski et al. Reference Jachalski, Münch and Wagner2015).
(a) Experimental liquid–air (i.e. PMMA–air) interface profiles, at an annealing temperature of 165  $^{\circ }$C, for various annealing times and PS molecular weights, as indicated. (b) Same experimental data as in (a), but with a rescaled horizontal axis. For both panels, the 53.3 and 758.9 kg mol
 $^{-1}$ data have been shifted horizontally and vertically for clarity.

As discussed in the introduction, the capillary levelling of thin liquid films can exhibit self-similar regimes. For films supported on no-slip substrates and with the associated Poiseuille flow, the self-similar variable is  $x/t^{1/4}$, while for freestanding films and plug flow,
 $x/t^{1/2}$ provides the appropriate rescaling. Figure 3(b) shows the same data as in figure 3(a) with the horizontal axis rescaled as expected for a Poiseuille flow. For the largest viscosity ratio, obtained with
 $M_{{w}}({PS}) = 758.9$ kg mol
 $^{-1}$, the rescaled profiles collapse well with one another. This is consistent with the physical intuition that a high enough viscosity in the bottom layer renders the situation analogous to capillary levelling on a solid substrate. However, for the two smaller viscosity ratios, there is no such collapse, which suggests that there is no
 ${\sim }t^{1/4}$ self-similar behaviour within the experimental temporal range. Similarly, rescaling the
 $x$-axis by
 $t^{1/2}$ (not shown) does not allow us to collapse the experimental profiles either. Therefore, in order to investigate the temporal evolution in more detail, we consider in § 3.3 the evolution of the surface energy of the system – i.e. a global observable linked to capillary levelling (McGraw et al. Reference McGraw, Salez, Bäumchen, Raphaël and Dalnoki-Veress2012).
3.3. Energetic considerations
The excess capillary energy  $\mathcal {E}_i$ of interface
 $i$ is proportional to the interfacial tension
 $\gamma _i$, as well as to the difference between the interfacial area
 $S_i$ and the interfacial area
 $S_i^{0}$ of the flat equilibrium state:
 $\mathcal {E}_i = \gamma _i (S_i - S_i^{0})$. Given the invariance of the system with respect to the
 $y$-direction, and relating the interfacial lengths to the local profiles
 $h_i(x)$, we consider the excess capillary energies per unit length defined as:
 $E_i = \gamma _i \int \textrm {d}x\ (\sqrt {1 + h_i'(x)^{2}} - 1)$. In order to account for the different initial liquid–liquid interfacial lengths, resulting from the different
 $h_0$ values and thus step heights, the excess capillary energies per unit length can be normalized by the corresponding initial values
 $\gamma _2 h_0$ for the liquid–air interface. In figure 4 the normalized excess capillary energy per unit length is plotted versus dimensionless time for both the liquid–liquid (
 $i=1$) and liquid–air (
 $i=2$) interfaces, from the data shown in figure 2(a), as well as from data obtained with two other thicknesses
 $h_0$. At dimensionless times
 $t\gamma _2/(h_0\eta )$ larger than
 $\sim 10$, one observes that the excess capillary energies of both interfaces seem to decrease as
 $t^{-1/2}$ power laws. In addition, as expected and discussed in § 3.1, the contribution of the liquid–liquid interface is
 $\sim 7$ times smaller than that of the liquid–air interface. This dominance of the liquid–air excess interfacial energy to the total interfacial energy confirms the intuitive remark made previously that the liquid–liquid interface deforms with a relatively little cost since
 $\varGamma \ll 1$. In the following, we thus focus on the liquid–air interface alone. Conveniently, one can then prepare a single sample and follow the evolution of the liquid–air interface through repeated annealing, rather than having to sacrifice the sample by dissolving the top PMMA layer. The excess capillary energies per unit length can be computed from the asymptotic model, i.e. in the small-slope limit, with the approximation
 $E_i \simeq \gamma _i \int \textrm {d}x\ h_i'(x)^{2}/2$. We note that, under this approximation, if the profile of a given interface is self-similar, such that
 $h_i(x,t) = f_i(x/t^{\alpha })$ with
 $f_i$ a function of a single variable, then
 $E_i\sim t^{-\alpha }$. Therefore,
 $E_i\sim t^{-1/4}$ or
 $E_i\sim t^{-1/2}$ indicate the dominance of Poiseuille or plug flows, respectively, as discussed in § 3.2.
Normalized excess capillary energy per unit length of the liquid–liquid ( $i=1$, unfilled) and liquid–air (
 $i\!=\!2$, filled) interfaces, for PMMA (
 $M_{w} \!=\! 56$ kg mol
 $^{-1}$) stepped films on PS (
 $M_{w} \!=\! 53.3$ kg mol
 $^{-1}$) films, with three different values of the nominal thickness
 $h_0$ (see figure 1) as indicated, and an annealing temperature of 150
 $^{\circ }$C. The excess capillary energies per unit length have been normalized by the corresponding initial values for the liquid–air interface. Long-term
 ${\sim }t^{-1/2}$ behaviours are indicated with dashed lines.

Figure 5(a–c) shows the normalized excess capillary energy per unit length  $E_2$ of the liquid–air interface as a function of time
 $t$, for different annealing temperatures and PS molecular weights. For each panel, three identical samples were prepared and annealed at different temperatures. The experimental data are overlaid with best fits to the excess capillary energy per unit length
 $E_2$ of the liquid–air interface obtained from the asymptotic model, using the PS viscosity as the single free parameter. We note an excellent agreement between experiments and theory, except at the earliest times for the sample made with a 53.3 kg mol
 $^{-1}$ PS molecular weight and annealed at 150
 $^{\circ }$C. In that case, the experimental values are substantially higher than predicted by the model, which is likely due to the sharp feature observed at early times (see figure 2a), as noted in § 3.1. Indeed, this feature cannot be captured by the asymptotic model (see figure 2b) which neglects any vertical flow in the leading-order momentum balance (see appendix B), and it would elevate the capillary energy compared to a profile without that feature. Finally, the viscosity ratios obtained from the fits are in good agreement with independent measurements (see table 1) – both approaches being within an order of magnitude of each other. We note that the viscosities are highly dependent on temperature and that small temperature differences between samples can have large effects on the measured viscosity ratio. Furthermore, as the driving force for flow is surface energy, there is a possibility of trace contaminants reducing the surface energy from what is assumed, thus modifying the capillary velocity of the system (Hourlier-Fargette et al. Reference Hourlier-Fargette, Antkowiak, Chateauminois and Neukirch2017; Peaudecerf et al. Reference Peaudecerf, Landel, Goldstein and Luzzatto-Fegiz2017). However, this contribution to any error in the capillary velocity is small in comparison to that related to the temperature variation on the viscosity.
(a–c) Normalized excess capillary energy per unit length  $E_2/(\gamma _2h_0)$ of the liquid–air interface as a function of time
 $t$, for PMMA (
 $M_{{w}} = 56$ kg mol
 $^{-1}$) stepped layers on PS layers, annealed at 150
 $^{\circ }$C (
 $\circ$), 165
 $^{\circ }$C (
 $\star$) and 180
 $^{\circ }$C (
 $\triangle$). The PS molecular weights are: (a)
 $M_{w}= 53.3$ kg mol
 $^{-1}$, (b)
 $M_{w}= 183$ kg mol
 $^{-1}$ and (c)
 $M_{w} = 758.9$ kg mol
 $^{-1}$. The solid lines of corresponding colours indicate the normalized excess capillary energy per unit length
 $E_2/(\gamma _2h_0)$ of the top interface calculated from the asymptotic model, with the PS viscosity as a single fitting parameter. The bands span a variation in viscosity ratio from half of the best fit to double of the best fit. The excess capillary energies per unit length have been normalized by the corresponding initial values for the liquid–air interface. The
 $t^{-1/2}$ and
 $t^{-1/4}$ trends are indicated with dashed lines. (d–f) Normalized viscous dissipation power per unit length
 $P\eta _2/\gamma _2$ as a function of time
 $t$, calculated from the asymptotic model, for the three viscous mechanisms of (3.1): plug (
 $P=P_{{plug}}$), Poiseuille (
 $P=P_{{Poiseuille}}$) and Couette (
 $P=P_{\textrm {Couette}}$). For each panel, the viscosity ratio
 $\mu$ corresponds to the 165
 $^{\circ }$C (
 $\star$) experimental data in the panel above. The
 $t^{-5/4}$ trend is indicated with dashed lines. (g–i) The fractional composition of the total viscous dissipation displayed in the panel above.

While the experimental data in figures 4 and 5(a) seem consistent with a  $E_2\sim t^{-1/2}$ trend, the asymptotic model does not predict a well-defined regime with such a scaling law. Instead, the model seems to exhibit a double cross-over, with a transient exponent that changes smoothly from a value near
 $-1/4$, to a value near
 $-1/2$, before increasing again towards
 $-1/4$, as seen in figure 5(a–c). The latter seems to correspond to a proper long-term self-similar regime, valid for all viscosity ratios. Thus, the energy eventually becomes independent of the viscosity
 $\eta _2$ of the top film, which indicates that most of the dissipation occurs in the bottom film at late times. This long-term self-similar regime is reached experimentally in some cases (see figure 5b,c), but is not accessible for the smallest viscosity ratios due to the large experimental time scales involved. The apparent
 $E_2\sim t^{-1/2}$ regime observed in figures 4 and 5(a) is thus a transient, intermediate behaviour.
The asymptotic model can be used to gain further insight into the effect of the viscosity ratio, by expressing the conservation of energy. As the films are thin, body forces may be neglected. The capillary energy decreases primarily through viscous dissipation. The rate of change of the total capillary energy per unit length can be written as the sum of the three contributions to the viscous dissipation power induced by the characteristic flows highlighted in § 2.2
 \begin{equation} \partial_t E = - \underbrace{\int {\rm dx} 4\eta_2 (h_2 - h_1) u_2'^{2}}_{P_{\textrm{plug}}} - \underbrace{\int {\textrm{dx}} \frac{ p_1'^{2} h_1^{3}}{12\eta_1}}_{P_{\textrm{Poiseuille}}} - \underbrace{\int {\textrm{dx}} \eta_1 \frac{u_2^{2}}{h_1}}_{P_{\textrm{Couette}}}. \end{equation}
An explicit derivation of (3.1) is provided in appendix C. The first term ( $P_{\textrm {plug}}$) is related to a velocity profile that is invariant vertically through the top layer's thickness, corresponding to plug flow. The second term (
 $P_{\textrm {Poiseuille}}$) is related to a parabolic velocity profile, i.e. Poiseuille flow, caused by the horizontal Laplace pressure gradient in the bottom layer. The third term (
 $P_{\textrm {Couette}}$) corresponds to a linear variation in the velocity profile of the bottom layer, as seen in a simple shear geometry or Couette flow.
Figure 5(d–f) displays the normalized viscous dissipation power per unit length as a function of the rescaled time, calculated from the asymptotic model, for the three viscous mechanisms of (3.1). The normalized viscous dissipation power per unit length has been calculated for the three experimentally relevant viscosity ratios, which correspond to the experimental results from figure 5(a–c), respectively. Three main regimes can be identified from the respective fractions of the total viscous dissipation power shown in figure 5(g–i). At early times, the Poiseuille contribution dominates, which is associated with a  $E\sim t^{-1/4}$ behaviour (McGraw et al. Reference McGraw, Salez, Bäumchen, Raphaël and Dalnoki-Veress2012) and thus
 $\partial _tE\sim t^{-5/4}$. At late times, the Couette contribution dominates, but since the Couette flow in the bottom layer is indirectly induced by the Laplace pressure gradient from the liquid–air interface, it also exhibits a
 $E\sim t^{-1/4}$ power law like the Poiseuille flow. Therefore, at late times, we also expect a
 $\partial _tE\sim t^{-5/4}$ behaviour. Furthermore, we recover the result stated above that the dissipation occurs mostly in the bottom film in this regime. Finally, at intermediate times, in between these two extreme regimes, the plug contribution seems to dominate. This is associated with a transient temporal exponent for the energy, passing by the
 $-1/2$ value (Ilton et al. Reference Ilton, Couchman, Gerbelot, Benzaquen, Fowler, Stone, Raphaël, Dalnoki-Veress and Salez2016). Taking into account the early, intermediate and late times discussed above, we recover the non-monotonic trend for the temporal exponent from the theoretical predictions (lines) in figure 5(a–c). The non-monotonic trend can be further characterized as a Poiseuille-to-plug-to-Couette double cross-over.
In the case where  $\mu \sim 1$, valid for PS with a molecular weight of 758.9 kg mol
 $^{-1}$, the shear stress at the liquid–liquid interface does not vanish and therefore shear terms must be taken into account in the top layer. The asymptotic model should thus be refined for bilayer films with such material properties (see the lubrication model in appendix B.3). However, according to the asymptotic model, the late-time dissipation is mainly dominated by the Couette contribution in the bottom layer (see figure 5f), and this model reproduces qualitatively the data and in particular the
 $x/t^{1/4}$ self-similarity of the profiles (see figure 3b). Nevertheless, we stress that the prefactor of the late-time scaling law
 $E_2 \sim t^{-1/4}$ from the asymptotic model is larger than the one from the lubrication model, as observed in figure 8 (see appendix B.3). As a result, the fitting procedure leads to a systematic underestimation of the viscosity of the bottom layer, as confirmed in table 1.
Finally, as stated in § 2.2, the set of equations (see (2.1a), (2.1b) and (2.1c)) that forms the asymptotic model is reminiscent of the equations that describe capillary levelling on a substrate with slip (Münch et al. Reference Münch, Wagner and Witelski2005). For a nearly constant bottom layer thickness  $h_1$, the Couette dissipation power per unit length
 $P_{\textrm {plug}}=\eta _1 \int \textrm {d}x u_2^{2}/h_1$ (see (3.1)) is indeed similar to the power per unit length
 $k \int \textrm {d}x u_2^{2}$ dissipated on a solid substrate through friction, provided that the friction coefficient
 $k$ is identified to
 $\eta _1/h_1$ and the slip velocity to
 $u_2$. As a consequence, the bottom film acts as a lubrication layer below the top stepped film, which leads to an apparent slip length given by
 $b \sim h_1 \eta _2/\eta _1$. As such, our first (i.e. Poiseuille-to-plug) cross-over mimics the one expected for a single film supported on a rigid substrate with varying slip boundary condition (Münch et al. Reference Münch, Wagner and Witelski2005; McGraw et al. Reference McGraw, Chan, Maurer, Salez, Benzaquen, Raphaël, Brinkmann and Jacobs2016).
4. Conclusion
In this article, we examined the effect of a thin liquid substrate on the capillary levelling of a thin liquid film placed atop. Specifically, we prepared stepped polymer layers that were placed onto other, immiscible and flat polymer layers supported on solid substrates. The bilayer films were observed to flow and relax towards a flat equilibrium configuration. We showed that the liquid–liquid interface deforms substantially. In the samples studied, the viscosity ratio between the two layers was varied over a large range, with the bottom layer being less viscous, or as viscous as the top layer. We have shown that the viscosity ratio has a major impact on the resulting dynamics. Unlike the capillary levelling of simple stepped films on solid substrates, or freestanding films, the interfacial profiles do not exhibit any clear, unique and stable self-similar behaviour. We have developed and validated a thin-film model in which the governing flow in the top layer is plug like, and flow in the bottom layer is a with a combination of Poiseuille and Couette flows. Using an energetic treatment, we have shown that the excess capillary energy introduced by the step, with respect to the flat equilibrium state, is dissipated by those three coupled viscous mechanisms, thus leading to a novel Poiseuille-to-plug-to-Couette double cross-over. The time scales in the process depend on the viscosity ratio between the bottom and top layers. We have found that the bottom, less viscous layer is analogous to a solid substrate with a certain finite slip length. The experimentally measured energy dissipation is in agreement with that obtained from the model. The results presented illuminate the intricate dynamics of viscous bilayer assemblies, and might find applications through friction control by lubrication, self-assembly and stability of multilayer processes.
Acknowledgements
The authors are grateful to J. Niven for valuable insight and discussions.
Funding
We gratefully acknowledge financial support by the Natural Science and Engineering Research Council (NSERC) of Canada. V.B. and C.L.L. contributed equally to this work.
Declaration of interests
The authors report no conflict of interest.
Appendix A. Asymptotic model
A.1. Model
This appendix expands upon the asymptotic model discussed in § 2.2. Dimensionless variables are denoted by capital letters
 \begin{equation} \left.\begin{aligned} u_i & = u U_i,\quad w_i = w W_i = u \epsilon W_i,\quad x = l X,\quad z = h_0 Z, \\ p_i & = p P_i,\quad t = \frac{l}{u} T,\quad h_i = h_0 H_i, \quad \epsilon = \frac{h_0}{l}, \end{aligned}\right\} \end{equation}
where  $\epsilon$ is the ratio between the typical vertical scale
 $h_0$ (see figure 1) and a horizontal length scale
 $l$,
 $P = {\gamma _2 h_0}/{l^{2}}$ is the typical pressure scale set by the Laplace pressure and
 $u = {\gamma _2 h_0}/{\eta _2 l}$ is the characteristic velocity which is chosen such that the leading-order equation for the top layer is compatible with plug flow. We note that there is no intrinsic horizontal length scale in our configuration. Therefore, the length scale
 $l$ is the typical extent of the non-zero Laplace pressure, which can be estimated as the width of the levelling profile (McGraw et al. Reference McGraw, Jago and Dalnoki-Veress2011). Thus, the asymptotic model is valid when this length scale is much larger than the typical height
 $h_0$. Experimentally, this condition is not valid at early times (
 $t<10\ {min}$ in figure 2a). We rescale the viscosity ratio as
 $M = \epsilon ^{-2} \mu$ for appropriate governing equations in the bottom layer (Jachalski et al. Reference Jachalski, Münch and Wagner2015). Non-dimensionalization yields the governing Stokes equations for both viscous layers
 \begin{gather} 0 = - \epsilon^{2} \partial_X P_2 + \epsilon^{2} \partial^{2}_X U_2 + \partial_Z^{2} U_2, \end{gather}
 \begin{gather}0 = - \partial_Z P_2 + \epsilon^{2} \partial^{2}_X W_2 + \partial_Z^{2} W_2, \end{gather}
 \begin{gather}\partial_X U_2 + \partial_Z W_2 = 0, \end{gather}
 \begin{gather}0 = - \partial_X P_1 + M (\epsilon^{2} \partial^{2}_X U_2 + \partial_Z^{2} U_1), \end{gather}
 \begin{gather}0 = - \partial_Z P_1 + M (\epsilon^{4} \partial^{2}_X W_1 + \epsilon^{2} \partial_Z^{2} W_1), \end{gather}
 \begin{gather}\partial_X U_1 + \partial_Z W_1 = 0. \end{gather}
At the free interface, the boundary conditions are the stress balance and the kinematic condition (Jachalski et al. Reference Jachalski, Peschka, Münch and Wagner2014)
 \begin{gather} P_2 + \frac{\partial^{2}_X H_2}{[1 \!+\! \epsilon^{2}(\partial_X H_2)^{2}]^{3/2}} =2 \frac{ \partial_Z W_2 [1 \,{-}\, \epsilon^{2}(\partial_X H_2)^{2}] \,{-}\, (\partial_Z U_2 \!+\! \epsilon^{2} \partial_X W_2 )\partial_X H_2}{1 + \epsilon^{2}(\partial_X H_2)^{2}},\enspace Z \!=\! H_2, \end{gather}
 \begin{gather} (\partial_Z U_2 + \epsilon^{2} \partial_X W_2)[1 - \epsilon^{2} (\partial_X H_2)^{2}] = 4 \epsilon^{2} \partial_X U_2 \partial_X H_2,\quad Z = H_2, \end{gather}
 \begin{gather}\partial_T H_2 = W_2 - U_2 \partial_X H_2,\quad Z = H_2. \end{gather}
The boundary conditions at the liquid–liquid interface are the stress balance and the kinematic condition. Furthermore, we assume that there is no slip at the interface. All together, these read
 \begin{align} & P_1 - P_2 + \varGamma \frac{\partial^{2}_X H_1}{[1 + \epsilon^{2}(\partial_X H_1)^{2}]^{3/2}} = 2 \frac{\partial_Z (M \epsilon^{2} W_1 - W_2) [1 - \epsilon^{2}(\partial_X H_1)^{2}] }{1 + \epsilon^{2}(\partial_X H_1)^{2}} \nonumber\\ &\quad -2\frac{[\partial_Z (M \epsilon^{2} U_1 - U_2) + \epsilon^{2} \partial_X (M \epsilon^{2} W_1 - W_2) ]\partial_X H_1 }{1 + \epsilon^{2}(\partial_X H_1)^{2}},\quad Z = H_1 \end{align}
 \begin{align} & \big[\partial_Z (M \epsilon^{2} U_1 - U_2) + \epsilon^{2} \partial_X (M \epsilon^{2} W_1 - W_2) \big] \big[1 - \epsilon^{2} (\partial_X H_2)^{2}\big] \nonumber\\ &\quad = 4 \epsilon^{2} \partial_X (M \epsilon^{2} U_1 - U_2)\partial_X H_1,\quad Z = H_1 \end{align}
 \begin{equation} \partial_T H_1 = W_1 - \partial_X H_1,\quad Z = H_1 \end{equation}
 \begin{equation}W_2 - W_1 = (U_2 - U_1)\partial_X H_1,\quad Z = H_1 \end{equation}
 \begin{equation}U_2 - U_1 + \epsilon^{2} (W_2 - W_1) \partial_X H_1 = 0,\quad Z = H_1. \end{equation}
At the solid–liquid interface, we assume no-slip and impermeability boundary conditions
 \begin{equation} U_1 = W_1 = 0,\quad Z = 0. \end{equation}
We consider the flow in the top layer as a perturbation
 \begin{equation} \left(U_2, W_2, P_2\right) = \big( U_2^{(0)}, W_2^{(0)}, P_2^{(0)}\big) + \epsilon^{2} \big(U_2^{(1)}, W_2^{(1)}, P_2^{(1)}\big). \end{equation}
The leading order can be described as
 \begin{gather} \partial_Z U_2^{(0)}(X,Z,T) = 0 \quad \rightarrow \quad U_2^{(0)}(X,Z,T) = U_2(X,T), \end{gather}
 \begin{gather}W_2^{(0)}(X,Z,T) = - (Z-H_1)\partial_X U_2 + W_1(Z=H_1), \end{gather}
 \begin{gather}P_2^{(0)}(X,T) = - 2 \partial_X U_2 - \partial^{2}_X H_2, \end{gather}
 \begin{gather}\partial_Z P_1(X,Z,T) = 0 \quad \rightarrow \quad P_1(X,T) = -\partial^{2}_X H_2(X,T) - \varGamma \partial^{2}_X H_1(X,T) \end{gather}
 \begin{gather}U_1(X, Z, T) = -\frac{1}{2M} \partial_X P_1 \big( Z^{2} - ZH_1 \big) + U_2(X,T) \frac{Z}{H_1}. \end{gather}
The in-plane component of the flow is described by a set of coupled nonlinear equations. Invoking further the kinematic condition results in (2.1a)
 \begin{equation} \partial_t (H_2 - H_1) = - \left[ (H_2 - H_1)U_2 \right]', \end{equation}
where the prime denotes the derivative with respect to  $X$. The volume conservation of the bottom layer gives (2.1b)
 \begin{equation} \partial_t H_1 = -\left(-P_1'\frac{H_1^{3}}{12M} +\frac{H_1 U_2}{2} \right)' = -\left[( H_2'''+\varGamma H_1''')\frac{H_1^{3}}{12M} +\frac{H_1 U_2}{2} \right]'. \end{equation}
The final equation that relates  $U_2$ to the other variables can be found by integrating the horizontal component of the Stokes equation with respect to
 $Z$ at the next leading order
 \begin{align} \partial^{2}_Z U_2^{(1)} + \partial_X^{2} U_2^{(0)} &= \partial_X P_2^{(0)} \quad \rightarrow \quad \partial_Z U_2^{(1)} (Z = H_2) - \partial_Z U_2^{(1)}(Z=H_1) \nonumber\\ &= ( \partial_X P_2^{(0)} - \partial^{2}_X U_2)(H_2 - H_1). \end{align}
We find the last governing equation, (2.1c), by inserting the two tangential stress balances, (A3b) and (A4b), at leading order into the previous equation
 \begin{equation} H_2''' (H_2 - H_1) + (H_2''' + \varGamma H_1''') H_1/2 + 4[U_2' (H_2-H_1)]' - M \frac{U_2}{H_1} = 0 . \end{equation}
A.2. Decay rates
The elements  $s_{i,j}$ of the decay-rate matrix
 $\boldsymbol {s}$ are found by taking the Fourier transforms of the linearized governing equations
 \begin{align} \left.\begin{aligned} s_{1,1}(k) & = - \gamma_1 k^{4} \left[ \frac{\bar{h}_1^{3}}{12\eta_1} + \frac{\bar{h}_1^{3}}{4(\eta_1 + 4\eta_2 k^{2}\bar{h}_1\bar{h}_2)} \right],\\ s_{1,2}(k) & = - \gamma_2 k^{4} \left[ \frac{\bar{h}_1^{3}}{12\eta_1} + \frac{\bar{h}_1^{2}\bar{h}_2\left(1 - \frac{\bar{h}_1}{2\bar{h}_2}\right)}{2(\eta_1 + 4\eta_2 k^{2}\bar{h}_1\bar{h}_2)} \right], \end{aligned}\right\} \end{align}
 \begin{align} \left.\begin{aligned} s_{2,1}(k) & = - \gamma_1 k^{4} \left[ \frac{\bar{h}_1^{3}}{12\eta_1} + \frac{\bar{h}_1^{2}\bar{h}_2\left(1 - \frac{\bar{h}_1}{2\bar{h}_2}\right)}{2(\eta_1 + 4\eta_2 k^{2}\bar{h}_1\bar{h}_2)} \right],\\ s_{2,2}(k) & = - \gamma_2 k^{4} \left[ \frac{\bar{h}_1^{3}}{12\eta_1} + \frac{\bar{h}_1 \bar{h}_2^{2} \left(1 - \frac{\bar{h}_1}{2\bar{h}_2}\right)^{2} }{(\eta_1 + 4\eta_2k^{2}\bar{h}_1\bar{h}_2)} \right]. \end{aligned}\right\} \end{align}
The eigenvalues are the decay rates, and are given by
 \begin{equation} \lambda_i = \frac{\textrm{Tr}(\boldsymbol{s}) \pm \sqrt{\textrm{Tr}(\boldsymbol{s})^{2} - 4 \, \textrm{Det}(\boldsymbol{s}) }}{2}. \end{equation}
The eigenvectors of  $\boldsymbol {s}$ take the form
 $(1, K_i)$ with
 \begin{equation} K_i = \frac{\lambda_i - s_{1,1}}{s_{1,2}}. \end{equation}
Appendix B. Full-Stokes model
B.1. Model
To remove any assumption associated with pre-supposed flow types and the temporal scalings of the capillary energies, we derive a model from the Stokes equations (Huang & Suo Reference Huang and Suo2002; Rivetti et al. Reference Rivetti, Bertin, Salez, Hui, Linne, Arutkin, Wu, Raphaël and Bäumchen2017). The stream functions  $\psi _i$ of each layer (
 $i = 1, 2$) are defined as
 \begin{gather} u_i = -\partial_z \psi_i, \end{gather}
 \begin{gather}w_i = \partial_x \psi_i. \end{gather}
The velocity fields satisfy the Stokes equations. This in turn implies that the stream functions are solutions of biharmonic equations
 \begin{equation} (\partial^{4}_x +2 \partial_x^{2}\partial_z^{2} + \partial_z^{4}) \psi_i = 0. \end{equation}
We take the Fourier transforms (defined in the main text) with respect to the variable  $x$, of the biharmonic equations, through the Fourier transforms
 $\tilde {\psi }_i$ of the stream functions, which results in fourth-order ordinary differential equations
 \begin{equation} \left(\frac{ \textrm{d}}{ \textrm{d} z}\right)^{4} \widetilde{\psi_i} - \left(\frac{ \textrm{d}}{ \textrm{d} z}\right)^{2}k^{2}\widetilde{\psi_i} + k^{4} \widetilde{\psi_i} = 0. \end{equation}
The general solutions are
 \begin{equation} \widetilde{\psi_i} (k,z) = A_{i}(k) \cosh(kz) + B_{i}(k) \sinh(kz)+C_{i}(k) z\cosh(kz)+D_{i}(k) z\sinh(kz). \end{equation}
The eight coefficients  $A_i, B_i, C_i, D_i$ can be found using the boundary conditions: vanishing velocity at the solid–liquid interface, continuity of velocity (including no slip) and stress across the liquid–liquid interface and continuity of stress (including no shear stress) at the liquid–air interface. The nonlinear terms of the curvature in the Laplace pressure are neglected, as well as the nonlinear terms of the normal and tangential vectors to the interfaces. This means that this model would be valid in the limit of small perturbation of the interface. The boundary condition are listed below
 \begin{gather} w_1 = 0 \quad \rightarrow \quad \widetilde{\psi_1} = 0, \quad z = 0, \end{gather}
 \begin{gather}u_1 = 0 \quad \rightarrow \quad \left(\frac{ \textrm{d}}{ \textrm{d} z}\right) \widetilde{\psi_1} = 0, \quad z = 0, \end{gather}
 \begin{gather}w_2 = w_1 \quad \rightarrow \quad -\textrm{i}k\widetilde{\psi_2}= -\textrm{i}k\widetilde{\psi_1}, \quad z = h_1, \end{gather}
 \begin{gather}u_2 = u_1 \quad \rightarrow \quad -\left(\frac{ \textrm{d}}{ \textrm{d} z}\right)\widetilde{\psi_1} = -\left(\frac{ \textrm{d}}{ \textrm{d} z}\right)\widetilde{\psi_2}, \quad z = h_1, \end{gather}
 \begin{align} \eta_2 (\partial_z u_2 + \partial_x w_2) &= \eta_1 (\partial_z u_1 + \partial_x w_1) \quad \rightarrow \quad \eta_1 \left[\left(\frac{ \textrm{d}}{ \textrm{d} z}\right)^{2}\psi_1 + k^{2}\psi_1 \right] \nonumber\\ &=\eta_2\left[\left(\frac{ \textrm{d}}{ \textrm{d} z}\right)^{2}\psi_2 + k^{2}\psi_2 \right],\quad z = h_1. \end{align}
 \begin{gather} \begin{array}{c} - (p_1- p_2) + 2 \partial_z (\eta_1 w_1 - \eta_2 w_2) = -\gamma_1 \partial_x^{2} h_1 \quad \rightarrow \quad \\ \eta_1 \left[3 k^{2} \left(\dfrac{ \textrm{d}}{ \textrm{d} z}\right)\widetilde{\psi_1} - \left(\dfrac{ \textrm{d}}{ \textrm{d} z}\right)^{3}\widetilde{\psi_1} \right] - \eta_2 \left[3 k^{2} \left(\dfrac{ \textrm{d}}{ \textrm{d} z}\right)\widetilde{\psi_2} - \left(\dfrac{ \textrm{d}}{ \textrm{d} z}\right)^{3}\widetilde{\psi_2} \right] = \textrm{i}k^{3} \gamma_1 \widetilde{h_1}, \quad z = h_1. \end{array} \end{gather}
 \begin{gather} \eta_2 (\partial_z u_2 + \partial_x w_2) = 0 \quad \rightarrow \quad \left(\frac{ \textrm{d}}{ \textrm{d} z}\right)^{2} \psi_2 + k^{2}\psi_2 = 0, \quad z= h_2. \end{gather}
 \begin{align} -p_2 + 2\eta_2 \partial_z w_2 &= -\gamma_2 \partial_x^{2} h_2 \quad \rightarrow \quad \eta_2 \left[3 k^{2} \left(\frac{ \textrm{d}}{ \textrm{d} z}\right) \widetilde{\psi_2} - \left(\frac{ \textrm{d}}{ \textrm{d} z}\right)^{3}\widetilde{\psi_2}\right] \nonumber\\ &= \textrm{i}k^{3} \gamma_2\widetilde{h_2},\quad z = h_2. \end{align}
The Stokes equations in the  $x$-direction read
 \begin{equation} \partial_x p_i = \eta_i (\partial^{2}_x u_i + \partial^{2}_z u_i) \quad \rightarrow \quad -\textrm{i}k\widetilde{p_i} = \eta_i \left[k^{2}\frac{ \textrm{d}}{ \textrm{d} z} \widetilde{\psi_i} - \left(\frac{ \textrm{d}}{ \textrm{d} z}\right)\widetilde{\psi_i}'''\right]. \end{equation}
The governing equations for the temporal evolutions of the thickness profiles can be found using the kinematic conditions
 \begin{equation} \partial_t h_i + u_i \partial_x h_i = w_i, \end{equation}
where  $u_i$ and
 $w_i$ are evaluated at
 $z = h_i$. We further invoke small interfacial perturbations and proceed to linearization as in the asymptotic model
 \begin{gather} \partial_t \widetilde{\delta h_1} = \widetilde{w_1}(z = \bar{h}_1) = s^{\textrm{Stokes}}_{11} \widetilde{\delta h_1} + s^{\textrm{Stokes}}_{12} \widetilde{\delta h_2}, \end{gather}
 \begin{gather}\partial_t \widetilde{\delta h_2} = \widetilde{w_2}(z = \bar{h}_1+\bar{h}_2) = s^{\textrm{Stokes}}_{21} \widetilde{\delta h_1} + s^{\textrm{Stokes}}_{22} \widetilde{\delta h_2}. \end{gather}
These equations have the same general solutions as in the asymptotic model developed in § 2.2. The elements  $s_{i,j}^{\textrm{Stokes}}$ of the decay-rate matrix are not written here but can be found using a formal calculation software. It is then straightforward to write the solutions as in (2.3) with the corresponding eigenvalues
 $\lambda _i^{\textrm{Stokes}}$ and eigenvectors
 $(1, K_i^{\textrm{Stokes}})$. Figure 6 displays the normalized decay rates as functions of the normalized wavenumber in both the full-Stokes model and the asymptotic model, with the same dimensionless parameters as in figure 2, i.e.
 $\mu = 1.1\times 10^{-4}$ and
 $\varGamma = 0.053$. The two models agree in the small-wavenumber limit,
 $kh_0 \rightarrow 0$. At an intermediate wavenumber
 $kh_0 \sim 1.544$, the determinant of the matrix
 $\boldsymbol {s}^{\textrm{Stokes}}$ changes sign and therefore one of the two eigenvalues,
 $\lambda _2^{\textrm{Stokes}}$, becomes positive at larger wavenumbers (see bottom right inset of figure 6). Thus, in the full-Stokes model, the large wavenumbers are unstable and grow with time: the interface perturbation diverges as time increases. This is not physical as capillarity is the only driving force and acts to stabilize the interface. We suspect that nonlinear terms in the stress balances at interfaces – neglected so far – will regularize this behaviour.
Dimensionless decay rates for the full-Stokes model ( $\lambda _i^{\textrm{Stokes}}$) and asymptotic model (
 $\lambda _i$) versus the dimensionless wavenumber
 $kh_0$, in the experimental configuration where
 $\bar {h}_2 = 5/2 \bar {h}_1 = 5/2 h_0$ (see schematic in the top left inset). The bottom right inset displays a zoom of the same curves near
 $k h_0 = 1.5$, and is plotted with linear scales.

B.2. Particular case: equal average layer thicknesses
We found empirically that the instability described in the previous section is not present when the mean thicknesses of the two layers are equal, which amounts to  $\bar {h}_2 = 2 \bar {h}_1$. Therefore, we can compare in a more complete manner the two models in this case. Figure 7(a) displays the normalized decay rates as functions of the normalized wavenumber in both the full-Stokes model and the asymptotic model. We no longer observe any positive decay rate in the full-Stokes model. At small wavenumber, which means in the small-slope limit, we recover the previous statement which is that both models are consistent with each other. In figure 7(b), the normalized excess capillary energies per unit length of the liquid–air interface for both models are plotted as functions of dimensionless time. In the long-time limit, when the step has levelled sufficiently such that the typical slopes of the interfaces are much smaller than unity, we find an excellent agreement between both models. However, at short times, the profile slopes are close to unity and thus vertical flows and nonlinear terms play a significant role. Therefore, at short times the full-Stokes model, which accounts for vertical flows, differs from the asymptotic model. We point out that the excess capillary energies per unit length
 $E_2$ of the liquid–air interface, from both models, are systematically computed with the small-slope expression
 $E_2 \simeq \gamma _2 \int \textrm {d}x \delta h_2'^{2}/2$ which is not necessarily valid at short times. The exact expression should be used instead to make direct comparisons with experiments at short times. The discrepancy between the two models at short times is illustrated on the interface perturbation profiles in figures 7(c) and 7(d), that would correspond to an experiment with the same material properties as in figure 2 but with equal mean thicknesses. Interestingly, we observe similar short-term characteristics in the full-Stokes model as the one observed experimentally: a small sharp feature near the step and the deformation growth of the liquid–liquid interface.
Comparison of the full-Stokes model and the asymptotic model in the specific case where  $\bar {h}_2=2\bar {h}_1$. (a) Dimensionless decay rates for the full-Stokes model (
 $\lambda _i^{\textrm{Stokes}}$, dashed lines) and asymptotic model (
 $\lambda _i$, solid lines) versus the dimensionless wavenumber
 $kh_0$. (b) Normalized excess capillary energies per unit length
 $E_2/(\gamma _2 h_0)$ of the liquid–air interface, as functions of dimensionless time, as evaluated from the small-slope expression
 $E_2 \simeq \gamma _2 \int \textrm {d}x \delta h_2'^{2}/2$, for both models and for the same parameters as in figure 5(a) at 150
 $^{\circ }$C. (c) (respectively (d)) Interface perturbation profiles
 $\delta h_i$ in the asymptotic model (respectively full-Stokes model). The colours indicate the same experimental times as in figure 2.

B.3. Case of a large viscosity ratio
We consider the  $\mu \gg 1$ case. In figure 8, the normalized total excess capillary energies per unit length as functions of dimensionless time are plotted for the two models described above. We also add for comparison the perturbative solution of a two-layer lubrication model (see Jachalski et al. (Reference Jachalski, Peschka, Münch and Wagner2014) for a complete derivation in a more general case with weak slip)
 \begin{gather} \frac{\partial h_1}{\partial t} = \left[-\gamma_2 \frac{h_1^{2}(3h_2 - h_1)}{6\eta_1} h_2''' - \gamma_1 \frac{h_1^{3}}{3\eta_1} h_1''' \right]', \end{gather}
 \begin{gather} \frac{\partial (h_2 \,{-}\, h_1)}{\partial t} \,{=}\, \left\{ -\gamma_2 \left[\frac{(h_2 - h_1)^{3}}{3\eta_2} + \frac{h_1 (h_2- h_1)(h_2 - h_1/2)}{\eta_1}\right] h_2''' \vphantom{\frac{h_1^{2} (h_2-h_1)}{2\eta_1}}-\gamma_1 \frac{h_1^{2} (h_2-h_1)}{2\eta_1}h_1''' \right\}'\!. \end{gather}
We observe that the asymptotic model is no longer in accordance with the full-Stokes model in the large-time limit, while the lubrication model is. Indeed, when the viscosity of the bottom layer is comparable to or larger than the one of the top layer, i.e.  $\mu \gtrsim 1$, the asymptotic model is no more valid as it neglects shear terms in the top layer with respect to elongational ones.
Normalized excess capillary energies per unit length  $E_2$ of the liquid–air interface as functions of dimensionless time, as evaluated from the small-slope expression
 $E_2 \simeq \gamma _2 \int \textrm {d} x \delta h_2'^{2}/2$, for the three models indicated, and for
 $\mu = 14$,
 $\gamma = 0.053$, with equal mean thicknesses
 $\bar {h}_1 = \bar {h}_2$.

Appendix C. Energy balance
In this section, we derive the energy balance in (3.1) from the asymptotic model. In the limit of small slopes, the excess capillary energies per unit length of the two interfaces are
 \begin{gather} E_2 = \frac{\gamma_2}{2} \int {\textrm{d}x} h_2'(x)^{2}, \end{gather}
 \begin{gather}E_1 = \frac{\gamma_1}{2} \int {\textrm{d}x} h_1'(x)^{2}. \end{gather}
We can derive these quantities with respect to time and get
 \begin{gather} \partial_t E_2 = \gamma_2 \int {\textrm{d}x} h_2' \partial_t h_2' = - \gamma_2 \int {\textrm{d}x} h_2'' \partial_t h_2, \end{gather}
 \begin{gather}\partial_t E_1 = \gamma_1 \int {\textrm{d}x} h_1' \partial_t h_1' = - \gamma_1 \int {\textrm{d}x} h_1'' \partial_t h_1. \end{gather}
The second equalities are obtained after integrating by parts. We can then use (2.1a) and (2.1b), which leads to
 \begin{align} \partial_t E_2 &= - \gamma_2 \int {\textrm{d}x} h_2'' \left\{ \partial_t h_1 - [(h_2 - h_1) u_2]' \right\} \nonumber\\ &= -\gamma_2 \int {\textrm{d}x} h_2'' \left\{ -\left( - p_1' \frac{h_1^{3}}{12\eta_1} +\frac{h_1 u_2}{2} \right)' - [(h_2 - h_1) u_2]'\right\}, \end{align}
 \begin{equation} \partial_t E_1 = \gamma_1 \int {\textrm{d}x} h_1'' \left( - p_1' \frac{h_1^{3}}{12\eta_1} + \frac{h_1 u_2}{2} \right)'. \end{equation}
We then integrate by parts
 \begin{gather} \partial_t E_2 = \gamma_2 \int {\textrm{d}x} h_2''' \left\{ -\left( - p_1' \frac{h_1^{3}}{12\eta_1} +\frac{h_1 u_2}{2} \right) - [(h_2 - h_1) u_2]\right\}, \end{gather}
 \begin{gather}\partial_t E_1 = - \gamma_1 \int {\textrm{d}x} h_1''' \left( - p_1' \frac{h_1^{3}}{12\eta_1} + \frac{h_1 u_2}{2} \right). \end{gather}
Introducing the total excess capillary energy per unit length  $E = E_1 + E_2$, one gets
 \begin{equation} \partial_t E = - \int {\textrm{d}x}\left[\gamma_2 h_2'''(h_2 - h_1)\right] u_2 + \int {\textrm{d}x} p_1' \left( - p_1' \frac{h_1^{3}}{12\eta_1} +\frac{h_1 u_2}{2} \right). \end{equation}
We can then use (2.1c) to replace the term in square brackets
 \begin{align} \partial_t E &= - \int {\textrm{d}x} \left\{ -\frac{p_1' h_1}{2} - 4 \eta_2 [u_2' (h_2-h_1)]' + \eta_1 \frac{u_2}{h_1} \right\} u_2 \nonumber\\ &\quad + \int {\textrm{d}x} p_1' \left( - p_1' \frac{h_1^{3}}{12\eta_1} +\frac{h_1 u_2}{2} \right). \end{align}
This can be further simplified and after another integration by parts of the term in  $[u_2' (h_2-h_1)]' u_2$, one gets
 \begin{equation} \partial_t E = - \int {\textrm{d}x} 4\eta_2 (h_2 - h_1) u_2'^{2} - \int {\textrm{d}x} \eta_1 \frac{u_2^{2}}{h_1} - \int {\textrm{d}x} \frac{p_1'^{2} h_1^{3}}{12\eta_1}. \end{equation}



