Introduction
In mechanics of materials, the Young's moduli are the slopes of initially linear stress/strain curves under elastic deformation. Based on the specific test standards, usually large specimens with their smallest dimensions of several millimeters are subjected to uniform tensile load, and their global deformation over some distances are measured to obtain their Young's moduli. However, for very small materials or devices such as thin films/coatings, interfaces, or nanocomposites,[Reference Wang and Xu1–Reference Xu, Li, Lukehart and Kuai3] the mechanics of material approach is not feasible so nanoindentation is almost the only way to measure the Young's moduli.[Reference Anasori and Barsoum4–Reference Lu, Jones, Tandon, Putthanarat and Schoeppner6] Unlike the mechanics of material approach, the indentation approach leads to very complicated three-dimensional stress fields;[Reference Oyen and Cook7–Reference Olivas, Swadener and Shen26] therefore, the Young's moduli measured from nanoindentation should be different from the moduli measured from the mechanics of the material approach.
What we want to know in this investigation is the magnitude of the difference. Unlike a material's strength, which is determined by the local defects and stress fields, stiffness such as the Young's modulus or shear modulus is a global parameter that represents both average stress and strain effects over one specific material volume. Now for nanoindentation, this material volume is very small, and its stress and strain fields are highly non-uniform compared to a large bar specimen with uniform stress and strain fields required by a test standard. Meanwhile, there are two possible approaches to measure the Young's moduli using the elastic loading and unloading curves from nanoindentation, which were not well discussed in the previous research. Therefore, the purpose of this paper is to quantify the difference of these Young's modulus measurements, i.e. different results from the mechanics of material approach and the nanoindentation approach; and different results based on the elastic loading and unloading curves from the same nanoindentation approach.
Indentation mechanics for the Young's modulus measurements
As shown in Fig. 1, indentation load P of a spherical indenter is a function of the indentation depth h and the indenter radius R based on Hertz's contact law [Reference Fischer-Cripps27]:
 $$P=C{h^{{\rm 3/2}}}=\displaystyle{4 \over 3}\sqrt R {E_{\rm r}}{h^{{\rm 3/2}}},$$
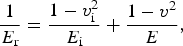
where C is the contact stiffness; and the reduced modulus E r is determined by the Young's modulus E and the Poisson's ratio v of the indenter material and the test material, if they are isotropic and homogeneous materials:
 $$\displaystyle{1 \over {{E_{\rm r}}}}=\displaystyle{{1 - v_{\rm i}^2 } \over {{E_{\rm i}}}}+\displaystyle{{1 - {v^2}} \over E},$$
where the subscript i refers to the indenter. Therefore, if we obtain the reduced modulus by fitting the initial elastic loading part of the loading–displacement curve using Eq. (1), we can get the Young's modulus of the test material E using Eq. (2) if we know the elastic constants of the indenter material. It is noticed that a spherical indenter, not other indenters in different shapes should be employed in nanoindentation experiments to use Eq. (1). In the past, only a few researchers used this fitting approach based on Hertz's contact law.[Reference McKee, Last, Russell and Murphy19]
A typical load–displacement curve for a nanoindentation process.

Oliver and Pharr employed the initial elastic unloading slope of the load–displacement curve dP/dh to obtain the same reduced modulus [Reference Oliver and Pharr21]:
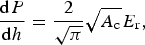 $$\displaystyle{{{\rm d}P} \over {{\rm d}h}}=\displaystyle{2 \over {\sqrt \pi }}\sqrt {{A_{\rm c}}} {E_{\rm r}},$$
where the contact area A c can be obtained using an estimation procedure. Oliver and Pharr's procedure is widely used to analyze the nanoindentation results of metals and ceramics.[Reference Jha, Suksawang, Lahiri and Agarwal18] Its application to polymers is difficult as the Young's moduli are commonly overestimated mainly because of the viscoelastic effects and pileup.[Reference Cheng and Cheng12, Reference Tranchida, Piccarolo, Loos and Alexeev23] In this paper, nanoindentation experiments using a conical indenter were conducted to measure the Young moduli using Oliver and Pharr's approach. Several questions will be answered through this study, i.e. are results obtained from two approaches (using elastic loading and unloading curves) very different or almost same? How about their difference compared to the Young's modulus measured from the mechanics of material approach? Very few papers provided these answers based on the authors' knowledge.[Reference Gerberich, Kramer, Bahr, Stronjy, Lilleodden and Nelson16, Reference McKee, Last, Russell and Murphy19] Therefore we try to provide quantitative results based on our new polymer experiments.
Experimental procedures
The polymeric materials tested were poly (methyl methacrylate), best known as PMMA and polycarbonate (PC). At least 300 nanoindentation experiments were performed for each specimen using a TI 750 Hysitron Ubi nanoindentation system with two different indenter tips: cone (tip radius >1 µm and half-angle of 45°), and sphere (radius R = 200 µm). Deformation features of these two indenter shapes were analyzed by Wu et al. [Reference Wu, Yu and Chen28]. For the spherical indenter, nanoindentation was conducted with a separation between two indents of 200 µm along the x- and y-directions. For the same specimen after the spherical indentation test without causing any plastic deformation (see the next finite-element analysis), it was employed for the conical nanoindentation with a separation of 200 µm along the x- and y-directions. Owing to the sharp tip, the conical nanoindentation introduced plastic deformation quickly. The maximum applied indentation force for both conical and spherical indentation was 10 mN. To compare the results obtained from the mechanics of material approach, six specimens for each PMMA or PC material (cut from the same large panels with these nanoindentation specimens) were employed to conduct three-point bending experiments using an Instron 8801 fatigue test machine. A classical beam theory was employed to calculate the Young's modulus in bending from the initial elastic load/displacement curve. The measured Young's moduli in bending were 2.64 GPa for PC and 3.45 GPa for PMMA, which are very close to previously reported values [Reference Martinez and Xu30].
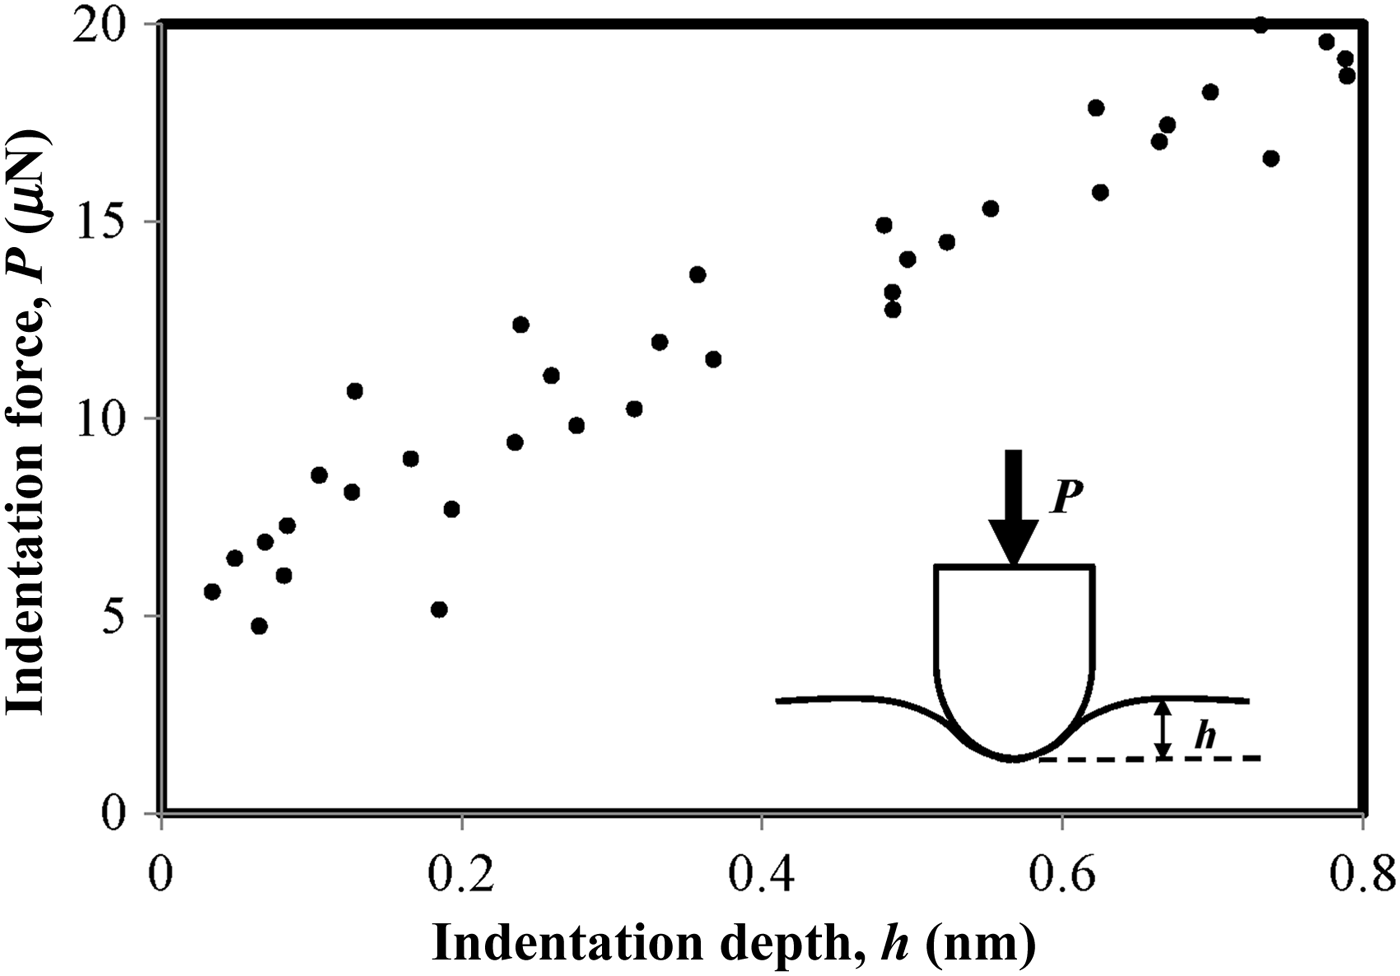
For spherical indentation, all data from each test were used to fit Eq. (1) to obtain the reduced modulus. A special fitting approach to deal with very small initial deformation from nanoindentation data was outlined by Fischer-Cripps [Reference Fischer-Cripps27], and was employed to analyze these special situations: when the initial load was zero, the initial indentation depth was not zero (should be zero according to the theory), or the initial indentation depth was zero but the indentation load was not zero as shown in Fig. 2. The data processing of two different indentation modulus measurements depends on the total data points taken from the indentation curves. To fit the Hertz's contact law, all points from the initial point of contact through the maximum loading point should be employed. For Oliver and Pharr's method, only 5 or 10% of the initial unloading curves were used, so this method needs less time to process the data. However, its major disadvantage is that the Young's modulus is calculated by estimating the contact area as shown in Eq. (3), which leads to large uncertainty in the Young's modulus characterization.
A spherical nanoindentation force/displacement curve showing zero displacement but non-zero indentation force of a PMMA sample.
Results and discussion
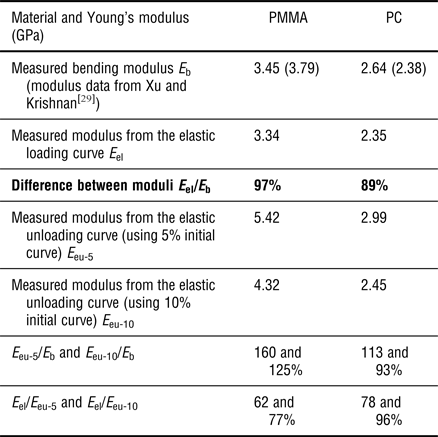
Our experiments were highly repeatable and all measured Young's moduli are listed in Table I. The SD of each measured modulus was <7% of the average value. On conical nanoindentation which caused plastic deformation, Oliver and Pharr's method was employed to analyze 5 and 10% of the initial unloading curves, which led to different Young's moduli. The comparison shows that the Young's moduli obtained from the elastic loading curve using the Hertz's contact law (spherical nanoindentation) are quite close to the moduli measured from the three-point bending experiments, i.e. 3% less for the PC and 12% less for the PMMA. The major reason for the close results is that only elastic deformation existed during spherical nanoindentation below the maximum indentation force, which was determined by our finite-element analysis. If the indentation force is very high, then plastic deformation will occur during spherical nanoindentation and change the measurement results. A useful result of this paper for those spherical nanoindentation users who are not experienced in indentation or contact mechanics is that a suggested maximum indentation force (10 mN) is presented to avoid any plastic deformation for some hard polymer materials (e.g. their Young's moduli range from 1 to 10 GPa). The same spherical nanoindentation approach was successfully extended to other engineering materials. In our recent work on the Young's modulus measurement of composite materials using spherical nanoindentation, measured modulus was very close to the modulus from a direct Young's modulus measurement for the same material system,[Reference Martinez and Xu30] because both measurement approaches ensured the same elastic deformation.
Young's moduli of two kinds of polymers using three approaches.
However, the Young's moduli measured using 5% of the initial elastic unloading curves are 60% higher (for PC) and 13% higher (for PMMA) than the moduli measured from bending experiments. If we employed 10% of the initial elastic unloading curves, the measured moduli are relatively close to the bending moduli, i.e. 25% higher for PC and 7% lower for PMMA. It is easy to understand that using 10% of the initial elastic unloading curve may lead to more accurate representation of elastic recovering from complicated plastic deformation at the indentation zone.
The overestimation of the Young's moduli for polymers using Oliver and Pharr's method had been addressed by Oyen and Cook,[Reference Oyen and Cook7] Zhang et al.[Reference Zhang, Zhang, Zeng and Shen24] Tranchida et al.[Reference Tranchida, Piccarolo, Loos and Alexeev23] among others. The common explanations include the viscoelastic effects developed during loading of polymers, and very complicated three-dimensional plastic deformation at the indentation zone. Finally, we find the significant difference (up to 38%) between the Young's moduli measured from the elastic loading and unloading curves as we expected. We believe that the Young's modulus measurement based on the elastic loading curve and Hertz's contact law is more accurate than the Oliver and Pharr's method, since no plastic deformation was introduced during measuring an elastic constant (Young's modulus).
As most of the nanoindentation users are employing Oliver and Pharr's method to measure the Young's modulus, our result indeed provides an alternative method to measure the same material constant. The fitting of these elastic spherical indentation force/depth curves is very straightforward compared to the estimation of the contact areas as shown in Eq. (3). The reduced modulus in Eq. (1) could be simply determined by:
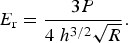 $${E_{\rm r}}=\displaystyle{{3P} \over {4\; {h^{3/2}}\sqrt R }}.$$
Therefore, even without curve fitting, we can select a few data points from the indentation curves (close to the initial load) to estimate the reduced modulus directly using Eq. (4).
Numerical simulations on the nanoindentation process
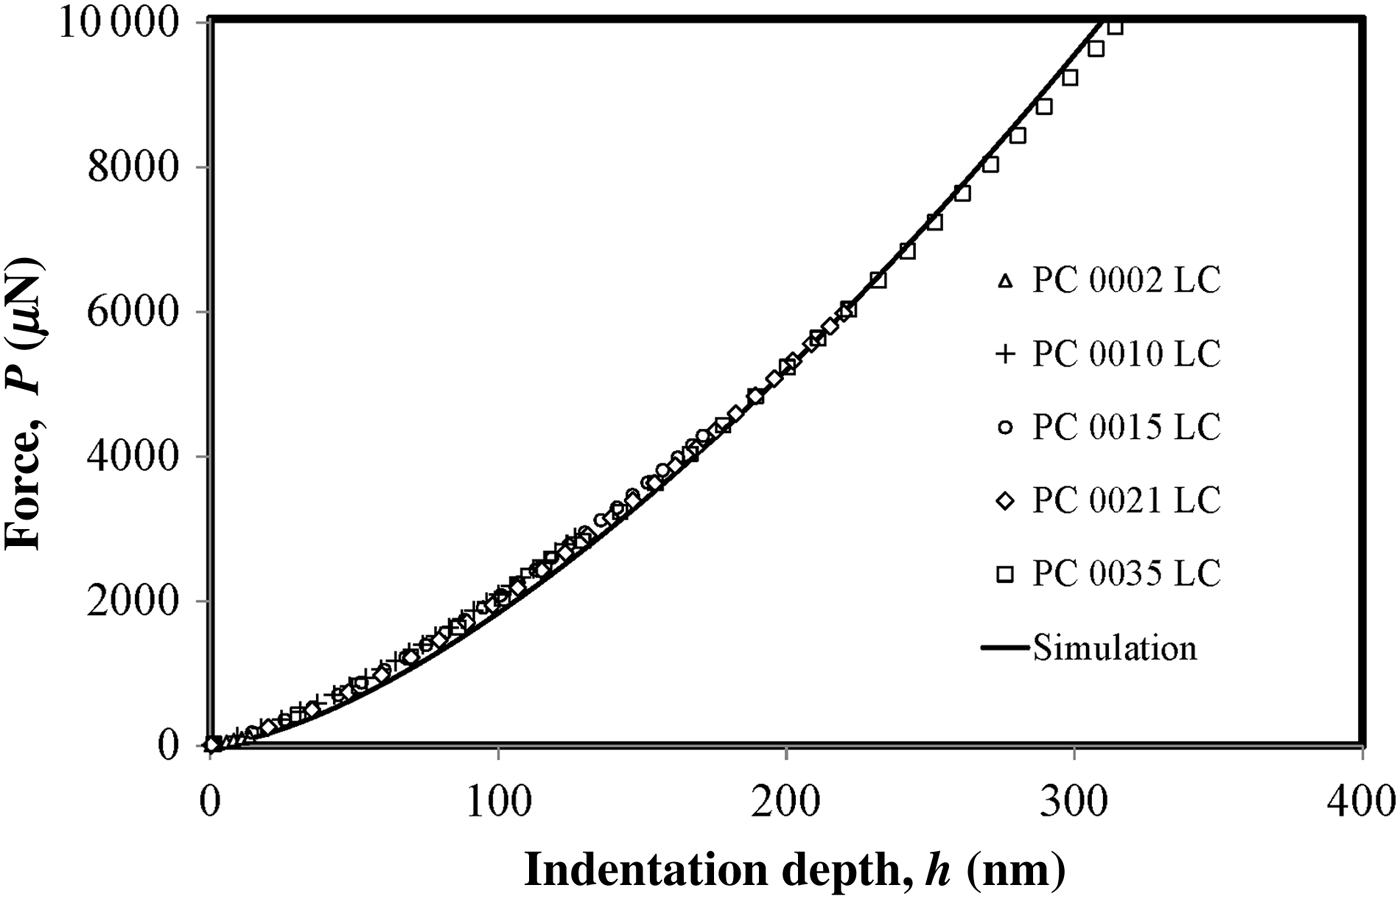
The major purpose to perform the finite-element analysis of the spherical nanoindentation experiments was to validate the Young's modulus measurement using Hertz's contact law. The second purpose was to examine the pure elastic deformation limit of the spherical indentation, which was required by Eq. (1). The simulation was performed using commercial software ABAQUS 6.11. The contact mechanics problem of the spherical indenter and the test material was treated as an axisymmetric problem similar to other papers.[Reference Donohue, Ambrus and Kalidindi13, Reference Rittel and Ravichandran22] The Young's moduli of polymers used in the simulation were obtained from the independent three-point bending experiments, rather than the Young's moduli measured from the indentation experiments. Under the maximum indentation force 10 mN, the maximum Von Mises stress could be obtained for each polymer specimen from the software. We find that this value was smaller than the yielding strength of the polymer; therefore plastic deformation will not occur for these polymer specimens subjected to the maximum indentation force, which was determined by our finite-element analysis. To compare the simulated force/indentation depth curves to the experimental curves, a set of experimental curves was selected throughout the range of the transducer capability. Figure 3 shows a simulated curve (solid line) with five experimental curves of PC, and a good agreement was found. Simulations on PMMA were also conducted and again, the experimental and simulated curves were quite close. We also briefly performed finite-element analysis for the conical nanoindentation. Owing to the sharp tip of the conical indenter, the maximum Von Mises stress of the polymer specimen exceeded the yield strength even under very small nanoindentation force. Therefore, for almost all sharp indenters, complicated plastic deformation co-exists with elastic deformation in the beginning of nanoindentation, and the elastic constant measurement is not as accurate as these measurements with pure elastic deformation (e.g. spherical nanoindentation).
Comparison of a simulated force–indentation depth curve (solid line) and some experimental curves (points) for PC specimens.
Conclusion
The Young's moduli measured from the elastic loading curves using Hertz's contact law are very close to the Young's moduli measured from the bending experiments. However, the Young's moduli measured from the elastic unloading curves using Oliver and Pharr's method are up to 60% higher than the bending moduli owing to complicated plasticity and viscoelastic effects involved.
Acknowledgments
The authors acknowledge the support from the Office of Naval Research (Polymer Composites Program) and the National Science Foundation (Surface Engineering and Materials Design Program). Valuable discussion with Professor Yu-Lin Sheng is appreciated.
Supplementary materials
For supplementary material for this article, please visit http://dx.doi.org/10.1557/mrc.2014.19