1. INTRODUCTION
Shipbuilding industry is a typical discrete manufacturing industry featuring small batch production and high-level process complexity. The manufacturing processes of shipbuilding include preprocessing, fabrication, assembly, painting, preerection, and block erection. The block erection process is the final stage of shipbuilding and involves constructing a ship by assembling blocks transported to docks by cranes. However, it is the starting point for production planning and constitutes the basis of the flow of manufacturing plans.
Production planning management is the core of shipbuilding management. In an actual shipbuilding process, it is necessary to carry out shipbuilding standard time estimation and develop a design plan, a production plan, and material requirement plans. The main problem in this process is the frequent changes of the production plan, with the change rate reaching from 30% to 70%. As a result of such frequent changes, the manufacturing performance can be significantly reduced, and sometimes the whole process may fail. Therefore, it is important to carefully devise a production plan control system before the total manufacturing process starts. The system must be able to adjust the plans during the block erection, if necessary, in order to prevent any avoidable losses. To develop such a production plan control system, both factory modeling and manufacturing process visualization are highly effective approaches. Such models for the block erection process should have the power to express and analyze highly complex planning and scheduling processes involving all the relevant factors that may affect the manufacturing process.
Current approaches to process planning in shipbuilding usually cannot identify how many factors are affecting changes and which factors are more sensitive than others. Therefore, the shipbuilding plans are mostly created and managed by humans. Although the human-based approach can take too much time and be erratic, the planning relies on the experience of the human experts in predicting possible future happenings that may affect the plan being developed. The key challenge for developing a systematic approach to shipbuilding planning is how one can predict, with sufficient accuracy, the future availability of resources, including equipment, machines, cranes, locations/spaces, and time slots.
Recent advancement in research on data mining and big data provides a promising approach to predicting the future. The basic idea of this paper has two parts: first, frequent changes of block erection planning can be dealt with properly if one can predict the future availability of all relevant resources; and second, the historical shipbuilding process data of a shipyard can serve as a big data set for predicting future availabilities of all relevant resources. The following sections described the details that elaborate this basic idea.
In recent years, the research of industrial big data has become a hot spot in many industrial areas. Data collection and data analyses are both important aspects of data mining. Deutsch (Reference Deutsch2014) pointed out that data collection infrastructure-centric technology are growing faster than data analytic models. Knowledge discovery method is the key aspect in big data technology. The algorithms about knowledge-extraction involve artificial intelligence, machine learning, and data visualization (Choudhary et al., Reference Choudhary, Harding and Tiwari2008). In order to improve the use of big data technology in manufacturing industry, researchers should pay much attention to data collection, processing, cleaning, transformation, and decision making based on big data (Stockton et al., Reference Stockton, Khalil and Mukhongo2012). The more valuable data collection and analysis will lead to more valuable decisions (Jain et al., Reference Jain, Triantis and Liu2011). The current data-related challenges in manufacturing systems are poor-quality data and lack of data analysis models (Wang et al., Reference Wang, Storey and Firth1995; Lee et al., Reference Lee, Kao and Yang2014). Visualization is an efficient method for decision making (Esmaeilian et al., Reference Esmaeilian, Behdad and Wang2016). Three-dimensional display technology, immersive computing technologies, and virtual reality technology will provide great support to the data visualization and manufacturing plan (Kim et al., Reference Kim, Yang and Han2006).
Jin et al. (Reference Jin, Wah, Cheng and Wang2015) made a survey of the big data, and pointed out the prospects of big data in data complexity, computational complexity, and system complexity. The accuracy of big data model is studied by Ateca-Amestoy and Prieto-Rodriguez (Reference Ateca-Amestoy and Prieto-Rodriguez2013). The research of big data in the manufacturing industry focused on using different algorithms to optimize scheduling to assess the program. Basak and Albayrak (Reference Başak and Albayrak2014) proposed a real-time scheduling and control decision model based on object-oriented Petri net for automobile manufacturing. However, this algorithm is not applicable for batch mode adaptation and discrete manufacturing. Lin and Chen (Reference Lin and Chen2015) studied the scheduling algorithm for mixed semiconductor assembly lines, and evaluated the performance of that algorithm with a simulation method. However, this research only considered scheduling simulation but did not mix the plans together effectively. Azab and Naderi (Reference Azab and Naderi2015) proposed a scheduling and modeling method for configurable manufacturing system, which is based on a small-scale model. Lee et al. (Reference Lee, Lapira, Bagheri and Kao2013) recently forecasted the current research progress and the tendency on the application of the big data technology in the manufacturing system. Huang et al. (Reference Huang, Zhong and Tsui2015) conducted the relevant research on the supply chain and logistic scheduling based on the use of radiofrequency identification.
Hey (Reference Hey2012) pointed out that the current data volume is increasing, the data structure is more complex, and the traditional experiment (empirical), theory (theoretical), and computing (computational) of the three paradigms have become difficult to fit new research areas. He put forward the “fourth data” (the fourth paradigm). This method, based on the data exploration, uses small models, guiding research for using “small model, big data.”
Shipbuilding planning is complex. With the continuous development of information systems such as enterprise resource planning and product life cycle management, the management mode is gradually transferred to the fine management. Especially in the manufacturing process, the accumulation of a large amount of data or information during the shipbuilding process can be used to determine the core factors of the ship manufacturing plan and to help designers and managers to make decisions so as to make continuous improvement in the manufacturing process possible.
In the following, the problem statement is given in Section 2, followed by erection plan modeling in Section 3. Section 4 describes a proposed data-driven approach to erection planning, and a case study is presented in Section 5. Finally, concluding remarks are drawn in Section 6.
2. PROBLEM STATEMENT
2.1. The process of shipbuilding
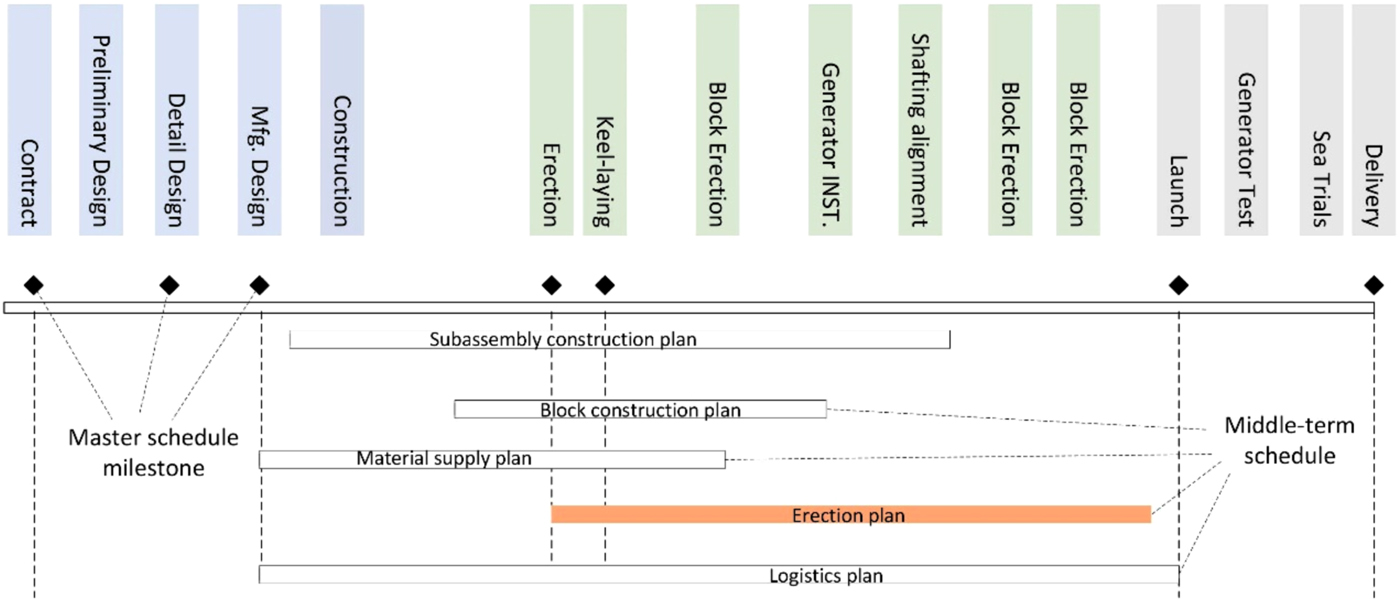
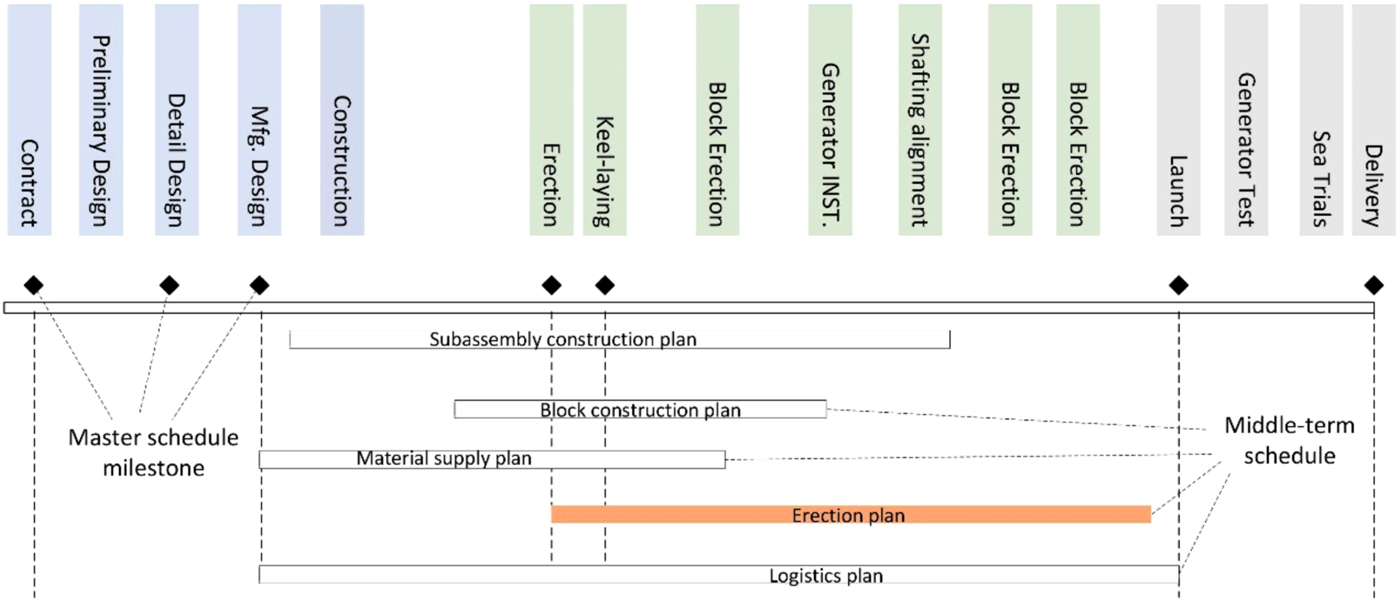
There are three types of plan in shipbuilding: long-term plan, middle-term plan, and short-term plan. The long-term plan (shipbuilding master plan) gives the deadline of key stages, such as deliver date of ship, completion time of ship design, makespan of main equipment, and so on. Those milestones are not changeable normally. Therefore, it is the primary coordinate for various detailed plans and for implementation of shipbuilding process control. The middle-term plan (block, dock erection, and outfitting construction plan) involves manufacturing main processes of ship construction. The short-term plan (weekly plan) is developed based on the long-term and middle-term plans, and it schedules all detailed manufacturing activities. Approximately 50% of ship construction time is occupied by the erection activities (gray area in Fig. 1).
Plans and primary activities for single shipbuilding.
To provide effective and efficient support for shipbuilding, an adaptive shipbuilding planning system must be able to generate block erection sequences that do the following:
-
1. Minimize the total time and cost for the erection process and guarantee the assembly accuracy and smoothness.
-
2. Identify and use manual labors and machines efficiently.
-
3. Avoid needs for unplanned maintenance. Failing to know certain manufacturing conditions often produces unplanned maintenance, which can be so expensive that it costs around $200 billion in the United States in 1990 (Baydar & Saitou, Reference Baydar and Saitou2001).
2.2. Major factors of erection plan
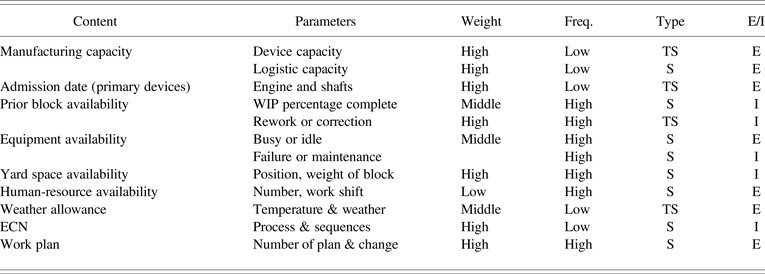
Shipbuilding plans are the main basis for both the production and production management in shipyards. There are many uncertain factors in the implementation of the shipbuilding plans. Any change with any of these factors may lead to significant plan delays. An analysis of the main factors affecting the building plans of a ship is shown in Table 1.
Relative major factors

Note: TS, Time series; S, static; E, explicit; I, implicit; WIP, workpiece in progress; ECN, engineering change notice.
All of the factors listed in Table 1 have a serious impact on the shipbuilding plan. The lean production of a ship can be realized if the historical data concerning these factors can be applied to model, analyze, and forecast the building plans and associated man power, equipment, and machine availability changes.
3. ERECTION PLAN MODELING
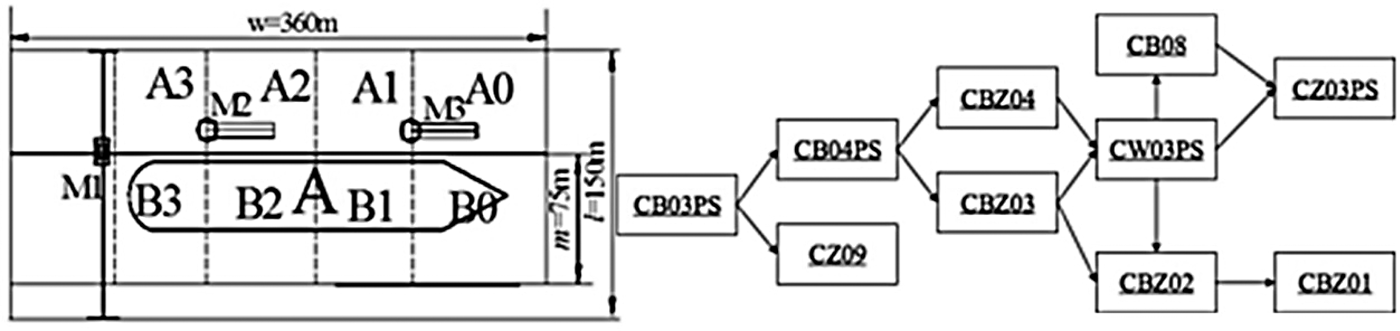
One major problem with the current shipbuilding planning is the mismatch between the utilization ratio of the dock and the availability of yard and manufacturing equipment. The unreasonable equipment scheduling for yard, dock, and hull closure has resulted in many “free operations,” taking a long time as a result of the delay of the plan. Figure 2 illustrates a layout of the restriction map for hull layout and the order of lifting segments, including erection devices (e.g., cranes) and storages. Erection devices include two types: gantry crane and portal crane. Storages include the field of dock and the platform near the dock. Figure 2 shows an example of the resources of a dock. The status of the cranes (gantry crane: M1; portal cranes: M2, M3) may be busy or idle and the status of the storages (dock field: B0–B3; platform field: A0–A3) may be occupied or empty.
Diagram of shipyard layout and its resource, precedence sequence.

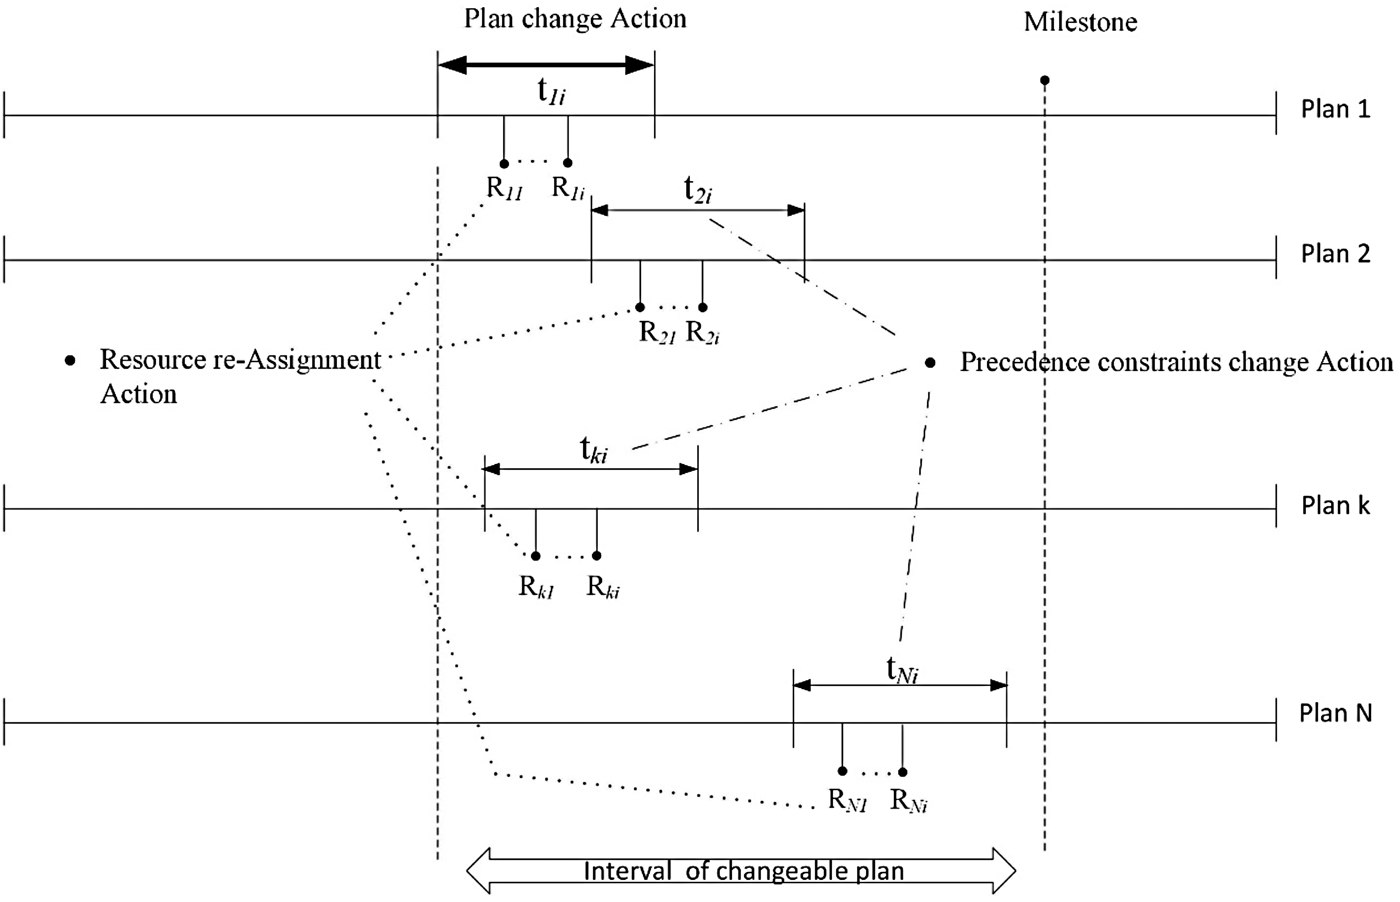
The ship segments, built at the platform, were taken to the yard and assembled into a total section. Finally, these segments were lifted to the dock for hull closure. The platform is divided into seven zones. The yard is divided into three districts, composed of four cranes, two plate transport vehicles, seven operating zones, and the yard's three operation areas. This paper focuses on erection plan. An abstraction of the weekly erection plan is illustrated in Figure 3.
Definition of erection plan.

Plans (1~N) are made by different erection processes. Each plan has some changeable subplans, and its duration is defined as t i,j . These activities are often constrained by sets of resources (R i,j ) and precedence orders. In addition, the subplans are also limited by the master or middle-term schedules. The planning problem is defined in this paper as to minimize Eq. (1) subject to Eqs. (2) through (5):
 $$Z = \sum\limits_{i = 1}^n {w_i C_i\comma \,} $$
 $$\mathop \forall \limits_{1 \le t \le S} \quad\,\sum\limits_{i = 1}^n {O_{it} \le M}\comma \, $$
 $$\mathop \forall \limits_{1 \le i \le n} \mathop \forall \limits_{\,j \in D_i} \quad\,t_j + p_j \le t_i\comma \, $$
 $$S = {\rm max}\{t_{i}\comma\, (1 \le i \le n)\}\comma $$
 $$t_i\comma\,t_j \in Z^ + (1 \le i\comma\,j \le n)\comma $$
where Z is the total completion time considering every plan's weight factor, w i is the weight of plan I, C i is the completion time of plan I, n is the total number of plans, O it is the total number of devices that are occupied by plan i in time t, M is the total number of devices, t i is the starting time of plan I, p j is the processing time of plan j (j ∈ D i ), and S is the probable completion time of the final plan.
The objective of scheduling is to minimize the weighted total completion time Z, as shown in Eq. (1). Every block is assigned a weighting factor according to its importance. One machine can process only one task at any time. Some blocks need only one machine to complete, while some blocks require two machines simultaneously. The total number of occupied machines at particular time t cannot exceed the total capacity of all machines M. The crane machine capacity constraints are represented by Eq. (2). A task cannot be started until its direct preceding tasks are finished, and a task requires a specific amount time for processing. The precedence constraints are the precedence of different blocks to be processed. Equation (3) is the formulation of task precedence constraints. Here, t i is the decision variable; S, C i , and O it are the dependent variables. Equation (5) indicates that the start time of a task is a positive integer.
4. A DATA-DRIVEN APPROACH
4.1. Data in the shipbuilding erection plan
The smooth implementation of the established production plan not only depends on the material, equipment, labor, location, capital, and information and other resources, but also depends on how to configure and use these resources. A scientific method is adopted to optimize the operation plan of the building, and the work plan is decomposed and transformed into efficient daily production activities.
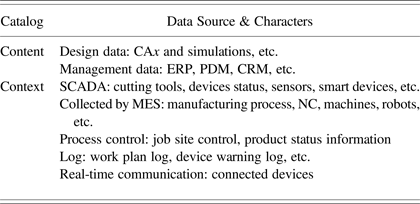
There are two major types of data in shipbuilding: contextual data and content. Content is the data related to the ship manufacturing concerning management and design procedures. Contextual data is more critical, and collected from the manufacturing process, product-related manufacturing equipment, testing equipment, and auxiliary equipment, as shown in Table 2.
Data set of shipbuilding erection

The shipbuilding industry is different from other manufacturing industries due to its manufacturing chain length. The monitoring and forecasting of abnormal condition of equipment is to collect the operation status data and maintenance a log for the key equipment (crane, welding machine, cutting machine, cutting machine, etc.), find out the mode of the abnormal occurrence of the equipment, monitor and predict the future failure probability, and then plan the future, taking into account the effect of the repair time on the schedule. These data are generated each second and grows massive in size after a long period.
Unstructured data is raw and unorganized, and organizations store all of it. Not all types of unstructured data can easily be converted into a structured model. Only 10%–20% of context-relevant information originates in an unstructured form, primarily monitor videos, pictures, and geometric models. Between 60% and 70% of content information is structured data, which are stored in RDMS or other NoSQL. Meanwhile, the balance is semistructured data, such as process logs. In this research, all of the information is organized into structured data using nested key-value pairs. A typical document is as follows:
{
id: 1,
name: “Crane 10-3,”
location: 10.125L,45.023W
specs: {
manufacturer: “ZPMC,”
capacity: 160T,
speed: 1.6,
Weight: 150
},
Description: “1# Crane,”
Runtime: 42.2h,
Current status: Occupied
Last HM Date:2015-2-5 12:34
}
4.2. Data-driven system
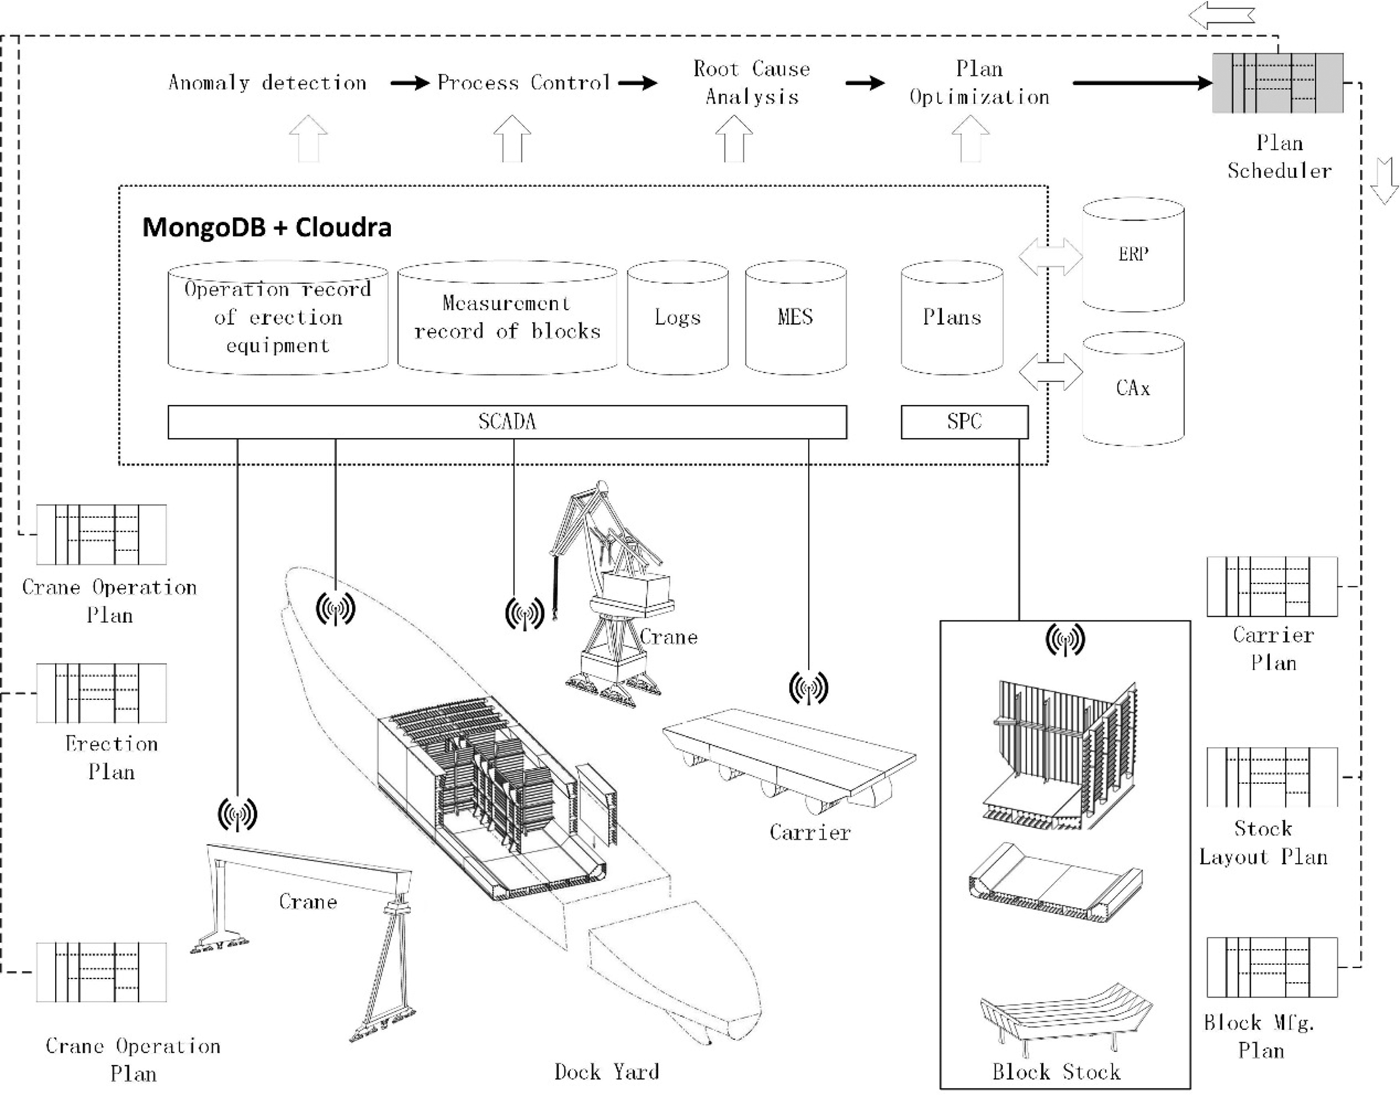
Figure 4 is an illustration of the data-driven system developed to deal with the main problems that the shipbuilding industry is facing with erection planning. The historical shipbuilding data is analyzed, organized, and utilized in the process of generating the shipbuilding plan. The process includes the following: generation and loading of structured, unstructured, or semistructured data; data cleaning, data flow organizing, compression, and storage to Hadoop or NoSQL; MapReduce flow data analysis and calculation (Moseley, Reference Moseley, Dasgupta, Kumar and Sarlós2011); data utilization; and data visualization and decision-making support.
A data-driven system for shipbuilding manufacturing planning.

4.3. Clustering based on K-means
The big data generated by the shipbuilding process is composed of real-time data that represent the status of the whole shipbuilding system. These data are generated by the sensors of the system and then converted to the information of the various components. By processing these data, the working state of the shipbuilding system is identified, and the future status of the shipbuilding machines and facilities is forecasted by comparing the real-time data with the historical data. The affected factors related to the change of shipbuilding plan are discovered through the K-means clustering method. If the sample set is divided into C categories, the algorithm can be described as follows:
-
1. selection of initial centers for C classes properly;
-
2. in the k iteration, for any samples, calculate the distance to the C center, and put the sample to the shortest distance of the center;
-
3. to update the central values of the class by means of the mean value; and
-
4. for all C clustering centers, if the value remains unchanged after using the iterative method, then the stop the iteration, otherwise continue the iteration.
More details can be found in the case study section.
4.4. Health management based anomaly detection
Three broad categories of anomaly detection techniques exist. Unsupervised anomaly detection techniques detect anomalies in an unlabeled test data set under the assumption that the majority of the instances in the data set are normal by looking for instances that seem to fit least to the remainder of the data set. Supervised anomaly detection techniques require a data set that has been labeled as “normal” and “abnormal” and involves training a classifier (the key difference to many other statistical classification problems is the inherent unbalanced nature of outlier detection). Semisupervised anomaly detection techniques construct a model representing normal behavior from a given normal training data set, and then testing the likelihood of a test instance to be generated by the learned model. This paper adopted a simple method: distance-based method. There are two steps in this method:
-
Step 1. Compute neighborhood for each data record.
-
Step 2. Analyze the neighborhood to determine whether data record is an anomaly.
5. CASE STUDY
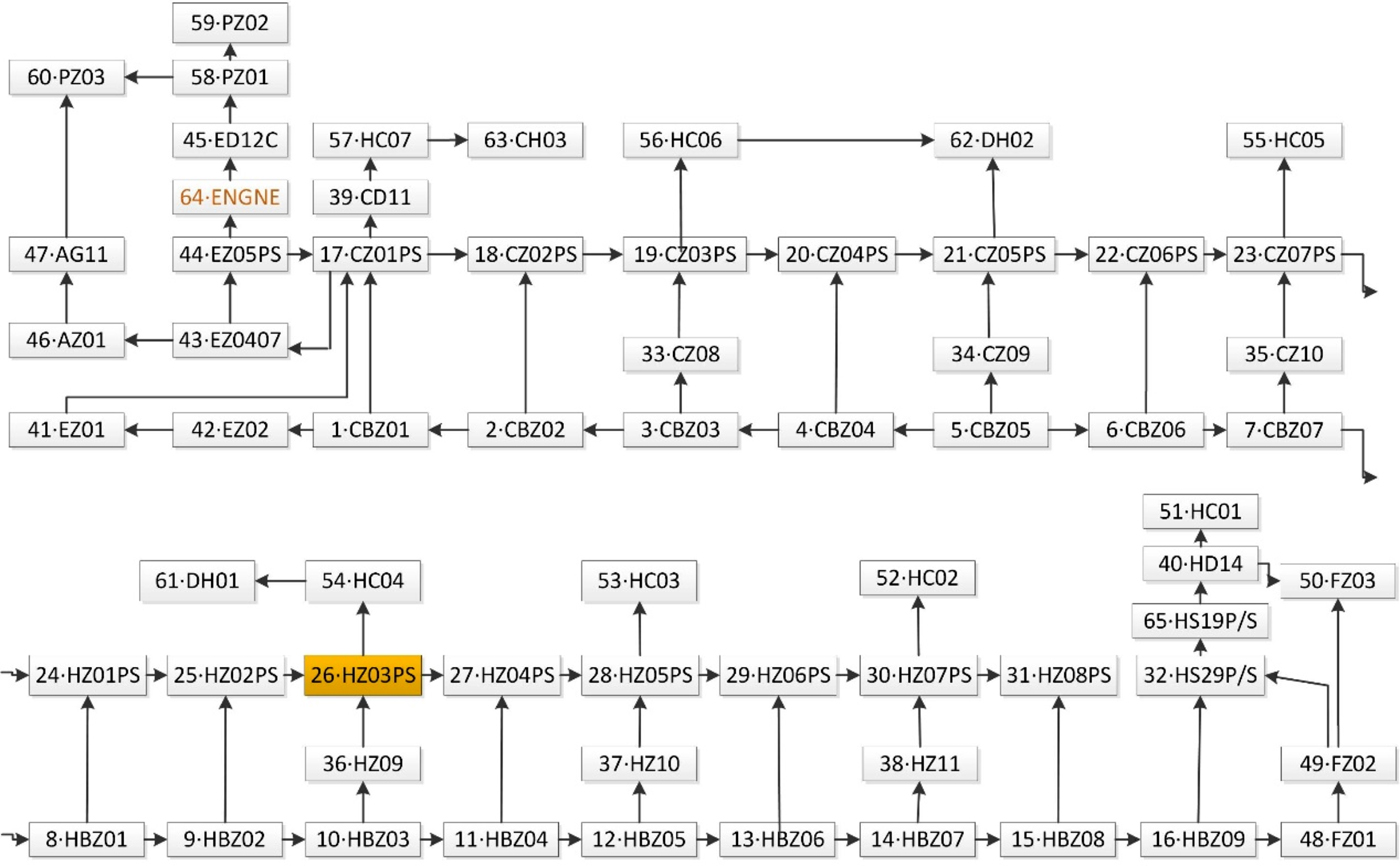
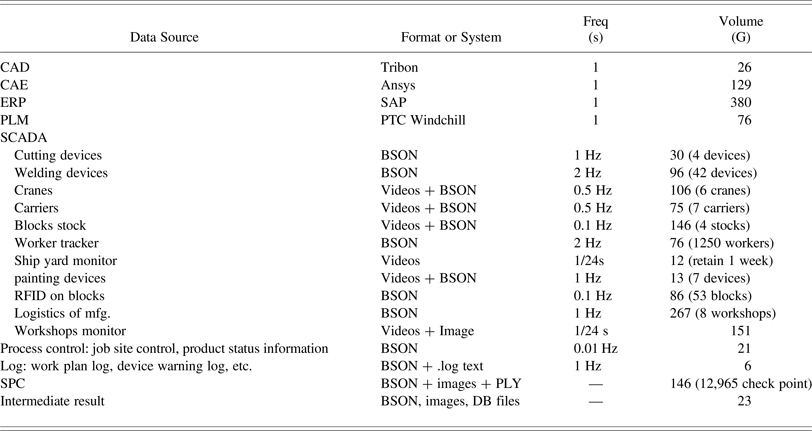
Six months of related manufacturing data are gathered continuously, stored in MongoDB and Cloudra. The total data volume is about 1865GB for erecting 53 blocks of a 53xx TEU. The erection network and precedence sequence of 5xxx TEU is shown in Figure 5. As mentioned above, there are two types of data, as shown in Table 3: content data and contextual data.
Erection network and precedence sequence of 5xxx TEU ship.

Details of data

As described in Section 4.3, the K-means algorithm was used to discover the affected factors related to the change of the shipbuilding plan. However, the variables of erection plan are usually high-dimensional data. Therefore, it is important to find a way to reduce its dimension. Principal component analysis (PCA) is a technique to emphasize variation and bring out strong patterns in a data set. It is often used to make data easy to explore and visualize. The PCA method improves K-means clustering solutions and the cluster structures are embedded in the first K – 1 principal components. In this study, the adopted method runs the PCA algorithm many times with similar plans and provides visualization of the clustering structure of the obtained components. Furthermore the K-means algorithm was conducted to carry out factor clustering.
Defining the ith principal component (like a new variable or column) as PC i, , it can be calculated by Eq. (6):
 $$\hbox{PC}_i = \mathop \sum \limits_{\,j = 1}^p \lpar {a_{ij} X_j} \rpar \comma \,$$
where X j is the ith origin variable, PC i = a i T∑a i , such that a i T a i = 1, where ∑ is the covariance matrix. PC1 is the first principle component.
In general, it essentially rotates the data (via an N-dimensional rotation matrix) in such a way to maximize the variance along the new axis PC1, PC2, … , PC N , sorted from largest to smallest.
The calculation process consists of the following steps:
-
Step 1. Parameters for the PCA estimation algorithm are selected.
-
Step 2. Translate the data so that the center is at the origin.
-
Step 3. Calculate the covariance matrix and distance using K-means.
-
Step 4. Find the principal components after clustering computing.
-
Step 5. Reduce the data using the selected principal components.
-
Step 6. Visualize by nonlinear two-dimensional projection (multidimensional scaling suggested by Gordon, Reference Gordon1987) using R.
Taking the Block HZ03-PS erection plan, for example, during processing this plan (Plan 26, orange node in Fig. 5), cranes' availabilities and other parameters are collected. Points in the diagram are nodes (including resources required and its weight) defined in the erection network, and edges are precedence relations in the plan. The availability of equipment and other factors are highlighted using a clustering method in our data-driven planning system with visualization shown in Figure 6. Meanwhile the device failure detections were taken into consideration in plan adjustment.
Sensitive factors identified by clustering and visualization of Plan 26.

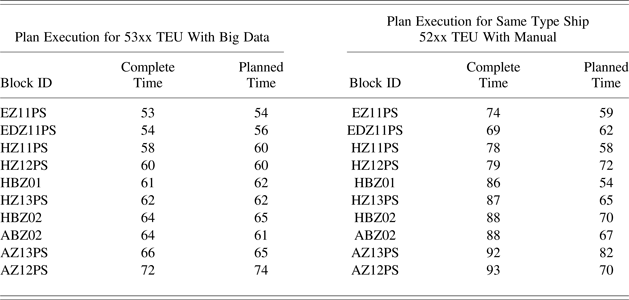
To demonstrate the advantage of the data-driven planning approach, the result of the system was compared to the result with the 10 blocks' schedule attainment of a similar ship (52xx TEU) with the same erection network. The comparison is shown in Table 4.
Erection plan execution by block

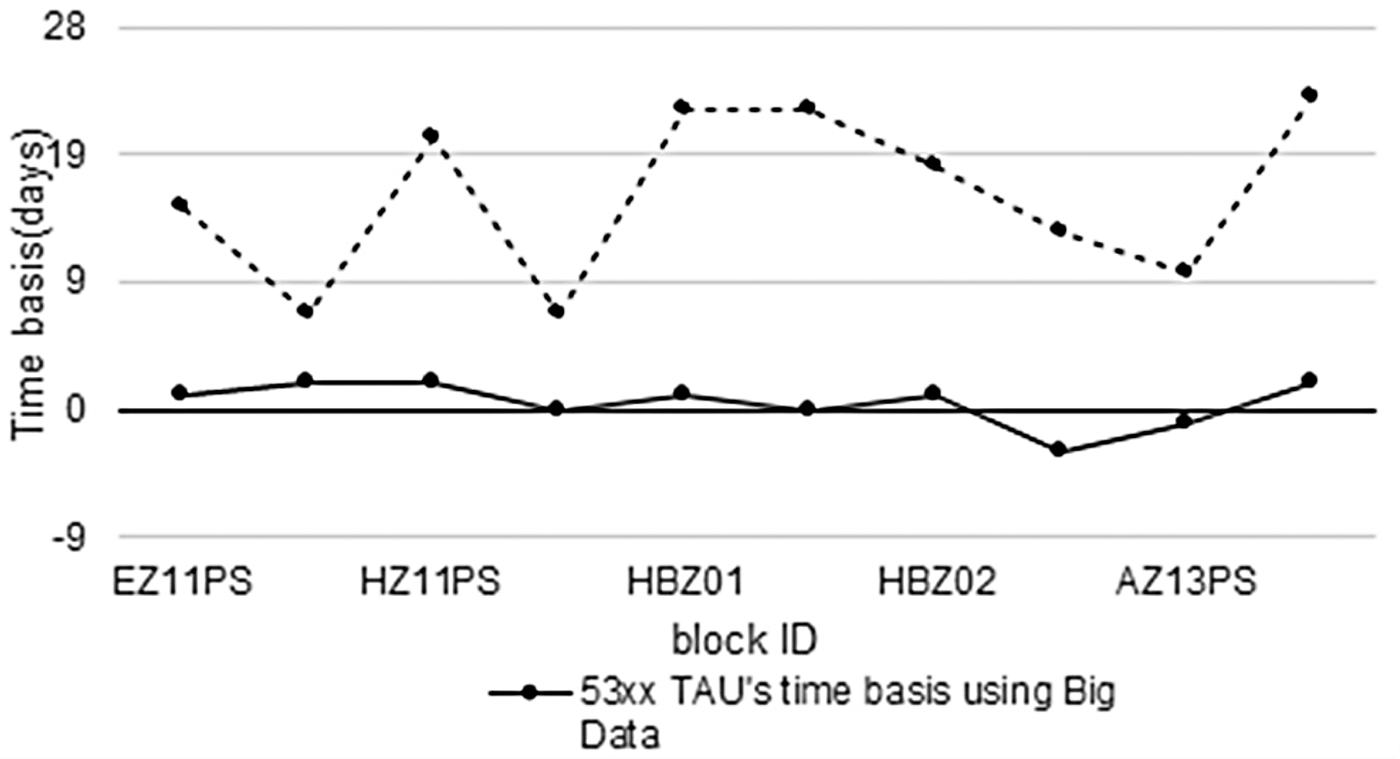
In Figure 7, the plan execution of Ship 52xx (broken lines in Fig. 7) was manually adjusted when the plan is changed, while the data-driven planning-based adjustment is automated by the system (solid lines in Fig. 7). As indicated in Figure 7, data-driven planning-based adjustment yields a much smaller range of time variation, less than 5 days, when compared with the manual adjustment result.
Time basis between manual and using big data.

6. CONCLUSIONS
With the development of industrial big data technology, the rapid growth of semistructured and nonstructured data, the analysis and application of industrial data give more production and management support for realizing “intelligent shipbuilding.” This study proposed a data-driven approach for shipbuilding erection planning, and the planning and replanning of the shipbuilding plan for the best production performance were optimized. Through data clustering, the relevant factors are identified as a result of plan change, and critical equipment health management is carried out through data-driven anomaly detection. In the course of this research, two major challenges were addressed. First, the complex shipyard situation and complex block erection scheduling had made it difficult to do pure data mining. Utilizing PCA has led to reduced dimension and visualization (human in the loop), and a blended PCA plus K-Means approach has been proven effective to carry out factor clustering tasks in this domain. Second, the complex erection plan is composed of many changeable subplans, which made it difficult to build a proper process model for planning. Introducing the weighted total completion time Z has simplified the problem and made the objective of scheduling to minimize Z.
The approach described in this technical brief paper still relies on human experience and human decisions. Future work will apply machine learning techniques to acquire human knowledge and reduce the need for human involvement.
ACKNOWLEDGMENT
This research was supported by the National Science Foundation of China (51475301, 51435009), Shanghai Leading Academic Discipline Project B602, and the Fundamental Research Funds for the Central Universities.
Jinsong Bao is an Associate Professor at Donghua University. He received his PhD degree at Shanghai Jiaotong University. Dr. Bao's research interests are in intelligent manufacturing systems and computer-integrated manufacturing systems.
Jianguo Zhang is a Lecturer at Donghua University. He received his PhD degree at Shanghai Jiaotong University in 2014. Dr. Zhang's research interests are in intelligent manufacturing and coated tools.
Xia Ji is a Lecturer at Donghua University. He received his PhD degree at Shanghai Jiaotong University in 2014. Dr. Ji's research interests are in intelligent manufacturing and green manufacturing technology.
Xiaohu Zheng is a Lecturer at Donghua University. He received his PhD degree at Shanghai Jiaotong University. Dr. Zheng's research interests are in intelligent manufacturing systems and precision manufacturing technology.