Implications
The current study provides further evidence that gilt progeny have inferior lifetime growth performance compared to sow progeny. It reaffirms that this loss is highly attributable to low birth weights and growth in the pre-weaning period. Under the commercial conditions of the study, it is not recommended that gilt and sow progeny are separated to improve production, as it appears that while segregation of gilt and sow progeny in the grower–finisher period may be advantageous for sow progeny; it seems to disadvantage gilt progeny and has mixed effects depending on sex of the animal.
Introduction
Progeny born to gilts (gilt progeny, GP) are lighter and grow more slowly than their sow progeny (SP) counterparts, usually resulting in an increase in days to market and a reduction in overall herd productivity (Carney-Hinkle et al., Reference Carney-Hinkle, Tran, Bundy, Moreno, Miller and Burkey2013, Craig et al., Reference Craig, Collins, Bunter, Cottrell, Dunshea and Pluske2017a). Gilt progeny may have compromised growth and immunity from early in life due to the relative immaturity of their dam during her first gestation (Miller et al., Reference Miller, Collins, Emery, Begg, Smits and Holyoake2012, Carney-Hinkle et al., Reference Carney-Hinkle, Tran, Bundy, Moreno, Miller and Burkey2013), reducing their capacity to fight infection and increasing their chances of early mortality (Rooke and Bland, Reference Rooke and Bland2002). Segregated GP and SP production systems are sometimes considered because of the purported benefits of managing pigs of different immune status separately (Moore, Reference Moore2001). In a previous study (Craig et al., Reference Craig, Collins, Bunter, Cottrell, Dunshea and Pluske2017a), the growth performance of GP and SP was compared in the grower–finisher period when they were either mixed or segregated from each other from weaning within the same farm. The current experiment was designed to determine the difference in performance between GP and SP from birth until slaughter in pigs under a set of different commercial conditions (i.e. management, genetics, climate, health status, etc.) in Queensland, Australia. While segregation did not improve growth performance of either GP or SP in our previous study (Craig et al., Reference Craig, Collins, Bunter, Cottrell, Dunshea and Pluske2017a), GP suffered more respiratory disease-related mortality than SP during the grower–finisher period. Therefore, in the current study, we aimed to evaluate the effect of segregation in the grower–finisher period of previously mixed GP and SP as a management tool to improve growth performance, under the assumptions that (1) previous exposure to pathogens when initially mixed would improve their immunity to these same pathogens later in life and (2) later segregation would allow for improved management of at-risk GP during the grower–finisher stage of production. The general hypotheses examined were that GP would be born lighter and grow slower than SP throughout their lifetime, and that keeping these progeny groups in separate pens during the grower–finisher phase would cause improved growth performance of both GP and SP.
Material and methods
Experimental design
The experiment was conducted under commercial conditions at a 9000 sow piggery site in Queensland (SunPork Farms, Dalby, Queensland, Australia). All piglets (CamboroughTM 29 × PIGBOAR 500, PIC Australia Pty. Ltd., Grong Grong, New South Wales, Australia) born to 61 primiparous (gilts, parity 1) and 47 multiparous (parities 2 to 7) sows were included in the current experiment, including a total of 584 GP and 567 SP (603 males and 548 females). All piglets were born over a 10-day period in November 2016, with each individual’s birth weight (BWT) recorded within 24 h of birth and each piglet identified with a numbered ear tag, prior to fostering. Dam parity, litter size of the litter of origin and farrowing room of birth were recorded for each piglet. Minimal fostering took place to standardise litter sizes according to the number of functional teats as per commercial procedures, after allowing piglets sufficient time to receive colostrum from their dam. Fostering was conducted such that GP were nursed by gilts and SP were nursed by sows for the entire pre-weaning period. Piglets were individually weighed at weaning (WWT) at 23.7 ± 0.1 days of age (mean ± SEM), and average daily gain (ADG) during this pre-weaning period was calculated.
Pigs were then housed in the farm’s weaner facility until 10 weeks of age (72.7 ± 0.1 days of age) when they were transported to the site’s grower–finisher facility and weighed individually (10WT). Pigs were then randomly split into pens of either all GP (GG), all SP (SS) or a mix (M) of both where the allocation of GP (GM) and SP (SM) to these pens was targeted towards a ratio of 1 : 1 (33 to 39 pigs per pen). Pigs were then individually weighed (sale weight, SWT) approximately 6 days prior to slaughter (146.7 ± 0.1 days of age). The ADG was calculated for the weaner (approximately 3 to 10 weeks of age) and grower–finisher (10 weeks to sale) phases for each individual pig, as well as from weaning to sale (3 weeks to sale) and from birth to sale. Within the grower–finisher phase, total feed consumed within each pen was recorded. Feed was offered on an ad libitum basis via a penguin-type self-feeder, and feed delivered was recorded via a FeedProTM intelligent feed delivery unit (Feedlogic Corp, Willmar MN, USA). From these data, average daily feed intake (ADFI) and gain to feed ratio (G : F) were calculated for each pen and represented as averages per pig, with an adjustment for pigs that died during that period. Values were adjusted depending on the number of pigs that were consuming feed each day (‘pig days’). Unfortunately the weight of pigs that died was not recorded at time of death and could not be taken into account for calculating G : F.
At sale, each pig was given an individual tattoo for carcass identification, and transported to a commercial abattoir (Swickers Kingaroy Bacon Factory Pty. Ltd., Kingaroy, Queensland, Australia) where they were slaughtered over a period of 2 days (152.2 ± 0.1 days of age). Hot carcass weight (HCW) was measured on a hanging scale, and fat depth at the P2 site (6.5 cm from the midline over the last rib, FAT) was measured using a PorkScan Ultrasound Probe (Sonoscape Medical Corp, Shenzhen, China).
Animal management
Gilts and sows were housed separately throughout gestation in groups of 54 to 56 pigs per pen (1.44 m2 per gilt and 1.73 m2 per sow). Gilts and sows entered the farrowing house at approximately 113 days of gestation and were housed in individual farrowing crates (2.0 m × 1.6 m) located in seven farrowing rooms, with both gilts and sows housed together within rooms where possible with the exception of two of the rooms that contained gilts only. Each crate was fitted with a heating lamp over the creep area, one drinker for the sow and one drinker for the piglets. Piglets were given an injection of 1 ml of combined Fe plus cyanocobalamin (FeronTM 200 + B12, Bayer Australia Ltd., New South Wales, Australia) and procaine penicillin (Ilium PropercillinTM, Troy Laboratories Australia Pty. Ltd., New South Wales, Australia), and 1 ml of toltrazuril (Baycox®, Bayer Australia Ltd., New South Wales, Australia), all at 3 days after birth, and their tails were docked. All sows were fed common gestation (12.8 MJ digestible energy (DE)/kg, 13.0% CP and 0.4% standardised ileal digestible (SID) lysine, as-fed basis) and lactation (14.2 MJ DE/kg, 17.5% CP and 0.6% SID lysine) diets throughout the experiment. Piglets were provided ad libitum access to creep feed (14.8 MJ DE/kg, 21.0% CP and 0.9% SID lysine) approximately 7 days before weaning. All diets were manufactured by Woods Stockfeeds (Goondiwindi, Queensland, Australia). Piglets were vaccinated against porcine circovirus type 2 (Ingelvac CircoFLEX®, Boehringer Ingelheim Pty. Ltd., New South Wales, Australia) at weaning. Weaning was carried out over 3 days within 1 week, according to age of the piglets.
After weaning, GP and SP were mixed in one room within pens of maximum capacity of 230 pigs/pen (approximately 0.20 m2 per pig) between sexes as per commercial practices, with the room (six pens) fitted with two heaters and each pen fitted with 16 drinker nipples and five penguin-type feeders. As such, the ratio of GP to SP in each pen or whether littermates were housed together was unknown. During this period pigs were given ad libitum access to a standard commercial weaner diet (averaging 14.4 MJ DE/kg, 21.6% CP and 0.8% SID lysine) for the entire weaner period. At approximately 10 weeks of age, pigs were moved into the grower–finisher facility on a single day. Due to the maximum capacity of the facility (800 pigs), not all experimental animals were able to be followed into the grower–finisher period. The randomly selected subset of pigs were sorted into pens of 33 to 39 pigs per pen (approximately 0.87 m2/pig) fitted with four drinker nipples, with females and males housed separately. During this period pigs were given ad libitum access to standard commercial grower (averaging 14.0 MJ DE/kg, 17.7% CP and 0.6% SID lysine) and finisher (averaging 13.3 MJ DE/kg, 14.1% CP and 0.6% SID lysine) diets. Males were immunologically castrated using an anti-GnRH vaccine (Improvac®, Zoetis, New South Wales, Australia) given at 15 and 19 weeks of age.
Unfortunately, all individual foster movements were not recorded in the farrowing house and mortality records were incomplete with a number of piglets recorded missing at weaning. Likewise, mortality was unable to be individually recorded in the weaner facility and therefore pre-weaning and weaner mortality data could not be presented for the current study. In the grower–finisher facility, there were a total of seven mortalities for the duration of the study and therefore the sample size lacked statistical power to detect any treatment effects.
Statistical analysis
The data were analysed using three model variations as described by Craig et al. (Reference Craig, Collins, Bunter, Cottrell, Dunshea and Pluske2017a; Figure 1): (i) the birth group model (GP v. SP), (ii) the rearing group model (contrasts among GG, SS and M) and (iii) the subgroup model (GG, SS, GM and SM). For the subgroup model, the following contrasts were considered: (i) GG v. GM and (ii) SS v. SM. Individual performance data were analysed using the MIXED procedure of SPSS (IBM SPSS® version 24.0, IBM, Armonk NY, USA), with individual pig as the experimental unit. For all traits and models, both treatment and sex were included as fixed factors. Main effects of sex reported herein were obtained from the birth group model. The treatment × sex interaction term was included where it made a contribution to the model (P < 0.10), and pairwise comparisons between interaction means were performed using simple effects (partitioned) analysis in SPSS syntax. All nuisance variables were tested in each model using the backward elimination procedure and were removed if they did not make a significant (P < 0.05) contribution to the model. Dam parity group (parity 1, parities 2 to 4 and parity >4) nested within birth group treatment was fitted as a class effect for each trait to test for the effect of the range of multiparous sow parities included in the experiment. The age of the animal at time of live weight measurement was fitted as a covariate for each trait, and litter of birth (to account for the impact of both common genes and a common environment before weaning) and farrowing room of birth were tested as random factors in each model where appropriate. Pen location was not recorded for individual pigs in the weaner period and could therefore not be included in any models. Birth weight was analysed fitting litter size as a covariate, and without. To investigate the effect of earlier weights in the farrowing house on later growth performance, BWT was fitted as a covariate in the analysis of WWT and pre-weaning ADG. In the same way, WWT was fitted as a covariate for post-weaning traits. Therefore, two successive analyses were performed, one with prior weight as a covariate and one without.
Graphical representation of the experimental procedures used, showing the organisation of pigs into treatments and the points of data collection. Birth group treatments are gilt progeny (GP) and sow progeny (SP); rearing group treatments are GP penned together (GG), SP penned together (SS) and GP and SP mixed in a common pen (M); and subgroup treatments are GG, SS, GP mixed with SP in a common pen (GM) and SP mixed with GP in a common pen (SM). FAT = carcass fat level measured at the P2 site; HCW = hot carcass weight; DP = dressing percentage: HCW/sale weight) × 100.

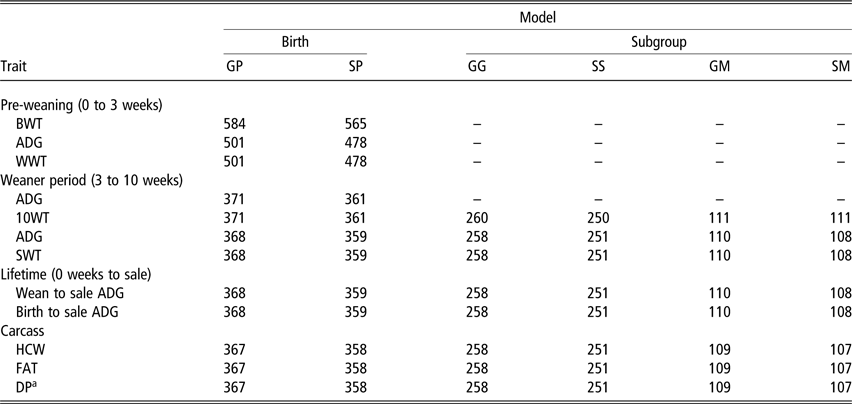
Grower–finisher and carcass data were analysed as a univariate ANOVA using the rearing group treatment model in the GLM procedure of SPSS, with the experimental unit as the pen, without blocking (n = 3 for female SS, GG and M and male M pens; n = 4 for male SS and GG pens). To analyse back fat levels at a standard carcass weight, two successive analyses were performed; one with HCW was fitted as a covariate for FAT and one without. Dressing percentage (DP) was calculated from HCW recorded at sale and SWT recorded 6 days earlier ((HCW ÷ SWT) × 100). Table 1 shows the number of individual pig observations for each trait and treatment after editing for outliers in each analysis. Outliers were considered if they were greater than two standard deviations from the mean and only a small number were removed from the analysis, as they were most likely data entry errors and deemed to not make biological sense. Differences between individual treatment means were determined using a Bonferroni adjustment for multiple pairwise comparisons where appropriate. Estimates are reported herein as least squares means ± SEM. Due to the unbalanced design, individual SEM is reported for each treatment group mean for the individual pig experimental unit analyses.
Number of pigs (n) represented in each treatment group for each individual trait (after editing for outliers)

BWT = birth weight; ADG = average daily gain, WWT = weaning weight (3 weeks; 23.7 ± 0.1 days of age); 10WT = 10 week weight (72.7 ± 0.1 days of age); SWT = sale weight (146.7 ± 0.1 days of age); HCW = hot carcass weight (slaughter age = 152.2 ± 0.1 days of age); FAT = carcass fat depth measured at the P2 site; DP = dressing percentage: (HCW/SWT) × 100; GP = gilt progeny; SP = sow progeny; GG = GP separately penned; SS = SP separately penned; GM = GP mixed with SP in a common pen; SM = SP mixed with GP in a common pen.
a Represents a modified DP calculated based on HCW measured on day of slaughter and SWT measured approximately 6 days prior to slaughter.
Results
Farrowing room and dam parity group nested within birth group treatment did not have a significant effect on any trait and were therefore omitted from all models. Conversely, litter of birth and age had a significant effect on a number of traits and were therefore included in the relevant models. The treatment × sex interaction effect was only significant (P < 0.05) for carcass traits and was therefore omitted from all other models, with the exception of the pen ANOVA analysis of grower–finisher feed efficiency traits. Birth weight (BWT) had a significant (P < 0.001) effect on the model for each of the other farrowing house traits when included in the model as a covariate. Likewise, WWT had a significant (P < 0.001) effect on the model for each of the subsequent growth traits (10WT, ADG, SWT, etc.) measured when included as a covariate. Age at sale (or at slaughter) was fitted as a covariate where significant (P < 0.05) in all relevant models, as GG pens were sold at a younger age than M pens (average 145.85 ± 0.12 and 146.76 ± 0.11 days of age, respectively), both of which were sold younger than SS pens (average 147.64 ± 0.03 days of age). Results from the rearing group analysis of grower–finisher performance traits reported refer to the results of the ANOVA with pen as the experimental unit.
Farrowing house
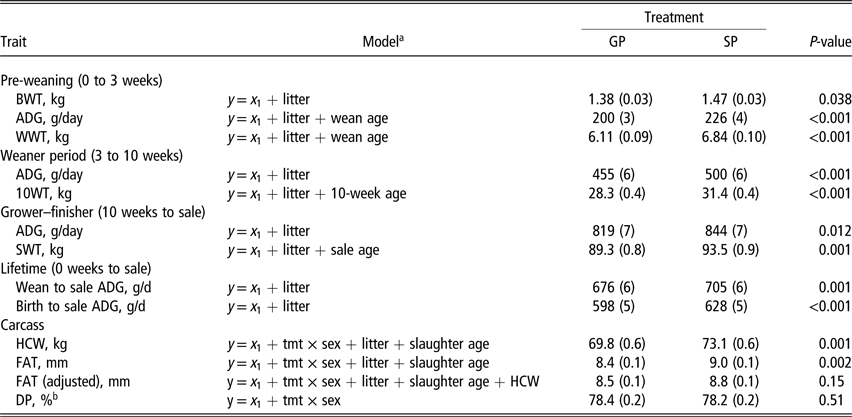
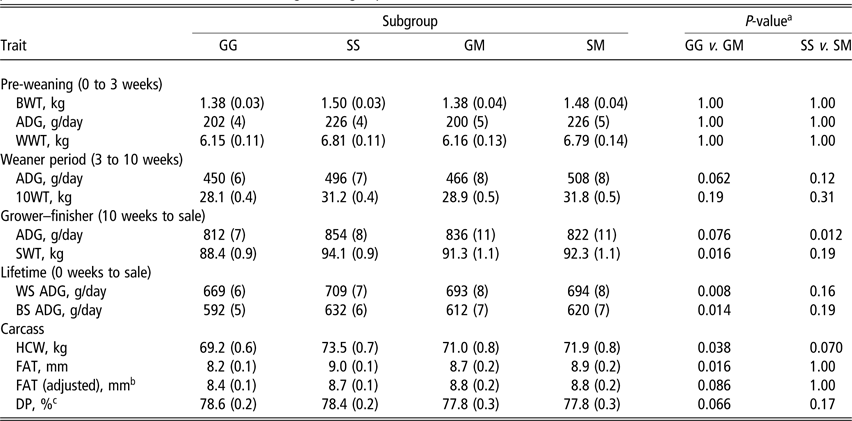
Gilts had a birth litter size of 10.5 ± 2.6 piglets and sows had a birth litter size of 12.7 ± 2.4 piglets (mean ± SD). Gilt progeny were born 90 g lighter (P = 0.038) than SP (Table 2), and males (1.45 ± 0.02 kg) were born heavier (P = 0.001) than females (1.40 ± 0.02 kg). The difference between GP and SP BWT was highly significant (P < 0.001) after adjusting for birth litter size (1.31 ± 0.03 v. 1.50 ± 0.03 kg, respectively). Gilt progeny grew 26 g/day slower (P < 0.001) than SP in this period, which resulted in them being 730 g lighter (P < 0.001) at weaning (Table 2). When adjusting for BWT as a covariate, GP remained lighter (P < 0.001) than SP at weaning (6.17 ± 0.07 v. 6.73 ± 0.08 kg, respectively), with pre-weaning ADG remaining different (P < 0.001) between the two groups (201 ± 3 v. 224 ± 4 g/day, respectively). There was no difference (P = 0.16) in pre-weaning ADG between the sexes (data not shown), but males (6.54 ± 0.07 kg) remained heavier (P = 0.044) than females (6.40 ± 0.08 kg) at weaning. The subgroup model demonstrated that there were no differences in BWT, ADG, WWT or 10WT between the GG and GM pigs or the SS and SM pigs (P ≥ 0.05) before penning treatments were applied (Table 3).
Least squares means (±SEM) and main treatment effects from the linear mixed models analysis for pig performance traits and carcass characteristics using the birth group model (gilt progeny (GP) and sow progeny (SP))

BWT = birth weight; ADG = average daily gain; WWT = weaning weight (3 weeks; 23.7 ± 0.1 days of age); 10WT = 10 week weight (72.7 ± 0.1 days of age); SWT = sale weight (146.7 ± 0.1 days of age); HCW = hot carcass weight (slaughter age = 152.2 ± 0.1 days of age); tmt = dam parity treatment; FAT = carcass fat depth measured at the P2 site; DP = dressing percentage: (HCW/SWT) × 100.
a Fixed effects model (x 1 = birth group treatment + sex) with interactions, random effects and covariates, included if they made a significant (P < 0.05) contribution to the model. b Represents a modified DP calculated based on HCW measured on day of slaughter and SWT measured approximately 6 days prior to slaughter.
Least squares means (±SEM) and between treatment pairwise comparisons from the linear mixed models analysis for individual pig performance traits and carcass characteristics using the subgroup model

BWT=birth weight; ADG=average daily gain; WWT=weaning weight (3 weeks; 23.7 ± 0.1 days of age); 10WT=10 week weight (72.7 ± 0.1 days of age); SWT=sale weight (146.7 ± 0.1 days of age); WS=wean to sale; BS=birth to sale; HCW=hot carcass weight (slaughter age = 152.2 ± 0.1 days of age); FAT=carcass fat depth measured at the P2 site; DP=dressing percentage: (HCW/SWT) × 100; GG=gilt progeny (GP) penned together; SS=sow progeny (SP) penned together; GM=GP mixed with SP; SM=SP mixed with GP.
a Contrast P values obtained after a Bonferroni adjustment for multiple comparisons. b Carcass fat (FAT) corrected for HCW as a covariate. c Represents a modified DP calculated based on HCW measured on day of slaughter and SWT measured approximately 6 days prior to slaughter.
See Table 2 for final models.
Weaner period
Gilt progeny grew 55 g/day slower (P < 0.001) in the weaner period than SP (Table 2), and females (492 ± 5 g/day) grew faster (P < 0.001) than males (462 ± 5 g/day). When adjusting for WWT, the difference in ADG in the weaner period (from weaning to 10 weeks of age) between GP and SP remained different (461 ± 5 v. 492 ± 6 g/day, respectively; P < 0.001). Gilt progeny were lighter (P < 0.001) than SP at 10 weeks of age (10WT) both with (29.0 ± 0.3 v. 30.7 ± 0.3 kg, respectively, Figure 2) and without (Table 2) fitting WWT as a covariate. Females (30.5 ± 0.3 kg) were heavier (P < 0.001) than males (29.2 ± 0.3 kg) at 10 weeks of age. In the rearing group model, GG pens had a lighter 10WT (P < 0.001) than SS and M pens (Table 4). There was no significant treatment × sex interaction for 10WT (data not shown).
Difference in live weight (in kg) between gilt progeny and sow progeny from weaning (3 weeks of age) to sale (21 weeks of age). Results are shown for the model with no correction and the model with a correction for weaning weight fitted as a covariate.

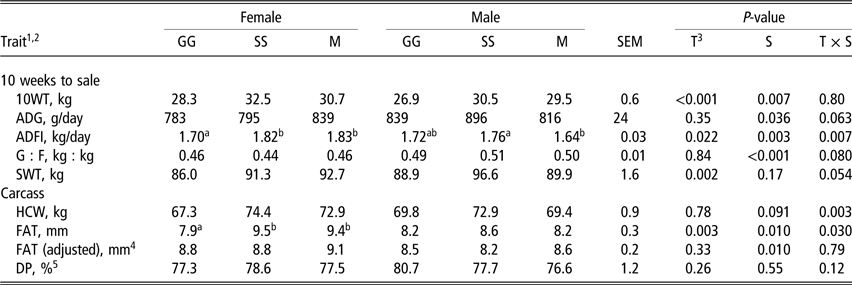
Least squares means (±SEM) of the penning treatment (T) and sex (S) interaction (T × S) from the rearing group model analysis of average pig performance traits and carcass characteristics in the grower–finisher period, with pen as the experimental unit

1 10WT = average pig weight at 10 weeks of age, fitted as a covariate in the model; ADG = average daily gain; ADFI = average daily feed intake; G : F = gain to feed ratio; SWT = average pig weight at sale (approximately 21 weeks of age); HCW = hot carcass weight; FAT = carcass fat depth measured at the P2 site; DP = dressing percentage: (HCW/SWT) × 100.
2 The fixed factors model used was treatment (T) + sex (S) + treatment × sex (T × S), plus any covariates as appropriate.
3 Treatment groups were: GG = gilt progeny separately penned (n = 7); SS=sow progeny separately penned (n = 7); M = gilt progeny and sow progeny mixed in a common pen (n = 6).
4 Carcass fat corrected for HCW as a covariate.
5 Represents a modified DP calculated based on HCW measured on day of slaughter and SWT measured approximately 6 days prior to slaughter.
a,bMeans within a rows and sexes with different superscripts significantly differ (P < 0.05) after a Bonferroni adjustment for multiple comparisons.
Grower–finisher period
In the birth group model, GP grew slower (P = 0.012, Table 2) than SP, and males (852 ± 6 g/day) grew faster (P < 0.001) than females (812 ± 6 g/day). Differences between GP and SP disappeared (P = 0.14) when adjusting for WWT (824 ± 6 v. 838 ± 6 g/day, respectively, Figure 2). As a result, GP were 4.2 kg lighter (P = 0.001) at sale than SP, and tended to be lighter (P = 0.063) when adjusting for WWT (90.2 ± 0.7 v. 92.3 ± 0.7 kg, respectively, Figure 2). Females (90.5 ± 0.7 kg) had a lower (P = 0.014) SWT than males (92.3 ± 0.6 kg). While the treatment × sex interaction tended to be significant in the rearing group model with pen as the experimental unit for both the ADG in this period (P = 0.063) and for SWT (P = 0.054, Table 4), this was not the case with individual pig as the experimental unit in the birth group, rearing group or subgroup models where common litter effects could be accounted for in the model. Consequently, these interactive effects were not investigated further. The subgroup model analysis showed that GG pigs tended (P = 0.076) to grow slower than GM pigs during this period and had a lighter SWT (P = 0.016, Table 3). Conversely, SS pigs grew faster (P = 0.012) than SM pigs during this period but there was no difference (P = 0.19) in SWT between these pigs (Table 3).
Pen feed efficiency
There was a treatment × sex interaction for ADFI (P = 0.007) such that within male pens, M pens had a lower ADFI than SS pens and GG pens were intermediate, whereas within female pens, ADFI of pigs in M pens was similar to that of SS pens, both of which had higher ADFI than GG pens (Table 4). There was no effect (P = 0.84) of dam parity on G : F, with similar efficiency between GG (0.48 ± 0.01 kg : kg), SS (0.47 ± 0.01 kg : kg) and M pens (0.47 ± 0.01 kg : kg). While there tended to be a treatment × sex interaction for G : F (P = 0.080), there were no significant pairwise differences between individual means as a result of the simple effects analysis (P > 0.10, Table 4).
Lifetime performance
Within the birth group model, GP grew slower (P < 0.05) than SP from weaning to sale and from birth to sale (Table 2), and this remained the case (P < 0.05) when corrected for BW at the start of that period (BWT or WWT, data not shown). Males grew faster than females both from birth to sale (P = 0.018) and from weaning to sale (P = 0.020, data not shown). Mixed GP (GM) grew faster (P = 0.008) than GG pigs both from weaning to sale and from birth to sale (P = 0.014, Table 3) in the subgroup model analysis, but there was no difference (P ≥ 0.05) in these growth rates between SS and SM pigs (Table 3).
Carcass characteristics
There was a treatment × sex interaction for HCW in the birth group model, both with (P < 0.001) and without (P = 0.002) WWT as a covariate. The difference in HCW between GP and SP was all attributed to female progeny (69.0 ± 0.7 v. 73.9 ± 0.8 kg, respectively; P < 0.001) as opposed to male progeny (70.5 ± 0.7 v. 72.3 ± 0.7 kg, respectively; P = 0.10) and this held true when adjusting for WWT (data not shown). The treatment × sex interaction was significant for HCW in the rearing group treatment model (P = 0.003, Table 4) and the subgroup model (P < 0.001). However, there were no significant (P ≥ 0.10) pairwise differences between groups of males or females in the rearing group model (Table 4). In the subgroup model, GG females had lower (P < 0.001) HCW than GM females, but there was no difference between SS and SM females (P = 1.00), and no difference between GG and GM or SS and SM males (P ≥ 0.05, Figure 3a).
(a) Hot carcass weight (HCW, kg) and (b) P2 carcass fat depth corrected for HCW (adj. FAT, mm) between male and female gilt progeny (GP) separately penned (GG), gilt progeny mixed with sow progeny in a common pen (GM), sow progeny separately penned (SS) and sow progeny mixed with gilt progeny in a common pen (SM) from the results of the treatment × sex interaction of the subgroup linear mixed model analysis. ** indicates a significant difference (P < 0.05) and * indicates a trend (P < 0.10) between separate and mixed GP treatments (GG v. GM) from the simple effects analysis.

Gilt progeny had significantly lower FAT than SP in the birth group model, but not when corrected for HCW (P = 0.15, Table 2). There was a treatment × sex interaction (P = 0.003) on FAT when it was corrected for HCW in the birth group model, and female SP had a higher FAT (P = 0.01) than female GP (9.2 ± 0.2 v. 8.5 ± 0.1 mm, respectively). However, there was no difference between SP and GP in the males (8.4 ± 0.1 v. 8.5 ± 0.1 mm, respectively; P = 0.10). In the rearing group model, female GG pens were lighter (P < 0.05) than other female pens (SS and M), but there were no differences (P ≥ 0.10) within the males (interaction P = 0.030, Table 4). However, when adjusting for HCW, there was no interactive effect (P = 0.79) of treatment × sex on FAT in the rearing group model (Table 4). Results from the subgroup analysis showed that there were no differences in FAT corrected for HCW (P ≥ 0.05) within the males or within female SP, but female GM pigs tended (P = 0.055) to have higher FAT than female GG pigs at a similar HCW (interaction P = 0.022, Figure 3b). A similar result was obtained for FAT without the correction for HCW (data not shown).
There was a treatment × sex interaction (P < 0.001) on DP in the birth group model, being higher (P < 0.001) in GP than SP within males (78.4 v. 76.0%, respectively) and higher (P < 0.001) in SP than GP within females (78.3 v. 80.4%, respectively). The treatment × sex interaction effect was not significant in the rearing group model (P = 0.12, Table 4). In the subgroup model (interaction P < 0.001), within females, DP was similar between GG (78.2 ± 0.3%) and GM pigs (78.6 ± 0.4%) but SS pigs (81.1 ± 0.3%) had a higher (P < 0.001) DP than SM pigs (78.8 ± 0.5%). Conversely, this advantage was within GP in males, where DP was similar (P = 0.19) between SS (75.8 ± 0.3%) and SM pigs (76.8 ± 0.4%) but GG pigs (79.0 ± 0.3%) had a higher (P < 0.001) DP than GM pigs (77.0 ± 0.4%).
Discussion
Gilts and their progeny are an unavoidable component of every pig breeding enterprise, with replacement rates remaining high (>50% in Australia; Australian Pork Limited, 2013) despite efforts to improve sow longevity. Gilts have had less exposure to pathogens throughout their lifetime than older parity sows and therefore less opportunity to augment their own immunity before they farrow their first litter, which can impact negatively the transfer of passive immunity to their piglets (Klobasa et al., Reference Klobasa, Butler, Werhahn and Habe1986, Miller et al., Reference Miller, Collins, Emery, Begg, Smits and Holyoake2012). Piglets that do not receive adequate immunity from their dam in the early post-natal period have a higher risk of mortality and show compromised growth during lactation and beyond (Rooke and Bland, Reference Rooke and Bland2002). Additionally, lower feed intakes and higher energy demands for tissue deposition in gilts compared to multiparous sows may impact on udder development and milk production (Sinclair et al., Reference Sinclair, Edwards, Hoste, McCartney and Fowler1996, Pluske et al., Reference Pluske, Williams, Zak, Clowes, Cegielski and Aherne1998, Balzani et al., Reference Balzani, Cordell, Sutcliffe and Edwards2016). Furthermore, lower maternal, uterine and placental size (Nielsen et al., Reference Nielsen, Kittok and Kochera Kirby1995, Gluckman and Hanson, Reference Gluckman and Hanson2004) may restrict the growth of their progeny in utero (Gatford et al., Reference Gatford, De Blasio, Roberts, Nottle, Kind, van Wettere, Smits and Owens2009). In the present study, therefore, it is not surprising that we observed that GP were significantly lighter at birth and weaning than SP, in agreement with published literature (Miller et al., Reference Miller, Collins, Emery, Begg, Smits and Holyoake2012, Carney-Hinkle et al., Reference Carney-Hinkle, Tran, Bundy, Moreno, Miller and Burkey2013, Craig et al., Reference Craig, Collins, Athorn, Dunshea and Pluske2017b).
Low birth weight has been correlated with low weaning weight (Quiniou et al., Reference Quiniou, Dagorn and Gaudré2002), and this is reinforced by our current finding and our previous study (Craig et al., Reference Craig, Collins, Bunter, Cottrell, Dunshea and Pluske2017a) that weaning weight was highly related to birth weight. This may be intuitive, as smaller born pigs take longer to reach the udder and first suckle (Herpin et al., Reference Herpin, Le Dividich and Van Os1992), have lower colostrum and milk intake (Theil et al., Reference Theil, Nielsen, Sørensen, Lauridsen, Bach Knudsen, Kjeldsen, Poulsen and Jensen2012) and lack the thermoregulatory capacity of their larger counterparts (Le Dividich and Noblet, Reference Le Dividich and Noblet1981). However and after accounting for differences in birth weight, the GP were still lighter than SP at weaning, indicating that birth weight alone did not account for the differences in subsequent growth between GP and SP, most likely reflecting the influence of milk production differences between gilts and sows in lactation. It should be noted that suckled litter size (post-fostering) was unknown in this study and therefore was not able to be included in the analysis of weaning weight but may have had some impact on the results reported here.
Slower post-weaning growth in GP compared to SP from the current study is also in agreement with others (Craig et al., Reference Craig, Collins, Bunter, Cottrell, Dunshea and Pluske2017a, Hermesch et al., Reference Hermesch, McKenna, Bauer and Sales2017), and is unsurprising given that birth and weaning weight are generally considered the main determinants of post-weaning growth up to slaughter (Mahan, Reference Mahan1993, Quiniou et al., Reference Quiniou, Dagorn and Gaudré2002, Dunshea et al., Reference Dunshea, Kerton, Cranwell, Campbell, Mullan, King, Power and Pluske2003). In the same way, the compromised growth in the grower–finisher period and carcass weight in GP in the current study and our previous work (Craig et al., Reference Craig, Collins, Bunter, Cottrell, Dunshea and Pluske2017a) confirm observations from others that GP grow slower and take longer to reach saleable weight than SP (Schinckel et al., Reference Schinckel, Einstein, Steward, Schwab and Olynk2010, Hermesch et al., Reference Hermesch, McKenna, Bauer and Sales2017). This again is often attributed to weight at birth and weaning (Kavanagh et al., Reference Kavanagh, Lynch, Caffrey, Henry, Cranwell and Cranwell1997, Quiniou et al., Reference Quiniou, Dagorn and Gaudré2002), which is reinforced by the results of the current study. In addition, underdevelopment of GP at times of dietary changes, such as a reduction in SID lysine from the weaner to the grower diet at 10 weeks of age, may limit their growth in these periods. Focusing on management to improve growth of GP in the pre-weaning period may therefore be the most effective way to increase the productivity of these animals through to slaughter. It was unfortunate that collection of pre- and post-weaning mortality data was incomplete for the current study, as past studies are equivocal regarding differences in mortality rates between GP and SP, and at what stages of production these occur (Miller et al., Reference Miller, Collins, Emery, Begg, Smits and Holyoake2012, Carney-Hinkle et al., Reference Carney-Hinkle, Tran, Bundy, Moreno, Miller and Burkey2013, Craig et al., Reference Craig, Collins, Bunter, Cottrell, Dunshea and Pluske2017a). In addition to a lower average birth weight, the distribution of piglets between different birth weight classes (i.e. light, average or heavy) in gilt and sow litters may have a significant impact on lifetime growth performance and mortality differences between GP and SP. In the current study, similar proportions of GP and SP were found for piglets born ≤800 g, between 800 g and 1200 kg and >1200 g (data not shown). However, how these categories are defined differs greatly between authors (Milligan et al., Reference Milligan, Dewey and de Grau2002, Muns et al., Reference Muns, Manteca and Gasa2015) and the current study was not designed to assess the impact of birth weight categories on GP and SP performance.
It seems within-site segregation of GP and SP generally poses no benefit for either group when carried out from weaning (Craig et al., Reference Craig, Collins, Bunter, Cottrell, Dunshea and Pluske2017a). This concept was further investigated in the current study, with GP and SP segregation in the grower–finisher period yielding similar results to our previous study (Craig et al., Reference Craig, Collins, Bunter, Cottrell, Dunshea and Pluske2017a) where GP had higher growth rates in mixed pens than they did in segregated pens, which might be due to a reduction in continued exposure to pathogens in the grower–finisher period for GM progeny by mixing with more immuno-competent and robust SP (Friendship and O’Sullivan, Reference Friendship, O’sullivan and Farmer2015). Further evidence for this was seen in the current study where SP performed better in segregated pens than mixed pens similar to our previous study (Craig et al., Reference Craig, Collins, Bunter, Cottrell, Dunshea and Pluske2017a). However, the effect in our previous study was non-significant which may have been due to heavier pigs being inadvertently allocated to the SM treatment resulting in a reduction in statistical power. It was initially thought that segregation in this later period would improve the performance of both GP and SP as it would potentially reduce the transmission of respiratory disease causing pathogens that GP may be more susceptible compared to SP (McOrist et al., Reference McOrist, Bowles and Blackall2009, Brean et al., Reference Brean, Abraham, Hebart and Kirkwood2016, Craig et al., Reference Craig, Collins, Bunter, Cottrell, Dunshea and Pluske2017a). However, several factors may have contributed to the discrepancies between the results of our two studies, including herd health status; genetics; management procedures such as timing of immunocastration and sale of pigs; season; and/or nutrition. When segregating GP and SP in the grower–finisher stage after a period of prior mixing from weaning to 10 weeks of age, pathogen exposure may have already occurred in this earlier period in which the two progeny groups were already mixed, which may have negated any beneficial effects of segregation at 10 weeks of age. However, this was shown not to be the case in our previous study (Craig et al., Reference Craig, Collins, Bunter, Cottrell, Dunshea and Pluske2017a), where similar results to the current study were observed.
The interactions between progeny group and sex seen in the current study are contrary to our earlier observations (Craig et al., Reference Craig, Collins, Bunter, Cottrell, Dunshea and Pluske2017a) where segregation and mixing effects were consistent across male and female progeny. In the current study, growth differences between male and female GP and SP were not present in the subgroup model (or the rearing group model) accounting for common litter effects, which is unsurprising as reproductive and behavioural differences between sexes in later phases can be influenced by sex ratios in utero (Seyfang et al., Reference Seyfang, Plush, Kirkwood, Tilbrook and Ralph2018). We found a higher HCW in GM than GG females but no difference in males. In this context, female pigs appear to handle mixing and other stressors better than male pigs (Dunshea, Reference Dunshea2001, Pluske et al., Reference Pluske, Kerton, Cranwell, Campbell, Mullan, King, Power, Pierzynowski, Westrom and Rippe2003, Rault et al., Reference Rault, Ferrari, Pluske and Dunshea2015), and this result may be due to increased fighting in male GM pigs resulting in increased injuries and carcass trim at slaughter. This is further reflected in the lower DP in GM males compared to GG males in the current study. Sex effects seen in the current study may also be artefacts of the effect of the timing of immunocastration in commercial production. This may have a profound effect on the metabolism of fat in male GP and SP, for example (Dunshea and D’Souza, Reference Dunshea, D’souza and Paterson2003). This may therefore affect GP and SP differently, especially considering immunocastration is usually performed on all animals at a certain age, regardless of their weight, and that GP are significantly lighter than SP at any given age. Given that we did not find these same interactions with sex in our previous study (Craig et al., Reference Craig, Collins, Bunter, Cottrell, Dunshea and Pluske2017a), where immunocastration occurred at 13 and 20 weeks of age compared to 15 and 19 weeks of age in the current study, this may indicate that protein deposition and fat metabolism are impacted upon differently in male GP and SP depending on the timing of castration. It is therefore of interest to further investigate these differences, and it would also be important to evaluate the differences between GP and SP within entire males, or males that had been surgically castrated at a young age. In conclusion, the present study confirms that GP are born, weaned and sold lighter than SP, and that the pre-weaning period is a vital period determining later growth differences. Therefore, it is recommended that efforts to improve the growth and survival of GP are focused in this early stage. Segregation of previously mixed GP and SP at approximately 10 weeks of age throughout the grower–finisher period is difficult in many production systems and hence not recommended, as progeny groups are affected differently and this is dependent on sex of the animal and the performance indicators considered.
Acknowledgements
The authors gratefully acknowledge the technical research team and farm staff from SunPork Farms (Dalby, Australia) for their assistance in the data collection for this study. This research was funded by Australian Pork Limited (APL, Canberra, Australia), and J. Craig was supported by an Australian Postgraduate Award (PhD) from Murdoch University (Perth, Australia).
Jessica Renee Craig 0000-0002-0707-6492
Declaration of interest
The authors declare no conflict of interest.
Ethics statement
All experimental procedures carried out were approved by the CHM Alliance Pty. Ltd. Animal Ethics Committee (application no. CHM PP 73/15) and the Murdoch University Ethics Committee (protocol no. N2778/15) in accordance with the Australian Code for the Care and Use of Animals for Scientific Purposes (National Health and Medical Research Council, 2013).
Software and data repository resources
None of the data were deposited in an official repository.