1 Introduction
Fluid flow in annular geometries is prevalent, found in a range of apparatuses from oil wells to surgical tools. Annular flows between a co-axial rod and outer cylinder motivate fundamental design questions, such as the following:
(i) How to position the inner cylindrical rod to maximise axial flow?
(ii) How will the inner rod move and rotate if free to do so?
(iii) How do the answers to 1 and 2 depend on the cylinders’ cross-sectional shapes?
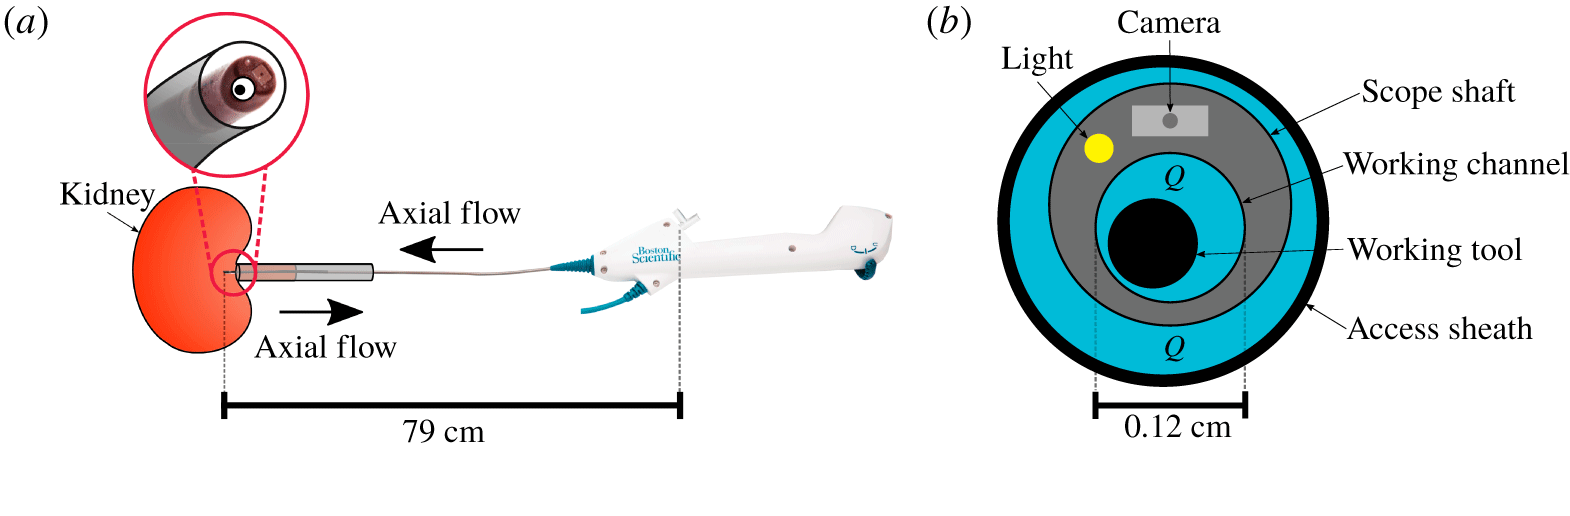
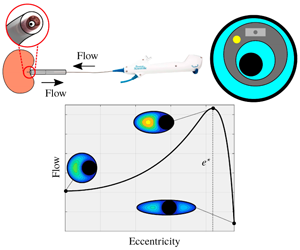
A specific medical application of our work is found in a minimally invasive surgical procedure for the removal of kidney stones, ureterorenoscopy. This involves the insertion of long fibres, working tools, used to destroy or capture stones, through a long cylindrical working channel along which there is an axially flowing saline solution. A minuscule camera in the scope tip allows the surgeon to see inside the patient’s kidney and the axially flowing fluid is required to clear the field of view and to open up the ureter, see figure 1. The working channel lies within the cylindrical shaft of a ureteroscope, and another outer cylinder, an access sheath, surrounds the scope itself, allowing fluid to flow back out of the kidney. Minimising the flow resistance posed by the working tools can increase flow through the working channel and subsequent surgical accuracy by improving visibility within the kidney (Williams et al. Reference Williams, Turney, Rauniyar, Harrah, Waters and Moulton2019a). Minimising the flow resistance through the access sheath leads to lower kidney pressures during ureterorenoscopy (Oratis et al. Reference Oratis, Subasic, Hernandez, Bird and Eisner2018; Williams et al. Reference Williams, Waters, Moulton, Rouse and Turney2019b) which is desirable as high pressures have been linked to post-operative complications, such as sepsis (Wilson & Preminger Reference Wilson and Preminger1990). This application in particular motivates us to address questions of flow optimality in the sense of achieving the maximum flow rate for a prescribed axial pressure drop and fixed cross-sectional area available for fluid flow. The possible design of elliptical access sheaths, working channels and working tools has been motivated by the ureteral opening resembling an ellipse (Bergman Reference Bergman1981) and channels with elliptical cross-sections being relatively easy to manufacture. Thus, we restrict attention to cylinders with elliptical cross-sections. When designing an optimal device the ideal scenario would be to place the inner cylindrical rod in the position that minimises axial flow resistance. A key consideration is whether the surrounding fluid would then resist changes to the inner rod position, or whether the device must be designed to constrain the inner rod to the position that minimises axial flow resistance.
A photograph of an isolated Boston Scientific ureteroscope (a) with the tip of the scope circled and a zoomed-in schematic provided of the scope tip (b). The scope lies within an access sheath, and a working tool sits inside the working channel. A camera and a light are embedded in the scope wall. Dimensions of the scope shaft and working channel are labelled.

Our modelling framework comprises a solid cylindrical rod of mass  $m$ and effective radius
 $R_{i}$, rotating about, and moving in a direction perpendicular to, its longitudinal axis, within a coaxial outer cylinder of equal length,
 $L$, and comparable radius,
 $R_{o}$, filled with an axially flowing viscous fluid of typical flow rate
 $Q$, density
 $\unicode[STIX]{x1D70C}$ and dynamic viscosity
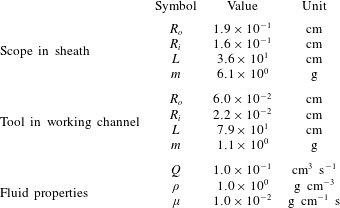
 $\unicode[STIX]{x1D707}$. We take the cross-sections of the rod and outer cylinder to be ellipses of varying eccentricities; this is both appropriate for our ureterorenoscopy application and allows us to investigate the effects of non-axisymmetry. Typical parameter values for ureteroscopy irrigation, which will guide our analysis here, are listed in table 1. Defining the radius-to-length ratio of the rod as
 $\unicode[STIX]{x1D716}=R_{i}/L$ and the Reynolds number of the flow as
 $Re=QL\unicode[STIX]{x1D70C}/\unicode[STIX]{x1D707}R_{i}^{2}$, the key parameters governing the behaviour of the fluid and the inner rod are
 $\unicode[STIX]{x1D716}^{2}$,
 $\unicode[STIX]{x1D716}^{2}Re$ and the ratio of fluid-to-rod mass multiplied by the reduced Reynolds number,
 $\unicode[STIX]{x1D6FC}^{-1}=(m/\unicode[STIX]{x1D70C}R_{i}^{2}L)\unicode[STIX]{x1D716}^{2}Re$. Using typical values presented in table 1, we find
 $\unicode[STIX]{x1D716}^{2}=O(10^{-5}{-}10^{-6})$,
 $\unicode[STIX]{x1D716}^{2}Re=O(10^{-1})$ and
 $\unicode[STIX]{x1D6FC}^{-1}=(10^{0})$. These suggest that fluid inertia is negligible while rod inertia is not. In this regime, we show that the axial fluid flow through the annular region and the cross-sectional flows induced by the perpendicular movement and rotation of the rod can be decoupled into axial Poiseuille flow and Stokes flow in the cross-section. The motion of the rod is determined by conservation of linear and angular momentum, incorporating the hydrodynamic resistance exerted by the surrounding viscous fluid. Within this set-up, our objective is to investigate the nature of the resistance, both the cross-sectional resistance to the motion of the inner rod and resistance to the axial flow, in terms of the geometry of the two cylinders. To illustrate characteristic features of the flow and to investigate geometric effects, we will focus primarily on three reduced parameter spaces, namely:
Table of typical parameter values for ureteroscopy irrigation. For a scope in a sheath,  $R_{o}$ is a typical effective radius of the access sheath (
 $11/13$ F Navigator, Boston Scientific; 1 F corresponds to three times the diameter in millimetres) and
 $R_{i}$ and
 $m$ are a typical effective radius of the scope shaft and its mass, respectively (LithoVue, Boston Scientific). For a tool in a working channel,
 $R_{o}$ is a typical effective radius of the working channel (LithoVue, Boston Scientific) and
 $R_{i}$ and
 $m$ are a typical effective radius of a working tool and its mass, respectively (ZeroTip 3.0 F, Boston Scientific). Fluid properties are those of water, and the flow rate
 $Q$ follows typical bench-top experiments of flow through a working channel (Williams et al. Reference Williams, Turney, Rauniyar, Harrah, Waters and Moulton2019a).

(i) a circular rod inside an elliptical cylinder;
(ii) an elliptical rod inside a circular cylinder; and
(iii) an elliptical rod inside an elliptical cylinder of the same eccentricity and orientation.
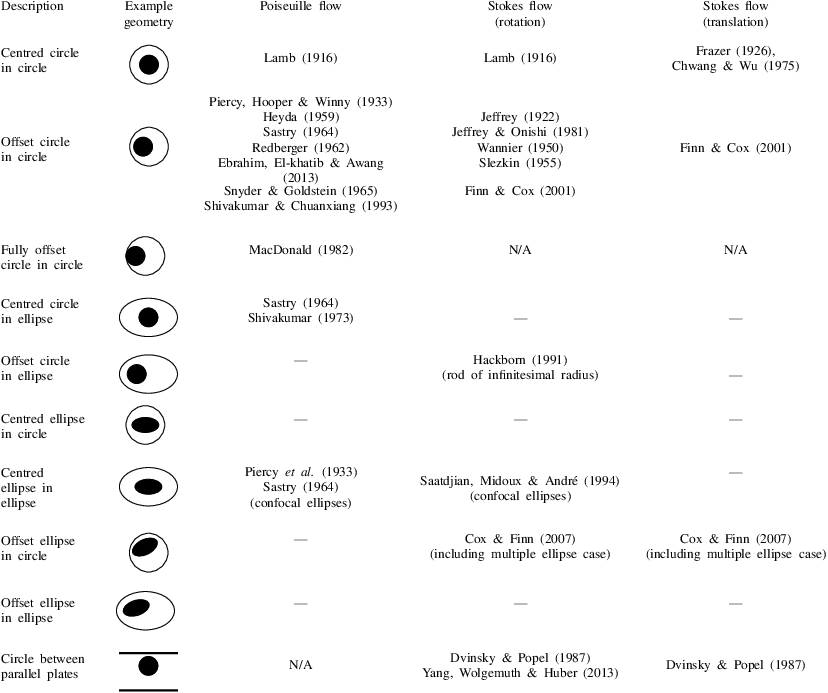
We also briefly consider the generic ellipse in an ellipse case when determining the optimal geometry to minimise axial flow resistance. The literature on viscous-dominated fluid flows through annular pipes is vast. A description of relevant literature is given below and summarised in table 2. As our primary concern is the effect of cross-sectional geometry on resistance, we have grouped references by geometry in table 2, and have further distinguished which previous works have studied axial versus cross-sectional flow and motion of the inner rod.
Summary of existing literature for relevant geometries.

1.1 Axial flow resistance
An analytical solution exists for the steady, fully developed (Poiseuille) flow of a viscous fluid through an annular region formed by concentric circles (Lamb Reference Lamb1916). By employing conformal maps, analytical solutions have also been obtained in a domain bounded by non-concentric circles (Piercy et al. Reference Piercy, Hooper and Winny1933; Heyda Reference Heyda1959; Sastry Reference Sastry1964; MacDonald Reference MacDonald1982; Shivakumar & Chuanxiang Reference Shivakumar and Chuanxiang1993). Numerical solutions for the flow in these domains, together with the corresponding wall shear stress distributions, have also been obtained (Redberger Reference Redberger1962; Snyder & Goldstein Reference Snyder and Goldstein1965; Ebrahim et al. Reference Ebrahim, El-khatib and Awang2013). These solutions demonstrate that the distance between the centres of the bounding circles significantly affects the velocity distribution, and that the total flux for fixed pressure drop increases with this metric. Analytical solutions for steady, viscous flow through annular ducts bounded by confocal ellipses (Piercy et al. Reference Piercy, Hooper and Winny1933; Sastry Reference Sastry1964), and externally by an ellipse and internally by a circle (with coincident centres) have also been determined by employing conformal maps (Sastry Reference Sastry1964), although the dependence of the flow rate on the geometry of the domain was not discussed. Shivakumar & Chuanxiang (Reference Shivakumar and Chuanxiang1993) also considered a region bounded internally by a circle and externally by a concentric ellipse and noted a flux enhancement compared to cross-sections bounded by two concentric circles or two confocal ellipses of the same cross-sectional area. Flow through an annular region bounded by non-concentric ellipses or by an ellipse in a circle, which form key components of our analysis, has not been previously considered (see table 2).
1.2 Cross-sectional flow resistance
Two-dimensional Stokes flow between two circular cylinders has been well studied (Jeffrey Reference Jeffrey1922; Frazer Reference Frazer1926; Wannier Reference Wannier1950; Slezkin Reference Slezkin1955; Chwang & Wu Reference Chwang and Wu1975; Jeffrey & Onishi Reference Jeffrey and Onishi1981). The dynamics of a viscous fluid confined in the gap between rotating cylinders, i.e. Taylor–Couette flow, has many mechanical applications, e.g. to the lubrication of rotary bearing systems. Stokes flow due to a line rotlet (a rotating circular cylinder of infinitesimal radius) inside an elliptic cylinder was solved analytically by Hackborn (Reference Hackborn1991). The results focussed on the resulting flow structure and it was found that the number of eddies in the cross-section produced by the line rotlet increased approximately linearly with the ratio of length to width of the outer elliptical cross-section. Hackborn (Reference Hackborn1991) postulated that the flow features generated by a line rotlet inside a fixed elliptic cylinder are expected to persist when the line rotlet is replaced by a rotating circular cylinder. Stokes flow between rotating confocal ellipses has also been considered (Saatdjian et al. Reference Saatdjian, Midoux and André1994), and an analytical solution for the stream function obtained using elliptical cylindrical coordinates. It was shown that for counter-rotating ellipses, two hyperbolic points appear in the flow.
As the elliptical eccentricity of the outer cylinder cross-section tends to 1, the domain approximates one of parallel plates. The motion of a rod of circular cross-section rotating and translating in Stokes flow between parallel plates has been studied numerically (Dvinsky & Popel Reference Dvinsky and Popel1987). The authors computed the position between the centreline and the wall where the rod experienced the minimum translational drag. It was also found that the torque on a cylinder rotating between parallel plates is minimised when the cylinder is centred between the two walls. An asymptotic solution (for small gap between the cylinder and the walls compared to the cylinder radius) for a circular cylinder rotating between parallel plates was obtained by Yang et al. (Reference Yang, Wolgemuth and Huber2013). It was shown that if the cylinder is centred between the two plates, rotation will only induce an opposing torque, whereas if the cylinder is offset from the centreline, there is an additional force parallel to the walls.
Two-dimensional Stokes flow in a bounded annular domain with a translating and rotating inner rod has also been considered. Finn & Cox (Reference Finn and Cox2001) presented an analytical solution for the stream function for such a flow when both the inner rod and outer cylinder have circular cross-sections. The biharmonic equation for the stream function was solved with complex variable methods. The motion of the cylindrical rod was prescribed as a function of time, and the energy required to maintain the system in equilibrium was determined. It was shown that the power input depends upon the position of the rod and the prescribed motion. As the two cylinders approach each other, the power input required to maintain all motions diverges. Cox & Finn (Reference Cox and Finn2007) considered multiple rods with elliptical cross-sections moving inside a circular cylinder via numerical methods. In both Finn & Cox (Reference Finn and Cox2001) and Cox & Finn (Reference Cox and Finn2007) the fluid flow is quasi-static, with temporal variation in the velocity field only occurring due to changes in domain geometry.
While the above works demonstrate the strong effect of geometry on rod motion, to our knowledge the effect of geometry on an elliptical cylindrical rod translating and rotating inside an elliptical cylinder has not been previously investigated. Due to the linearity of Stokes equations, the velocity field resulting from any prescribed translational motion (in any bounded or unbounded two or three-dimensional domain) can be calculated by considering component motions directed along orthogonal axes and summing the component solutions. The velocity field resulting from prescribed rotational motion in these domains can also be considered separately, and for combined translational and rotational motions the solution is obtained by adding the relative contributions. By implementing the Lorentz reciprocal theorem, it can be shown that the magnitudes of the hydrodynamic forces and torques on a particle moving in Stokes flow vary linearly with the imposed translational and rotational velocities, respectively, and these relationships can be captured by the coefficients of two symmetric resistance tensors (Brenner Reference Brenner1962c, Reference Brenner1963; Hinch Reference Hinch1972). An additional tensor characterises the interactions between translation and rotation that can occur when particle or domain symmetry is broken (Brenner Reference Brenner1963; Hinch Reference Hinch1972). The general theory for the effect of finite domain boundaries on the resistance tensors has been considered for the case where the particle is small in comparison to its distance from the boundary (Brenner Reference Brenner1962a,Reference Brennerb).
In two dimensions, the three resistance tensors can be formulated as a single resistance matrix. To illustrate this, consider a Cartesian coordinate system with orthogonal directions  $\boldsymbol{i}$,
 $\boldsymbol{j}$ and
 $\boldsymbol{k}$. For a given prescribed translational velocity,
 $\text{d}x/\text{d}t\hspace{2.22198pt}\boldsymbol{i}+\text{d}y/\text{d}t\hspace{2.22198pt}\boldsymbol{j}$, and a prescribed angular velocity
 $\text{d}\unicode[STIX]{x1D703}/\text{d}t\hspace{2.22198pt}\boldsymbol{k}$, the resistance matrix provides the hydrodynamic forces
 $F_{x}\boldsymbol{i}$,
 $F_{y}\,\boldsymbol{j}$ and hydrodynamic torque
 $\unicode[STIX]{x1D70F}_{z}\boldsymbol{k}$ via
 $$\begin{eqnarray}\left[\begin{array}{@{}c@{}}F_{x}\\ F_{y}\\ \unicode[STIX]{x1D70F}_{z}\end{array}\right]=-\left[\begin{array}{@{}ccc@{}}\unicode[STIX]{x1D612}_{xx} & \unicode[STIX]{x1D612}_{xy} & \unicode[STIX]{x1D60A}_{x}\\ \unicode[STIX]{x1D612}_{xy} & \unicode[STIX]{x1D612}_{yy} & \unicode[STIX]{x1D60A}_{y}\\ \unicode[STIX]{x1D60A}_{x} & \unicode[STIX]{x1D60A}_{y} & \unicode[STIX]{x1D608}_{zz}\end{array}\right]\left[\begin{array}{@{}c@{}}\text{d}x/\text{d}t\\ \text{d}y/\text{d}t\\ \text{d}\unicode[STIX]{x1D703}/\text{d}t\end{array}\right].\end{eqnarray}$$
The scalar matrix coefficients  $\unicode[STIX]{x1D612}_{ij}$ for
 $i,j=x,y$ in equation (1.1) characterise the resistive force in the
 $i$-direction due to motion in the
 $j$-direction, and equivalently, as the matrix is symmetric, the resistance in the
 $j$-direction due to motion in the
 $i$-direction. Coefficient
 $\unicode[STIX]{x1D608}_{zz}$ provides the linear relationship between a rotational motion in the cross-section and the resistive torque. Finally, coefficients
 $\unicode[STIX]{x1D60A}_{x}$ and
 $C_{y}$ describe the coupling between translational and rotational motions, i.e. the rotation induced by translation (and vice versa). The coefficients are all functions of the geometry of the domain (and scale linearly with viscosity).
When considering translation without rotation, equation (1.1) reduces to
 $$\begin{eqnarray}\left[\begin{array}{@{}c@{}}F_{x}\\ F_{y}\end{array}\right]=-\left[\begin{array}{@{}cc@{}}\unicode[STIX]{x1D612}_{xx} & \unicode[STIX]{x1D612}_{xy}\\ \unicode[STIX]{x1D612}_{xy} & \unicode[STIX]{x1D612}_{yy}\end{array}\right]\left[\begin{array}{@{}c@{}}\text{d}x/\text{d}t\\ \text{d}y/\text{d}t\end{array}\right].\end{eqnarray}$$
The eigenvectors and corresponding eigenvalues of the matrix in (1.2) are the directions and magnitudes of the minimum and maximum resistance, respectively. Using principles of energy dissipation, it can be shown that the eigenvalues must be positive. This is proved for a three-dimensional particle of arbitrary shape moving in Stokes flow in Brenner (Reference Brenner1962c).
As a simple example of the resistance matrix for two-dimensional flows, consider the case of concentric circles of inner radius  $b$ and outer radius
 $a$. Stokes equations can be solved analytically in this geometry for prescribed translational and rotational velocities of the rod (Slezkin Reference Slezkin1955, pp. 135, 163). The resulting resistance matrix components,
 $\unicode[STIX]{x1D612}_{xx}$,
 $\unicode[STIX]{x1D612}_{xy}$,
 $\unicode[STIX]{x1D612}_{yy}$ non-dimensionalised by
 $\unicode[STIX]{x1D707}$,
 $\unicode[STIX]{x1D608}_{zz}$ by
 $\unicode[STIX]{x1D707}b^{2}$ and
 $\unicode[STIX]{x1D60A}_{x}$,
 $C_{y}$ by
 $\unicode[STIX]{x1D707}b$, are
 $$\begin{eqnarray}\displaystyle & \displaystyle \unicode[STIX]{x1D612}_{xy}=\unicode[STIX]{x1D60A}_{x}=C_{y}=0, & \displaystyle\end{eqnarray}$$
 $$\begin{eqnarray}\displaystyle & \displaystyle \unicode[STIX]{x1D612}_{xx}=\unicode[STIX]{x1D612}_{yy}=4\unicode[STIX]{x03C0}(1+r^{2})/(1-r^{2}+(1+r^{2})\log r), & \displaystyle\end{eqnarray}$$
 $$\begin{eqnarray}\displaystyle & \displaystyle \unicode[STIX]{x1D608}_{zz}=4\unicode[STIX]{x03C0}/(1-(1/r)^{2}), & \displaystyle\end{eqnarray}$$
 $r=a/b$. Due to the symmetry of the domain there is no coupling between translation and rotation. Moreover, the two eigenvalues of the matrix in (1.2) are given by
 $\unicode[STIX]{x1D612}_{xx}=\unicode[STIX]{x1D612}_{yy}$, i.e. there is equivalent resistance in all directions such that both the translational and rotational resistance decreases monotonically as the ratio
 $r$ increases. A resistance matrix of the form given in (1.1) has been used to describe the motion of a cylindrical rod of circular cross-section translating and rotating in Stokes flow between parallel plates (Dvinsky & Popel Reference Dvinsky and Popel1987). More recently, resistance matrices have been used to understand the interactions between swimming micro-organisms (Ishikawa, Simmonds & Pedley Reference Ishikawa, Simmonds and Pedley2006) and to control the movement of aqueous particles (Būtaitė et al. Reference Būtaitė, Gibson, Ho, Taverne, Taylor and Phillips2019).
1.3 Resistance as the rod approaches the wall
For the cross-sectional flow problem it is important to mention a complexity that arises if we are to consider the limiting behaviour that occurs when the rod touches the bounding cylinder. At this point, an interesting paradox arises: the resistance to motion in all directions tends to infinity; i.e. it will require infinite force to move the rod in any direction, including away from, or along, the contacting boundary (Jeffrey & Onishi Reference Jeffrey and Onishi1981). To address this paradoxical behaviour, it is worthwhile to consider the problem of a rod rolling or sliding along a plane wall in Stokes flow, as this will approximate the behaviour of a moving rod touching a bounding cylinder close to the point of contact. Even in this simplified scenario, theory detects a pathologic problem with solutions to the incompressible Stokes equations at the contact point, indicating the necessity for fluid compressibility or cavitation to limit the pressure drop across the point of contact to a physically acceptable value. This results in an infinite lift force, opening an interstice between the wall and the cylinder; the fluid dynamics through this narrow gap can be studied through lubrication analysis (Merlen & Frankiewicz Reference Merlen and Frankiewicz2011). The creation of cavitation bubbles for a rotating cylinder near a proximal wall has been confirmed experimentally (Seddon & Mullin Reference Seddon and Mullin2006), and these findings indicate a physical necessity for a small gap between a moving rod and bounding cylinder. Thus, in § 4, where we discuss cross-sectional resistance, we limit to configurations where the rod is a located a finite distance from the bounding cylinder. Fixing a finite distance for the rod from the boundary also prevents divergence of numerical code, as mesh elements will become degenerate at the point of contact. Within this framework, we seek the configuration that maximises the minimum eigenvalue of the Stokes resistance matrix, as, for a given instantaneous velocity, it will require the least work to perturb the position of the rod in the direction of minimum resistance. Rod positions that incur high resistance to imposed instantaneous velocities are of interest to optimal design, as motion of the rod away from these positions will be naturally retarded by the hydrodynamic forces imposed by the fluid, without the need to mechanically fix the position of the rod.
1.4 Paper summary
This paper is organised as follows. In § 2 we describe the model set-up. In the regime in which both the aspect ratio of the cylinders and the reduced Reynolds number are small, we show that at leading order the axial and cross-sectional flows can be decoupled into Poiseuille flow and Stokes flow, respectively. In § 3 we solve the axial flow equations and compute the flux for a given pressure drop as a function of rod position and the cross-sectional shapes of the rod and bounding cylinder, with an aim to determine configurations that minimise axial flow resistance. We will first consider the three special cases (i), (ii) and (iii), before extending, in § 3.4, our discussion of optimal axial flow to the full geometric parameter space of an elliptical rod in an elliptical cylinder with fixed area available for the fluid. In § 4 we solve the cross-sectional Stokes flow equations and calculate the forces and torque exerted on the rod by the surrounding viscous fluid when the rod undergoes a prescribed motion. We calculate the resistance matrix coefficients as functions of cross-sectional geometry and determine which configurations have high resistance to perturbations in the rod position. For circles in ellipses and for ellipses in ellipses of the same eccentricity and orientation, we find that the position of the rod that maximises the axial flow rate and compare this to the position of highest minimal resistance. We conclude in § 5.
2 Mathematical model
We consider an inner cylindrical rod which is free to move within a fluid-filled outer cylinder. The rod is prescribed a small, instantaneous, translational motion in a direction perpendicular to, and a rotation about, its longitudinal axis. The subsequent motion of the rod is driven by the hydrodynamic forces exerted on the rod by the fluid. As the rod moves, we assume that it remains coaxial with the outer cylinder. While the rod is able to move in the direction perpendicular to its longitudinal axis, we assume that it does not move axially. It is also able to rotate about its longitudinal axis. Both the translational and angular velocities of the inner rod are constant along its length.
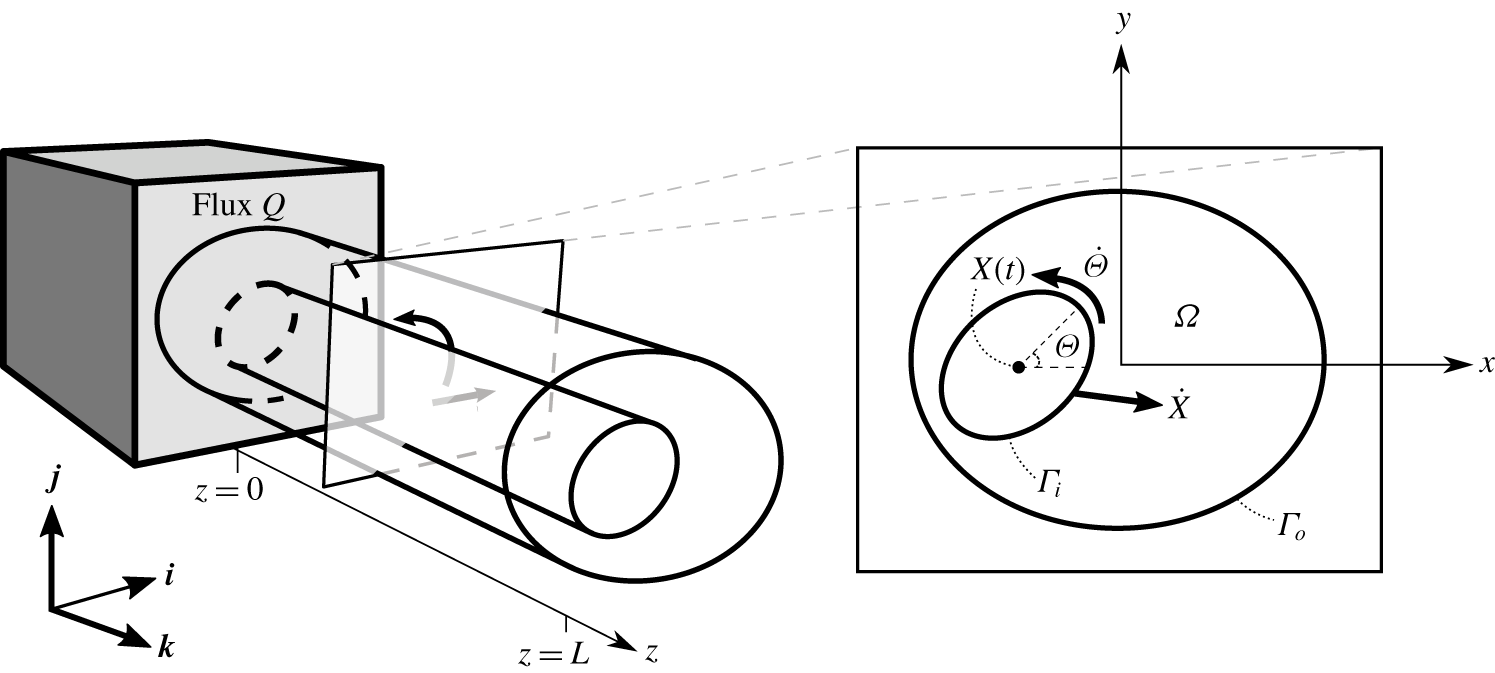
A schematic of the set-up in a Cartesian coordinate system  $(x,y,z)$ with corresponding coordinate directions
 $\boldsymbol{i}$,
 $\boldsymbol{j}$,
 $\boldsymbol{k}$, where
 $\boldsymbol{k}$ is oriented along the common axis of the cylinders of length
 $L$. At
 $z=0$ the flow is driven by a flux,
 $Q$. The boundaries of a cross-sectional slice of the cylinders are denoted
 $\unicode[STIX]{x1D6E4}_{i}$ (inner) and
 $\unicode[STIX]{x1D6E4}_{o}$ (outer), and the fluid-filled area between them is
 $\unicode[STIX]{x1D6FA}$. The inset shows a cross-sectional slice, where the position and orientation of the rod are given by
 $\boldsymbol{X}$ and
 $\unicode[STIX]{x1D6E9}$, respectively. The rod has translational velocity
 $\dot{\boldsymbol{X}}$ and angular velocity
 $\dot{\unicode[STIX]{x1D6E9}}$.

Both cylinders are of length  $L$ and have uniform elliptical cross-sections. The space between the inner and outer cylinders is filled with an incompressible, Newtonian fluid of viscosity
 $\unicode[STIX]{x1D707}$ and density
 $\unicode[STIX]{x1D70C}$. Flow is driven by both an applied non-zero constant axial flux and the motion of the cylindrical rod. We adopt a Cartesian coordinate system
 $(x,y,z)$ with corresponding coordinate directions
 $\boldsymbol{i}$,
 $\boldsymbol{j}$,
 $\boldsymbol{k}$, where
 $\boldsymbol{k}$ is oriented along the common axis of the cylinders and
 $z=0$ is at the entrance to the annular region (see figure 2). With subscripts
 $i$ and
 $o$ denoting the inner and outer cylinders, respectively, we take the characteristic radii of the cylinders to be
 $$\begin{eqnarray}R_{i}=\sqrt{A_{i}/\unicode[STIX]{x03C0}},\quad R_{o}=\sqrt{A_{o}/\unicode[STIX]{x03C0}},\end{eqnarray}$$
where  $A_{i}$ and
 $A_{o}$ are the respective cross-sectional areas. We assume that
 $R_{i}$ and
 $R_{o}$ are comparable and much smaller than
 $L$. We denote the annular boundaries of a cross-sectional slice of the cylinders as
 $\unicode[STIX]{x1D6E4}_{o}$ and
 $\unicode[STIX]{x1D6E4}_{i}$. The coordinate position of the geometric centre of the inner rod is given by
 $(X(t),Y(t),L/2)$, where
 $X$ and
 $Y$ are functions of time, and thus the position of the inner rod within the cross-section is
 $\boldsymbol{X}(t)=(X(t),Y(t))$. The orientation of the major axis of the rod’s cross-section, with respect to the
 $x$-axis, is given by
 $\unicode[STIX]{x1D6E9}(t)$, also a function of time (figure 2).
2.1 Dimensionless system
As motivated in § 1, we are interested in a regime where fluid inertia is negligible. Thus, the fluid flow is governed by the Stokes and continuity equations. We define the aspect ratio of the rod to be  $\unicode[STIX]{x1D716}=R_{i}/L\ll 1$ and non-dimensionalise the axial coordinate by
 $L$ and the cross-sectional coordinates by
 $R_{i}=\unicode[STIX]{x1D716}L$. We assume a non-zero constant flux
 $Q$ is applied at
 $z=0$ and thus, non-dimensionalise the axial velocity by characteristic velocity scale
 $W=Q/R_{i}^{2}$. We choose the pressure scaling
 $P=(W\unicode[STIX]{x1D707}/L\unicode[STIX]{x1D716}^{2})$ to balance the viscous terms in the Stokes equations and the cross-sectional force and torque are scaled by
 $\unicode[STIX]{x1D716}L\unicode[STIX]{x1D707}W$ and
 $\unicode[STIX]{x1D716}^{2}L^{2}\unicode[STIX]{x1D707}W$, respectively. The dimensionless Stokes equations are given in component form by
 $$\begin{eqnarray}\displaystyle & \displaystyle -p_{x}+\unicode[STIX]{x1D716}^{2}(u_{xx}+u_{yy})+\unicode[STIX]{x1D716}^{4}u_{zz}=0, & \displaystyle\end{eqnarray}$$
 $$\begin{eqnarray}\displaystyle & \displaystyle -p_{y}+\unicode[STIX]{x1D716}^{2}(v_{xx}+v_{yy})+\unicode[STIX]{x1D716}^{4}v_{zz}=0, & \displaystyle\end{eqnarray}$$
 $$\begin{eqnarray}\displaystyle & \displaystyle -p_{z}+w_{xx}+w_{yy}+\unicode[STIX]{x1D716}^{2}w_{zz}=0, & \displaystyle\end{eqnarray}$$
 $$\begin{eqnarray}\displaystyle & \displaystyle u_{x}+v_{y}+w_{z}=0, & \displaystyle\end{eqnarray}$$
 $$\begin{eqnarray}\iint _{\unicode[STIX]{x1D6FA}}w\,\text{d}\unicode[STIX]{x1D6FA}=1,\end{eqnarray}$$
where  $\unicode[STIX]{x1D6FA}$ is the two-dimensional region of the cross-section between the cylinders.
No-slip conditions at the surfaces of the inner and outer cylinders give the dimensionless boundary conditions
 $$\begin{eqnarray}\left.\begin{array}{@{}c@{}}u={\dot{X}}-\dot{\unicode[STIX]{x1D6E9}}(y-Y),\\ v={\dot{Y}}+\dot{\unicode[STIX]{x1D6E9}}(x-X),\\ w=0,\end{array}\right\}\quad \text{on}~\unicode[STIX]{x1D6E4}_{i}\end{eqnarray}$$
and
 $$\begin{eqnarray}\boldsymbol{u}=\mathbf{0},\quad \text{on}~\unicode[STIX]{x1D6E4}_{o}.\end{eqnarray}$$
To calculate  $\dot{\boldsymbol{X}}$ and
 $\dot{\unicode[STIX]{x1D6E9}}$, where dots denote derivatives with respect to time, we consider conservation of linear and angular momentum for the inner rod which gives, in dimensionless form,
 $$\begin{eqnarray}\ddot{\boldsymbol{X}}=\unicode[STIX]{x1D6FC}\boldsymbol{F}(\boldsymbol{X},\unicode[STIX]{x1D6E9},\dot{\boldsymbol{X}},\dot{\unicode[STIX]{x1D6E9}}),\quad \ddot{\unicode[STIX]{x1D6E9}}=\unicode[STIX]{x1D6FC}^{\prime }\unicode[STIX]{x1D70F}(\boldsymbol{X},\unicode[STIX]{x1D6E9},\dot{\boldsymbol{X}},\dot{\unicode[STIX]{x1D6E9}}),\end{eqnarray}$$
where  $\boldsymbol{F}$ and
 $\unicode[STIX]{x1D70F}$ are the hydrodynamic force in the cross-section and
 $z$-component of the torque exerted on the rod due to the motion of the fluid, obtained by integrating contributions from the viscous pressure forces. Because the cylinders remain coaxial,
 $\unicode[STIX]{x1D70F}$ and
 $\boldsymbol{F}$ are the only non-zero force and torque components. The dimensionless constants in (2.6a,b) are defined as
 $$\begin{eqnarray}\unicode[STIX]{x1D6FC}=\unicode[STIX]{x1D707}L^{2}/mW,\quad \unicode[STIX]{x1D6FC}^{\prime }=R_{i}^{2}\unicode[STIX]{x1D707}L^{2}/IW,\end{eqnarray}$$
where  $m$ and
 $I$ are the rod mass and the moment of inertia about the rod axis, respectively, and
 $\unicode[STIX]{x1D6FC}^{\prime }$ is the same size as
 $\unicode[STIX]{x1D6FC}$ as
 $I$ scales with
 $R_{i}^{2}m$. We note that
 $\unicode[STIX]{x1D6FC}$ can be rearranged to relate the fluid density to the material density of the inner rod multiplied by the reduced Reynolds number. As discussed in the introduction, we will consider the regime where this parameter is
 $O(1)$. As dimensionless initial conditions for (2.6) we prescribe
 $$\begin{eqnarray}\boldsymbol{X}(0)=\boldsymbol{{\mathcal{X}}},\quad \unicode[STIX]{x1D6E9}(0)=\unicode[STIX]{x1D6F7},\quad \dot{\boldsymbol{X}}(0)=U\boldsymbol{\ell },\quad \dot{\unicode[STIX]{x1D6E9}}(0)=\unicode[STIX]{x1D714},\end{eqnarray}$$
where  $\boldsymbol{{\mathcal{X}}}$ is the initial location of the rod’s axis in the
 $(x,y)$ plane,
 $\unicode[STIX]{x1D6F7}$ is its initial orientation angle,
 $U$ is its initial velocity in a direction given by
 $\boldsymbol{\ell }$, a unit vector in the
 $(x,y)$-plane and
 $\unicode[STIX]{x1D714}$ is its initial angular velocity about the
 $z$-axis. We assume
 $\boldsymbol{{\mathcal{X}}}$,
 $U$,
 $\unicode[STIX]{x1D6F7}$, and
 $\unicode[STIX]{x1D714}$ are all
 $O(1)$; due to the chosen non-dimensionalisations, this requires the initial imposed rod velocities to be
 $\unicode[STIX]{x1D716}$ times smaller than the axial velocity.
2.2 Asymptotic analysis
We take  $\unicode[STIX]{x1D716}^{2}\ll 1$ and seek expansions to our dimensionless variables of the forms
 $$\begin{eqnarray}\boldsymbol{u}=\boldsymbol{u}_{0}+\unicode[STIX]{x1D716}^{2}\boldsymbol{u}_{1}+\cdots ,\quad p=p_{0}+\unicode[STIX]{x1D716}^{2}p_{1}+\cdots ,\end{eqnarray}$$
 $$\begin{eqnarray}\boldsymbol{X}=\boldsymbol{X}_{0}+\unicode[STIX]{x1D716}^{2}\boldsymbol{X}_{1}+\cdots ,\quad \unicode[STIX]{x1D6E9}=\unicode[STIX]{x1D6E9}_{0}+\unicode[STIX]{x1D716}^{2}\unicode[STIX]{x1D6E9}_{1}+\cdots .\end{eqnarray}$$
 $O(1)$ terms gives
 $$\begin{eqnarray}\unicode[STIX]{x1D6FB}_{\bot }^{2}w_{0}=\frac{\text{d}p_{0}}{\text{d}z},\quad \unicode[STIX]{x1D735}_{\bot }\boldsymbol{\cdot }\boldsymbol{u}_{0}^{\bot }+w_{0z}=0,\end{eqnarray}$$
where  $\boldsymbol{u}_{0}^{\bot }=u_{0}\boldsymbol{i}+v_{0}\,\boldsymbol{j}$, and that
 $\text{d}p_{0}/\text{d}z$ is independent of
 $x$ and
 $y$ follows from (2.2a) and (2.2b) at leading order. To determine the cross-sectional velocity components,
 $u_{0}$ and
 $v_{0}$, we consider (2.2a) and (2.2b) at
 $O(\unicode[STIX]{x1D716}^{2})$, and obtain the two-dimensional Stokes equations
 $$\begin{eqnarray}\unicode[STIX]{x1D6FB}_{\bot }^{2}u_{0}=p_{1x},\quad \unicode[STIX]{x1D6FB}_{\bot }^{2}v_{0}=p_{1y}.\end{eqnarray}$$
The leading-order flux condition is
 $$\begin{eqnarray}\iint _{\unicode[STIX]{x1D6FA}}w_{0}\,\text{d}\unicode[STIX]{x1D6FA}=1,\end{eqnarray}$$
and leading-order boundary conditions are
 $$\begin{eqnarray}\left.\begin{array}{@{}c@{}}u_{0}={\dot{X}}_{0}-\dot{\unicode[STIX]{x1D6E9}}_{0}(y-Y_{0}),\\ v_{0}={\dot{Y}}_{0}+\dot{\unicode[STIX]{x1D6E9}}_{0}(x-X_{0}),\\ w_{0}=0,\end{array}\right\}\quad \text{on}~\unicode[STIX]{x1D6E4}_{i}\end{eqnarray}$$
and
 $$\begin{eqnarray}\boldsymbol{u}_{0}^{\bot }=\mathbf{0}\quad \text{and}\quad w_{0}=0,\quad \text{on }~\unicode[STIX]{x1D6E4}_{o}.\end{eqnarray}$$
The equations of motion for the rod, equation (2.6), read at leading order
 $$\begin{eqnarray}\ddot{\boldsymbol{X}}_{0}=\unicode[STIX]{x1D6FC}\boldsymbol{F}_{0}(\boldsymbol{X}_{0},\unicode[STIX]{x1D6E9}_{0},\dot{\boldsymbol{X}}_{0},\dot{\unicode[STIX]{x1D6E9}}_{0}),\quad \ddot{\unicode[STIX]{x1D6E9}}_{0}=\unicode[STIX]{x1D6FC}^{\prime }\unicode[STIX]{x1D70F}_{0}(\boldsymbol{X}_{0},\unicode[STIX]{x1D6E9}_{0},\dot{\boldsymbol{X}}_{0},\dot{\unicode[STIX]{x1D6E9}}_{0}),\end{eqnarray}$$
where the leading-order expressions for the hydrodynamic forces and torque on the rod are
 $$\begin{eqnarray}\displaystyle & \displaystyle \boldsymbol{F}_{0}=\int _{0}^{1}\left[\oint _{\unicode[STIX]{x1D6E4}_{i}}\unicode[STIX]{x1D748}_{0}\boldsymbol{n}_{i}\,\text{d}s\right]\text{d}z, & \displaystyle\end{eqnarray}$$
 $$\begin{eqnarray}\displaystyle & \displaystyle \unicode[STIX]{x1D70F}_{0}=\int _{0}^{1}\left[\oint _{\unicode[STIX]{x1D6E4}_{i}}(x-X_{0})(\unicode[STIX]{x1D748}_{0}\boldsymbol{n}_{i})\boldsymbol{\cdot }\boldsymbol{j}-(y-Y_{0})(\unicode[STIX]{x1D748}_{0}\boldsymbol{n}_{i})\boldsymbol{\cdot }\boldsymbol{i}\,\text{d}s\right]\text{d}z, & \displaystyle\end{eqnarray}$$
 $$\begin{eqnarray}\unicode[STIX]{x1D748}_{0}=[-(p_{0}/\unicode[STIX]{x1D716}^{2}+p_{1})\boldsymbol{I}+(\unicode[STIX]{x1D735}\boldsymbol{u}_{0}^{\bot }+\unicode[STIX]{x1D735}\boldsymbol{u}_{0}^{\bot })^{\text{T}}].\end{eqnarray}$$
The leading-order initial conditions for the rod motion are
 $$\begin{eqnarray}\boldsymbol{X}_{0}(0)=\boldsymbol{{\mathcal{X}}},\quad \unicode[STIX]{x1D6E9}_{0}(0)=\unicode[STIX]{x1D6F7},\quad \dot{\boldsymbol{X}}(0)=\boldsymbol{U},\quad \dot{\unicode[STIX]{x1D6E9}}=\unicode[STIX]{x1D714}.\end{eqnarray}$$
2.3 Leading-order solution
We seek a separable solution for  $w_{0}$ of the form
 $$\begin{eqnarray}w_{0}=f(x,y)\frac{\text{d}p_{0}}{\text{d}z}.\end{eqnarray}$$
Integrating (2.10b) over a cross-section of the fluid domain between the two cylinders, using (2.13) and (2.14), and applying the divergence theorem gives
 $$\begin{eqnarray}\iint _{\unicode[STIX]{x1D6FA}}w_{0z}\,\text{d}\unicode[STIX]{x1D6FA}=0.\end{eqnarray}$$
Inserting the form (2.19) and using the imposed flux condition (2.12), we conclude that
 $$\begin{eqnarray}\frac{\text{d}^{2}p_{0}}{\text{d}z^{2}}=0\rightarrow \frac{\text{d}p_{0}}{\text{d}z}=\text{const.}\end{eqnarray}$$
and it follows that
 $$\begin{eqnarray}w_{0z}=0.\end{eqnarray}$$
Hence (2.10b) becomes
 $$\begin{eqnarray}\unicode[STIX]{x1D735}_{\bot }\boldsymbol{\cdot }\boldsymbol{u}_{0}^{\bot }=0\end{eqnarray}$$
and the governing equation for the axial fluid flow, (2.10a), is
 $$\begin{eqnarray}\unicode[STIX]{x1D6FB}_{\bot }^{2}f(x,y)=1,\end{eqnarray}$$
with no-slip boundary conditions, equations (2.13c) and (2.14b),
 $$\begin{eqnarray}f=0,\quad \text{on}~\unicode[STIX]{x1D6E4}_{i},\unicode[STIX]{x1D6E4}_{o}.\end{eqnarray}$$
Additionally, using the flux condition (2.3) we can solve for the constant pressure gradient
 $$\begin{eqnarray}\frac{\text{d}p_{0}}{\text{d}z}=\left[\iint _{\unicode[STIX]{x1D6FA}}f(x,y)\,\text{d}\unicode[STIX]{x1D6FA}\right]^{-1},\end{eqnarray}$$
and thus
 $$\begin{eqnarray}w_{0}=f(x,y)\left[\iint _{\unicode[STIX]{x1D6FA}}f(x,y)\,\text{d}\unicode[STIX]{x1D6FA}\right]^{-1},\end{eqnarray}$$
As  $p_{0}$ is constant within a cross-section it has no contribution to the leading-order hydrodynamic force and torque given by (2.16). Additionally, the bracketed terms in (2.16) are independent of
 $z$, and hence (2.16) and (2.17) to calculate the force and torque reduce to
 $$\begin{eqnarray}\displaystyle & \displaystyle \boldsymbol{F}_{0}=\oint _{\unicode[STIX]{x1D6E4}_{i}}\unicode[STIX]{x1D748}_{0}\boldsymbol{n}_{i}\,\text{d}s, & \displaystyle\end{eqnarray}$$
 $$\begin{eqnarray}\displaystyle & \displaystyle \unicode[STIX]{x1D70F}_{0}=\oint _{\unicode[STIX]{x1D6E4}_{i}}(x-X_{0})(\unicode[STIX]{x1D748}_{0}\boldsymbol{n}_{i})\boldsymbol{\cdot }\boldsymbol{j}-(y-Y_{0})(\unicode[STIX]{x1D748}_{0}\boldsymbol{n}_{i})\boldsymbol{\cdot }\boldsymbol{i}\,\text{d}s, & \displaystyle\end{eqnarray}$$
 $$\begin{eqnarray}\unicode[STIX]{x1D748}_{0}=[-p_{1}\boldsymbol{I}+(\unicode[STIX]{x1D735}\boldsymbol{u}_{0}^{\bot }+\unicode[STIX]{x1D735}\boldsymbol{u}_{0}^{\bot })^{\text{T}}].\end{eqnarray}$$
Henceforth, we will drop leading-order subscripts. We will retain the subscript on the only first-order term that appears in our leading-order system,  $p_{1}$, to differentiate the first-order pressure that drives flow in the cross-section, equations (2.11), from the leading-order pressure that drives the axial flow, equation (2.10a).
2.4 Model summary and computational approach
Equations (2.24), (2.25) and (2.27) give rise to Poiseuille flow, where the axial flow resistance,  ${\mathcal{R}}(\boldsymbol{X},\unicode[STIX]{x1D6E9})$, is equal to the constant pressure gradient required to maintain the axial flow through the annular domain at unit flux. This is given by
 $$\begin{eqnarray}{\mathcal{R}}(\boldsymbol{X},\unicode[STIX]{x1D6E9})=\left[\iint _{\unicode[STIX]{x1D6FA}}f(x,y)\,\text{d}\unicode[STIX]{x1D6FA}\right]^{-1},\end{eqnarray}$$
a function of domain geometry. We note that for any given flux
 $$\begin{eqnarray}Q(\boldsymbol{X},\unicode[STIX]{x1D6E9})=\frac{1}{{\mathcal{R}}(\boldsymbol{X},\unicode[STIX]{x1D6E9})}\frac{\text{d}p}{\text{d}z},\end{eqnarray}$$
and so, once  ${\mathcal{R}}(\boldsymbol{X},\unicode[STIX]{x1D6E9})$ is determined via (2.30), we can compute
 $Q(\boldsymbol{X},\unicode[STIX]{x1D6E9})$ for any specified pressure gradient. Motivated by the urological application, in which it is most natural to consider optimising flow rate for a given pressure drop, our approach in §§ 3 and 3.4 will be to fix
 $\text{d}p/\text{d}z=-1$ as a model input and compute
 $Q(\boldsymbol{X},\unicode[STIX]{x1D6E9})$ and the associated flow profile as primary outputs. In this view, minimising the resistance is equivalent to maximising the flux.
The equations governing the cross-sectional flow are the Stokes equations (2.11) and incompressibility (2.23), with no-slip boundary conditions (2.13a–b) and (2.14a). As discussed in § 1, the forces and torque on the inner rod, equations (2.28a,b), are linearly related to the imposed velocities via resistance coefficients
 $$\begin{eqnarray}\displaystyle & \displaystyle \boldsymbol{F}(\boldsymbol{X},\unicode[STIX]{x1D6E9},\dot{\boldsymbol{X}},\dot{\unicode[STIX]{x1D6E9}})=-[\unicode[STIX]{x1D646}(\boldsymbol{X},\unicode[STIX]{x1D6E9})\dot{\boldsymbol{X}}+\unicode[STIX]{x1D63E}(\boldsymbol{X},\unicode[STIX]{x1D6E9})\dot{\unicode[STIX]{x1D6E9}}], & \displaystyle\end{eqnarray}$$
 $$\begin{eqnarray}\displaystyle & \displaystyle \unicode[STIX]{x1D70F}(\boldsymbol{X},\unicode[STIX]{x1D6E9},\dot{\boldsymbol{X}},\dot{\unicode[STIX]{x1D6E9}})=-[\unicode[STIX]{x1D608}_{zz}(\boldsymbol{X},\unicode[STIX]{x1D6E9})\dot{\unicode[STIX]{x1D6E9}}+\unicode[STIX]{x1D60A}_{x}(\boldsymbol{X},\unicode[STIX]{x1D6E9}){\dot{X}}+C_{y}(\boldsymbol{X},\unicode[STIX]{x1D6E9}){\dot{Y}}], & \displaystyle\end{eqnarray}$$
 $\unicode[STIX]{x1D646}(\boldsymbol{X},\unicode[STIX]{x1D6E9})$ is the two-dimensional translation matrix and
 $\unicode[STIX]{x1D63E}(\boldsymbol{X},\unicode[STIX]{x1D6E9})$ describes the coupling between translation and rotation:
 $$\begin{eqnarray}\unicode[STIX]{x1D646}(\boldsymbol{X},\unicode[STIX]{x1D6E9})=\left[\begin{array}{@{}cc@{}}\unicode[STIX]{x1D612}_{xx} & \unicode[STIX]{x1D612}_{xy}\\ \unicode[STIX]{x1D612}_{xy} & \unicode[STIX]{x1D612}_{yy}\end{array}\right],\quad \unicode[STIX]{x1D63E}(\boldsymbol{X},\unicode[STIX]{x1D6E9})=\left[\begin{array}{@{}c@{}}\unicode[STIX]{x1D60A}_{x}\\ C_{y}\end{array}\right].\end{eqnarray}$$
The resistance coefficients in (2.33a,b) are also functions of domain geometry. We will compute these in § 4. To explore the effect of geometry on both the axial and cross-sectional resistances we consider configurations (i), (ii) and (iii), as introduced in § 1. In each configuration, we will fix the cross-sectional areas of the cylinders to constrain the space available for fluid. We do this by setting the characteristic radius of the outer cylinder (scaled by  $R_{i}$) which we denote
 $R_{o}$. This reduces the parameter space, allowing for full interrogation of the axial and transverse flows on
 $\boldsymbol{X}$,
 $\unicode[STIX]{x1D6E9}$, and the shape of the elliptical cross-sections of the inner and outer cylinders. In § 3.4, we will consider a more complete optimisation problem for axial flow resistance, relaxing our previous restrictions on the considered elliptical geometries.
3 Axial flow
We begin by considering the effect of cross-sectional geometry on axial flow by solving (2.24) subject to conditions (2.25) for varying ellipse cross-sectional geometries. Results were calculated numerically using an open-source finite element library, oomph-lib (Heil & Hazel Reference Heil, Hazel, Schäfer and Bungartz2006). Details on the numerical elements and mesh are provided in § A.2.
Our objective is to explore how the flux is affected by the position and orientation of the inner rod,  $\boldsymbol{X}$ and
 $\unicode[STIX]{x1D6E9}$, respectively, and the elliptical eccentricity of the cross-sections. The eccentricity is defined as
 $$\begin{eqnarray}e_{i,o}=\sqrt{1-(b_{i,o}/a_{i,o})^{2}},\end{eqnarray}$$
where  $a_{i,o}$ and
 $b_{i,o}$ are the major and minor axes of the inner and outer cylinder, respectively. A zero eccentricity value therefore corresponds to a circle and
 $e=1$ is a slit of zero width and infinite length. For fixed characteristic radii, see (2.1), and given eccentricity,
 $e_{i,o}$, we can calculate
 $a_{i,o}$ and
 $b_{i,o}$:
 $$\begin{eqnarray}\displaystyle a_{i}=(1-e_{i}^{2})^{-1/4},\quad b_{i}=(1-e_{i}^{2})^{1/4},\end{eqnarray}$$
 $$\begin{eqnarray}\displaystyle a_{o}=R_{o}(1-e_{o}^{2})^{-1/4},\quad b_{o}=R_{o}(1-e_{o}^{2})^{1/4}.\end{eqnarray}$$
3.1 (i) Circle in ellipse
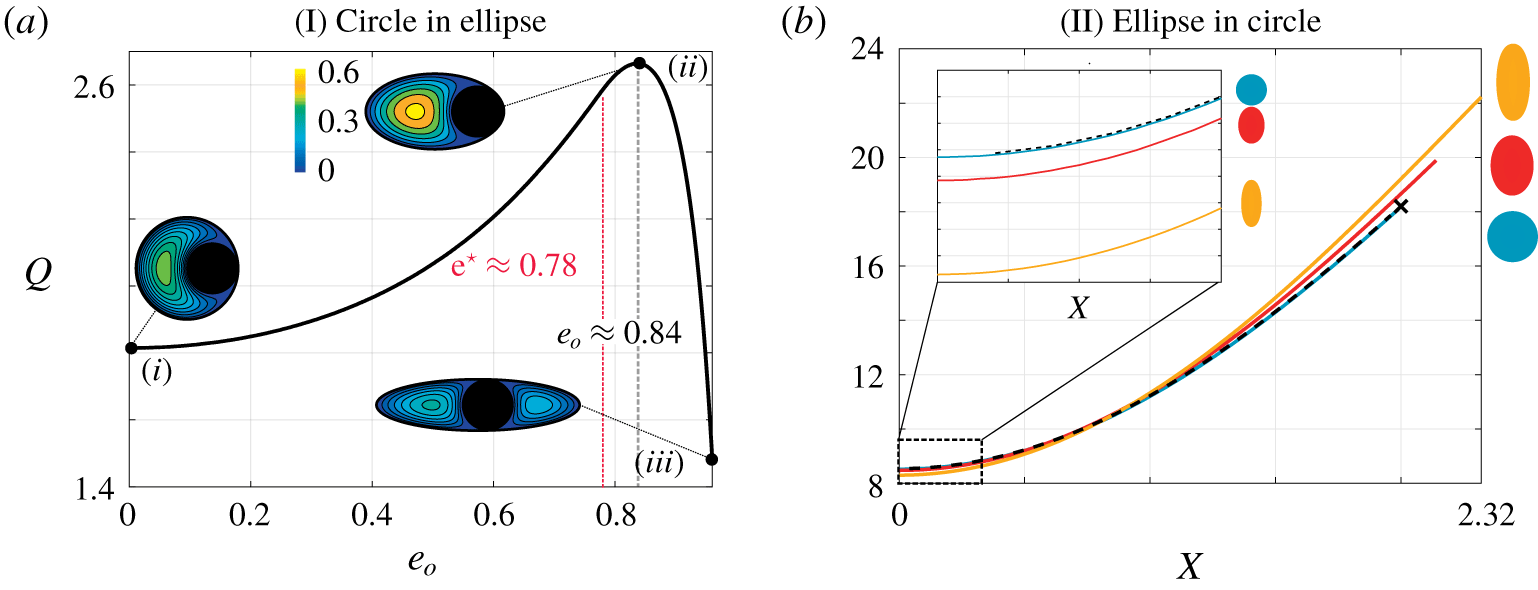
In figure 3(a) we consider a circular rod (of dimensionless unit radius) inside a cylinder of elliptical cross-section (with characteristic radius  $R_{o}=2$). (Figure 3a has previously appeared in Williams et al. (Reference Williams, Turney, Rauniyar, Harrah, Waters and Moulton2019a), an endourological publication to translate these relevant findings for a clinical audience.) We vary the eccentricity of the outer cylinder’s cross-section while maintaining the cross-sectional area, using (3.2) to determine the corresponding lengths of the major and minor axes. When, for each value of
 $e_{o}$, the rod is located at the position that maximises flux (see appendix B), we find that the flux initially increases with
 $e_{o}$. The maximum flux over all
 $e_{o}$ (data point (ii)) is nearly 50 % higher than the flux for a circular outer cylinder of the same cross-sectional area (data point (i)). The eccentricity at which the maximum flux is achieved is
 $e_{o}\approx 0.84$ for
 $R_{o}=2$. We might hypothesise that this coincides with the value for
 $e_{o}$ where the rod and bounding cylinder match curvature at the cylinder’s vertex, which we denote
 $\text{e}^{\star }$ (appendix B). However, for
 $R_{o}=2$,
 $\text{e}^{\star }\approx 0.78$, which is less than the
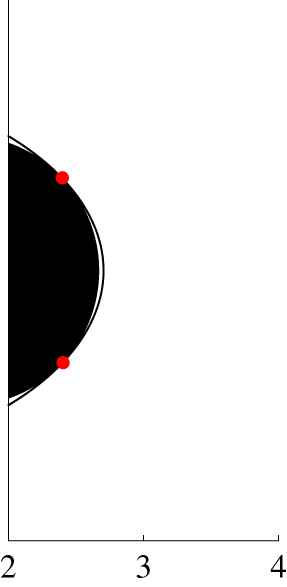
 $e_{o}$ value where maximum flux is achieved. In fact, in configuration (ii) in figure 3(a), although hard to discern from the colour map, the circular rod tangentially touches the elliptic cylinder in two locations. The colour bar in figure 3(a) gives the magnitude of the axial velocity, and demonstrates that the maximum velocity within the cross-section is also larger in configuration (ii), than in either (i) or (iii).
Dimensionless flow rate,  $Q$ with
 $\boldsymbol{X}=(X,0)$, as a function of (a)
 $e_{o}$, for
 $e_{i}=0$,
 $R_{o}=2$, and (b)
 $X$, for
 $e_{o}=0$,
 $R_{o}=3$. In (a), for each
 $e_{o}$, the inner circle is located at the position that maximises the axial flux (see appendix B). When
 $e_{o}=\text{e}^{\star }$, the ellipse matches curvature with the circle at the ellipse vertex. The colour bar provides the magnitude of the axial velocity. (b) Plots
 $Q$ as a function of
 $X$ for
 $e_{i}=0$ (blue)
 $e_{i}=0.7$ (red)
 $e_{i}=0.9$ (yellow) oriented at
 $\unicode[STIX]{x03C0}/2$. The inset plot provides a zoomed-in view from
 $X=0$ to
 $X=0.2$. The dashed black line gives the analytical solution by Piercy et al. (Reference Piercy, Hooper and Winny1933) and the black cross the solution by MacDonald (Reference MacDonald1982) (see table 2 for more details).

3.2 (ii) Ellipse in circle
When considering an elliptical inner rod and circular outer cylinder ( $e_{o}=0$), we can, due to the rotational symmetry of the outer domain, fix
 $\boldsymbol{X}=(X,0)$ and vary the inner rod’s position along the
 $x$-axis only, without loss of generality. Here, we fix
 $R_{o}=3$, a larger cross-section to allow for a wider range of feasible positions and orientations for the inner rod, and vary
 $X$,
 $\unicode[STIX]{x1D6E9}$, and
 $e_{i}$. We find, as anticipated, that
 $Q$ increases with
 $X$ for all values of
 $e_{i}$ and
 $\unicode[STIX]{x1D6E9}$. Increasing
 $e_{i}$ can either increase or decrease
 $Q$ depending on the position and orientation of the inner rod. For example, when the rod is centred in the outer cylinder – and the flux is independent of
 $\unicode[STIX]{x1D6E9}$ due to the geometry of the domain – the largest flux is obtained when the rod is circular, and decreases with
 $e_{i}$. This effect can be seen for
 $e_{i}=0$,
 $e_{i}=0.7$ and
 $e_{i}=0.9$ oriented at
 $\unicode[STIX]{x1D6E9}=\unicode[STIX]{x03C0}/2$ in the inset plot in figure 3(b). In contrast, when the rod is sufficiently offset, the more eccentric rods at
 $\unicode[STIX]{x1D6E9}=\unicode[STIX]{x03C0}/2$ cause less obstruction near the centre of the channel, allowing for higher flow (see figure 3b).
For a circular rod ( $e_{i}=0$), we validate our numerical solution against the analytical solution for offset circles (Piercy et al. Reference Piercy, Hooper and Winny1933) (dashed black line in figure 3b) in addition to confirming that our numerical solution approaches the limiting case of touching circles (MacDonald Reference MacDonald1982) as
 $X$ approaches 2 (black cross in figure 3b). (As Piercy et al. (Reference Piercy, Hooper and Winny1933) presents a solution for the flow rate in terms of an infinite sum, we truncate this sum to determine the flow rate (see § A.3).)
In §§ 3.1 and 3.2, we have considered the particular cases where one of the cylinders has a circular cross-section. As anticipated, in both configurations, the maximum flux was achieved for a rod tangent to the outer boundary. Perhaps unexpectedly, figure 3(a) demonstrated that the optimal configuration may not be one where the inner rod is tangent at a single point. We will explore this in more detail in § 3.4, where we will determine the true optimal geometry that maximises axial flux (for fixed area), relaxing all previous geometric restrictions. However, we will first consider another reduced parameter space, namely elliptical rods in elliptical cylinders of the same eccentricity and orientation; a configuration that allows for clear specification of the inner rod’s position, and a discussion of the effects of eccentricity as a single parameter.
3.3 (iii) Ellipse in ellipse
We now consider cylinders with elliptical cross-sections of the same eccentricities  $e=e_{i}=e_{o}$ and orientation (
 $\unicode[STIX]{x1D6E9}=0$). We fix
 $R_{o}=2$ and again seek configurations that maximise the flux. (It is worthwhile to note, when comparing flux values between different geometries, that in this section and in § 3.4,
 $R_{o}=2$, so the space available for fluid flow is the same as in figure 3a (a circular rod in an elliptical cylinder) but less than in figure 3b (an elliptical rod in a circular cylinder) where
 $R_{o}=3$.)
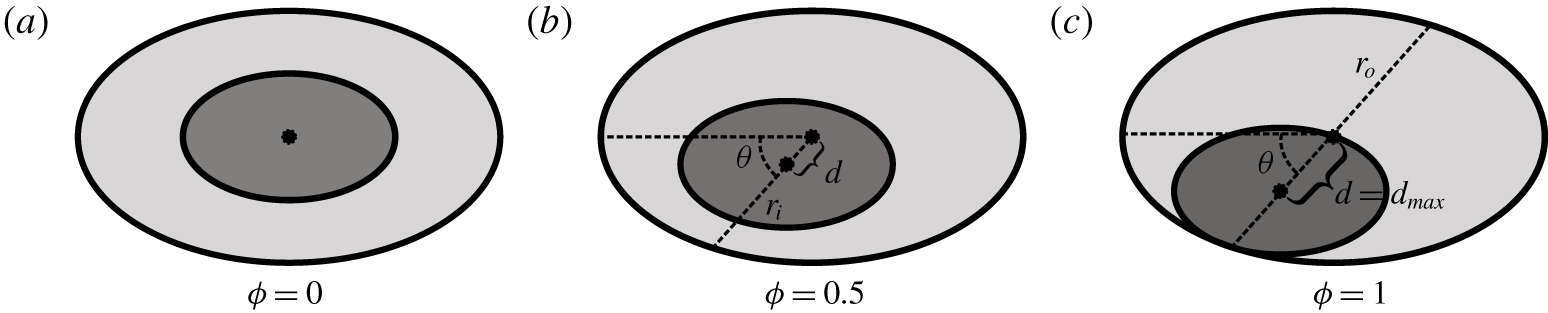
To describe the position of the inner ellipse relative to the outer ellipse we first define  $\unicode[STIX]{x1D703}$ to be the angle between the major axis of the outer ellipse and a line connecting the centres of the two ellipses, see figure 4. The effective radii of the inner and outer ellipses are then defined as
 $$\begin{eqnarray}r_{i}=a_{i}b_{i}/\sqrt{a_{i}^{2}\sin ^{2}\unicode[STIX]{x1D703}+b_{i}^{2}\cos ^{2}\unicode[STIX]{x1D703}},\quad r_{o}=a_{o}b_{o}/\sqrt{a_{o}^{2}\sin ^{2}\unicode[STIX]{x1D703}+b_{o}^{2}\cos ^{2}\unicode[STIX]{x1D703}}.\end{eqnarray}$$
With these definitions, the maximum distance,  $d_{max}$ between the centres at an angle
 $\unicode[STIX]{x1D703}$ (when the rod and the outer cylinder touch) is given by
 $$\begin{eqnarray}d_{max}=r_{o}-r_{i}.\end{eqnarray}$$
From this we define an offset parameter,  $\unicode[STIX]{x1D719}$, that is the ratio of the distance between the centres of the two ellipses at an angle
 $\unicode[STIX]{x1D703}$ and
 $d_{max}$:
 $$\begin{eqnarray}\unicode[STIX]{x1D719}=d/d_{max}.\end{eqnarray}$$
Thus, the domain is characterised by three parameters: the eccentricity,  $e\in [0,1)$; the angle of offset,
 $\unicode[STIX]{x1D703}\in [0,\unicode[STIX]{x03C0}/2]$; and the relative offset,
 $\unicode[STIX]{x1D719}\in [0,1]$ (see figure 4).
Schematic showing a sample geometry for  $e=0.8$,
 $\unicode[STIX]{x1D703}=\unicode[STIX]{x03C0}/4$ and (a)
 $\unicode[STIX]{x1D719}=0$, (b)
 $\unicode[STIX]{x1D719}=0.5$, (c)
 $\unicode[STIX]{x1D719}=1$. The shaded ellipse is the cross-section of the rod.

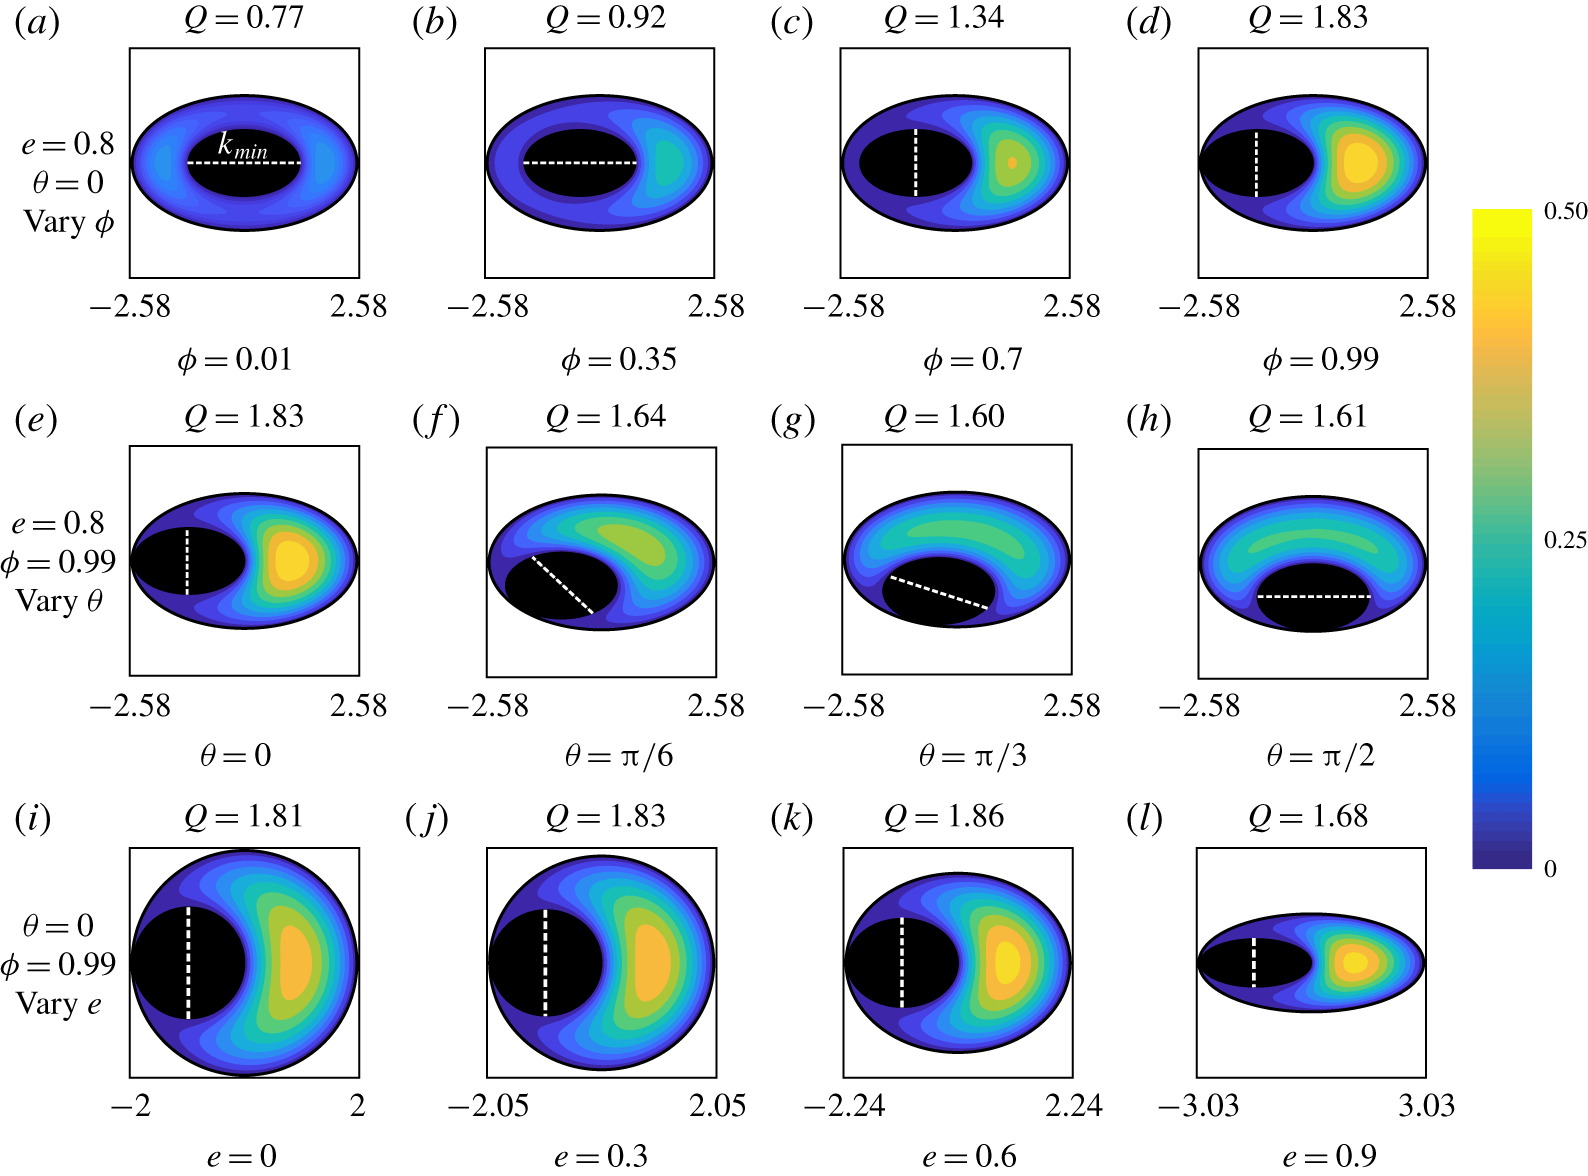
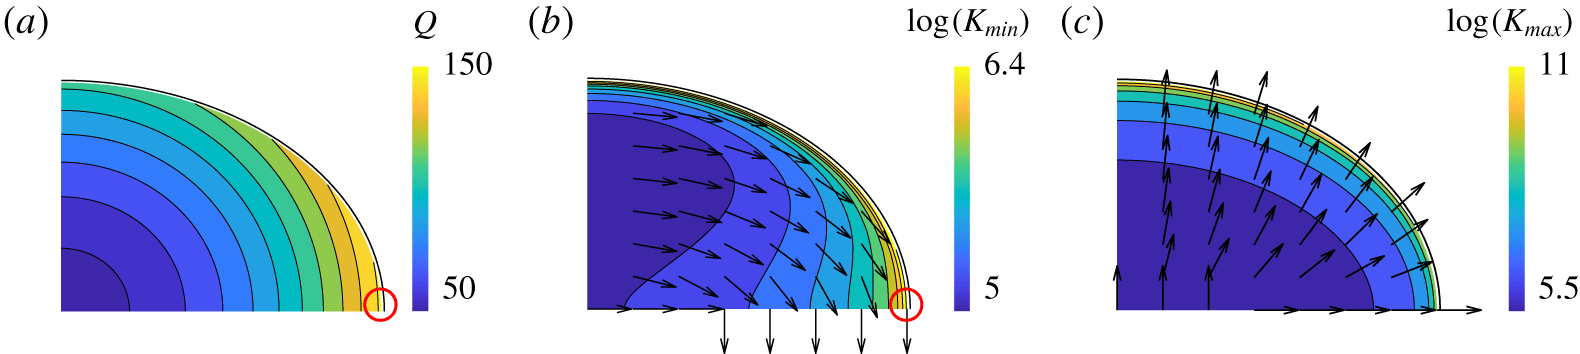
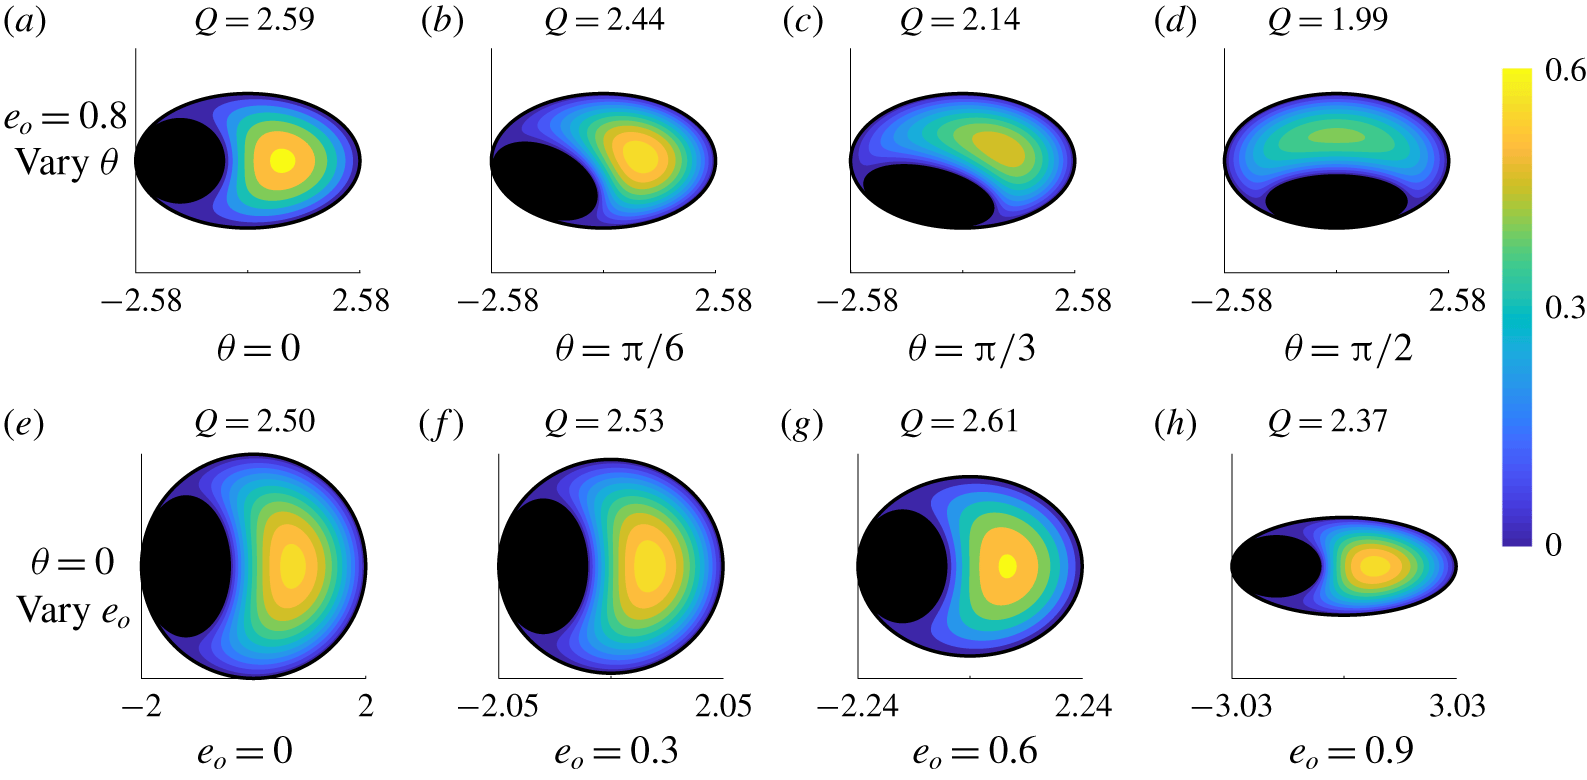
Dimensionless velocity colourmaps with flux values,  $Q$, for ellipses of equal eccentricities and orientations. Here
 $R_{o}=2$. Axes are in
 $(x,y)$ coordinates and these vary with eccentricity so that the available space for fluid flow is constant. Colour bars reflect different velocity values within the domains. The direction of the axis of minimal resistance,
 $\boldsymbol{k}_{min}$, is indicated by the dashed white line on each diagram. This will be discussed in § 4. Panels (a–d) show the effect of offset,
 $\unicode[STIX]{x1D719}$, for
 $e=0.8$ and
 $\unicode[STIX]{x1D703}=0$. Offset values are (a)
 $\unicode[STIX]{x1D719}=0.01$, (b)
 $\unicode[STIX]{x1D719}=0.35$, (c)
 $\unicode[STIX]{x1D719}=0.7$ and (d)
 $\unicode[STIX]{x1D719}=0.99$. Panels (e–h) show the effect of angular position,
 $\unicode[STIX]{x1D703}$, for
 $e=0.8$ and
 $\unicode[STIX]{x1D719}=0.99$. Angular position values are (a)
 $\unicode[STIX]{x1D703}=0$, (b)
 $\unicode[STIX]{x1D703}=\unicode[STIX]{x03C0}/6$, (c)
 $\unicode[STIX]{x1D703}=\unicode[STIX]{x03C0}/3$ and (d)
 $\unicode[STIX]{x1D703}=\unicode[STIX]{x03C0}/2$. Panels (i–l) show the effect of eccentricity,
 $e$, for
 $\unicode[STIX]{x1D719}=0.99$ and
 $\unicode[STIX]{x1D703}=0$. Eccentricity values are (a)
 $e=0$, (b)
 $e=0.3$, (c)
 $e=0.6$ and (d)
 $e=0.9$.

In figure 5(a–d) we fix  $e=0.8$ and
 $\unicode[STIX]{x1D703}=0$, and plot the velocity profiles (with corresponding flux values indicated) for
 $\unicode[STIX]{x1D719}=0.01$,
 $\unicode[STIX]{x1D719}=0.35$,
 $\unicode[STIX]{x1D719}=0.7$ and
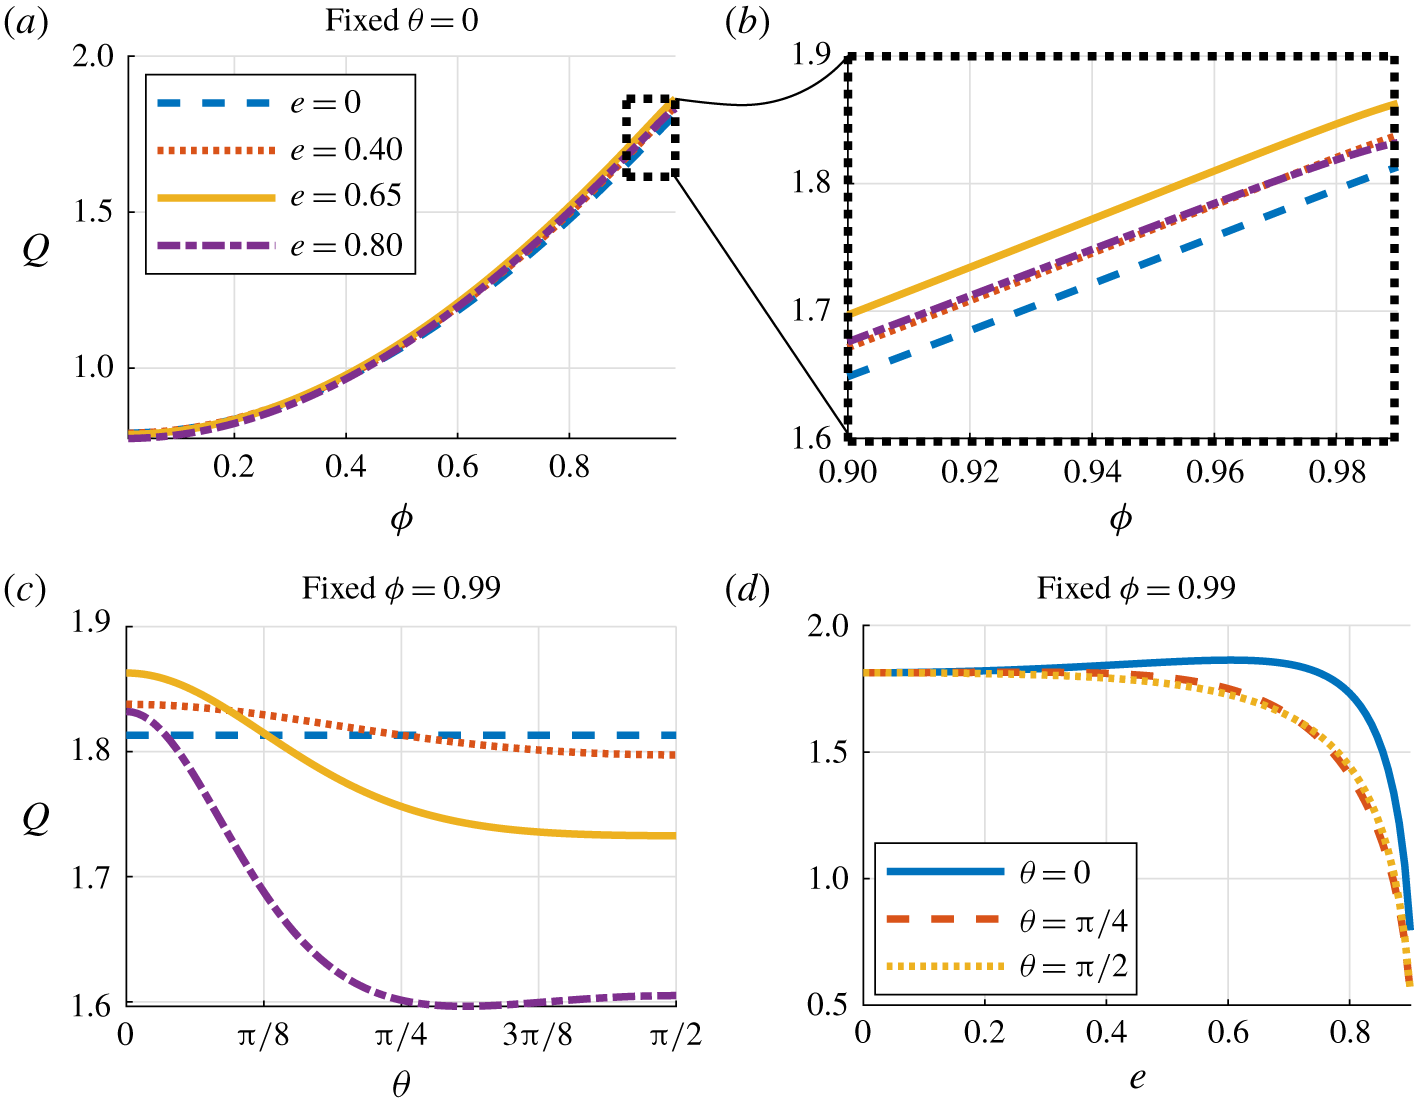
 $\unicode[STIX]{x1D719}=0.99$. We observe that
 $Q$ increases with
 $\unicode[STIX]{x1D719}$, a result previously known for
 $e=0$ (Piercy et al. Reference Piercy, Hooper and Winny1933; Redberger Reference Redberger1962). The effects of
 $\unicode[STIX]{x1D703}$ and
 $e$ on
 $Q$ are less intuitive. In figure 5(e–h) we fix
 $e=0.8$ and
 $\unicode[STIX]{x1D719}=0.99$ and vary
 $\unicode[STIX]{x1D703}$, plotting the associated velocity colour maps for
 $\unicode[STIX]{x1D703}=0$,
 $\unicode[STIX]{x1D703}=\unicode[STIX]{x03C0}/6$,
 $\unicode[STIX]{x1D703}=\unicode[STIX]{x03C0}/3$ and
 $\unicode[STIX]{x1D703}=\unicode[STIX]{x03C0}/2$. The flux is largest for
 $\unicode[STIX]{x1D703}=0$ and smallest for
 $\unicode[STIX]{x1D703}=\unicode[STIX]{x03C0}/3$ demonstrating, for the chosen parameters, non-monotonicity of
 $Q$ with
 $\unicode[STIX]{x1D703}$. We vary
 $e$ in figure 5(i–l) for fixed
 $\unicode[STIX]{x1D703}=0$ and
 $\unicode[STIX]{x1D719}=0.99$. The flux is largest for
 $e=0.6$ and smallest for
 $e=0.9$, also demonstrating, for the chosen parameters, non-monotonicity of
 $Q$ with
 $e$. For completeness, line plots of
 $Q$ as a function of independent variation of
 $e$,
 $\unicode[STIX]{x1D719}$ and
 $\unicode[STIX]{x1D703}$ can be found in appendix C.
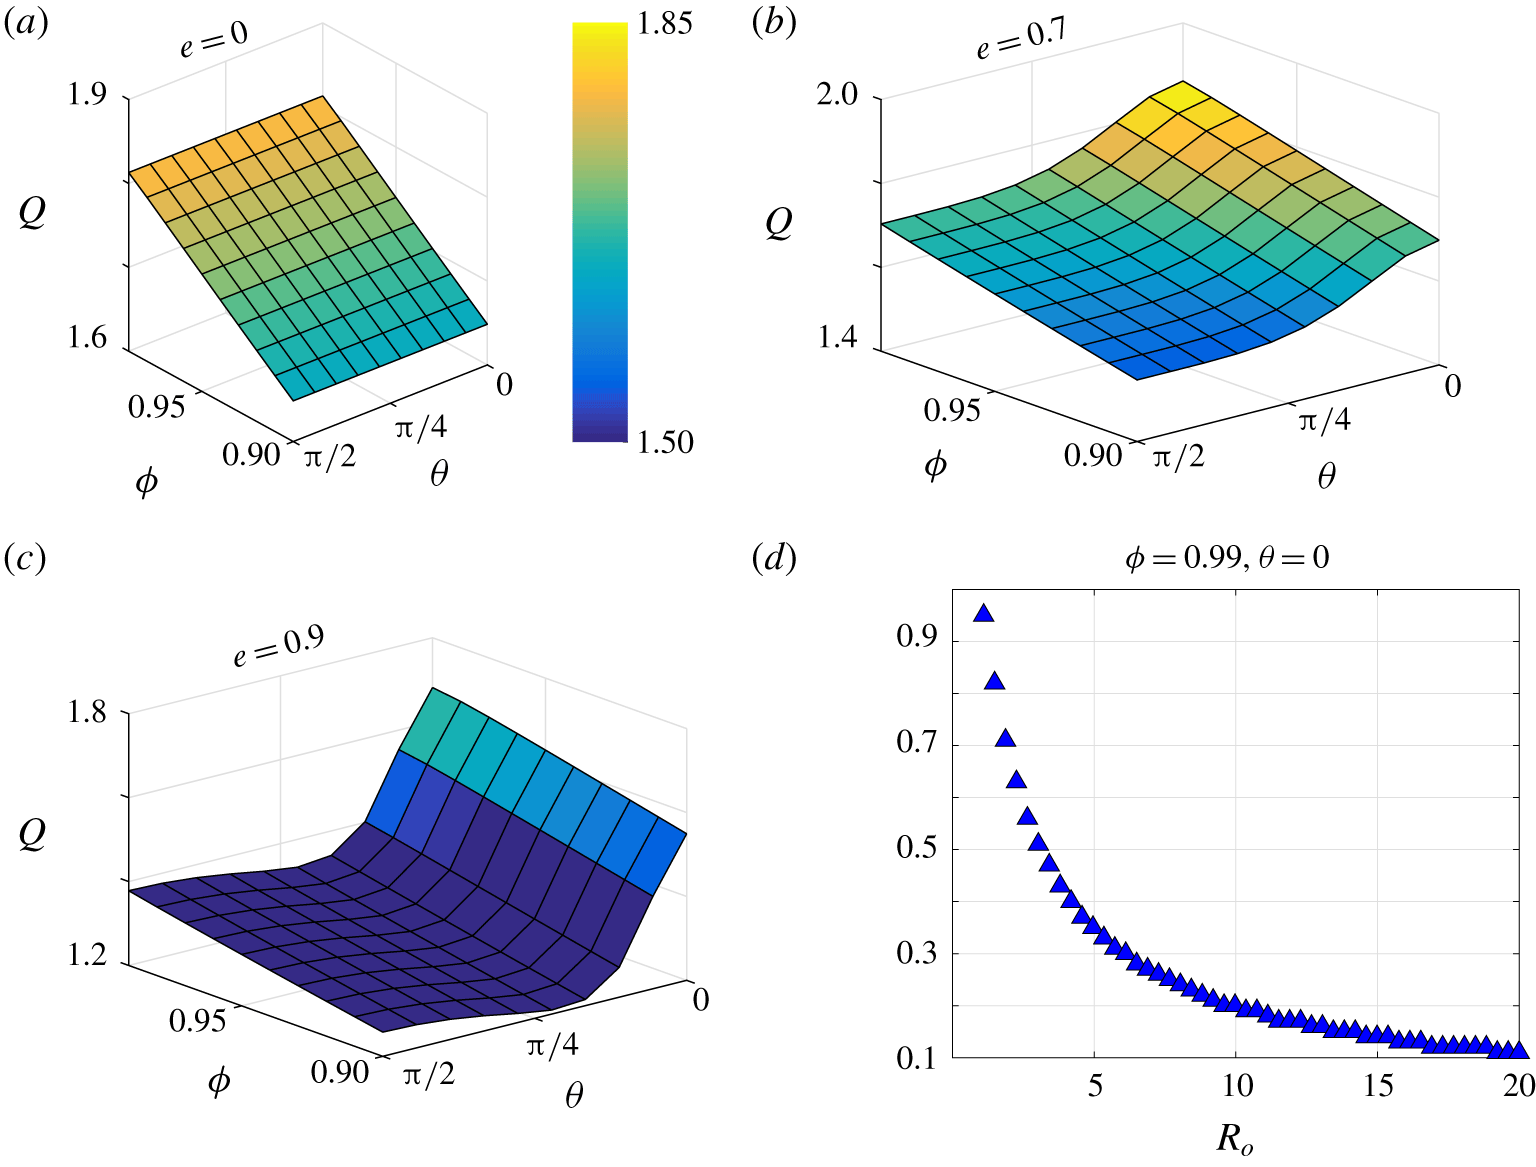
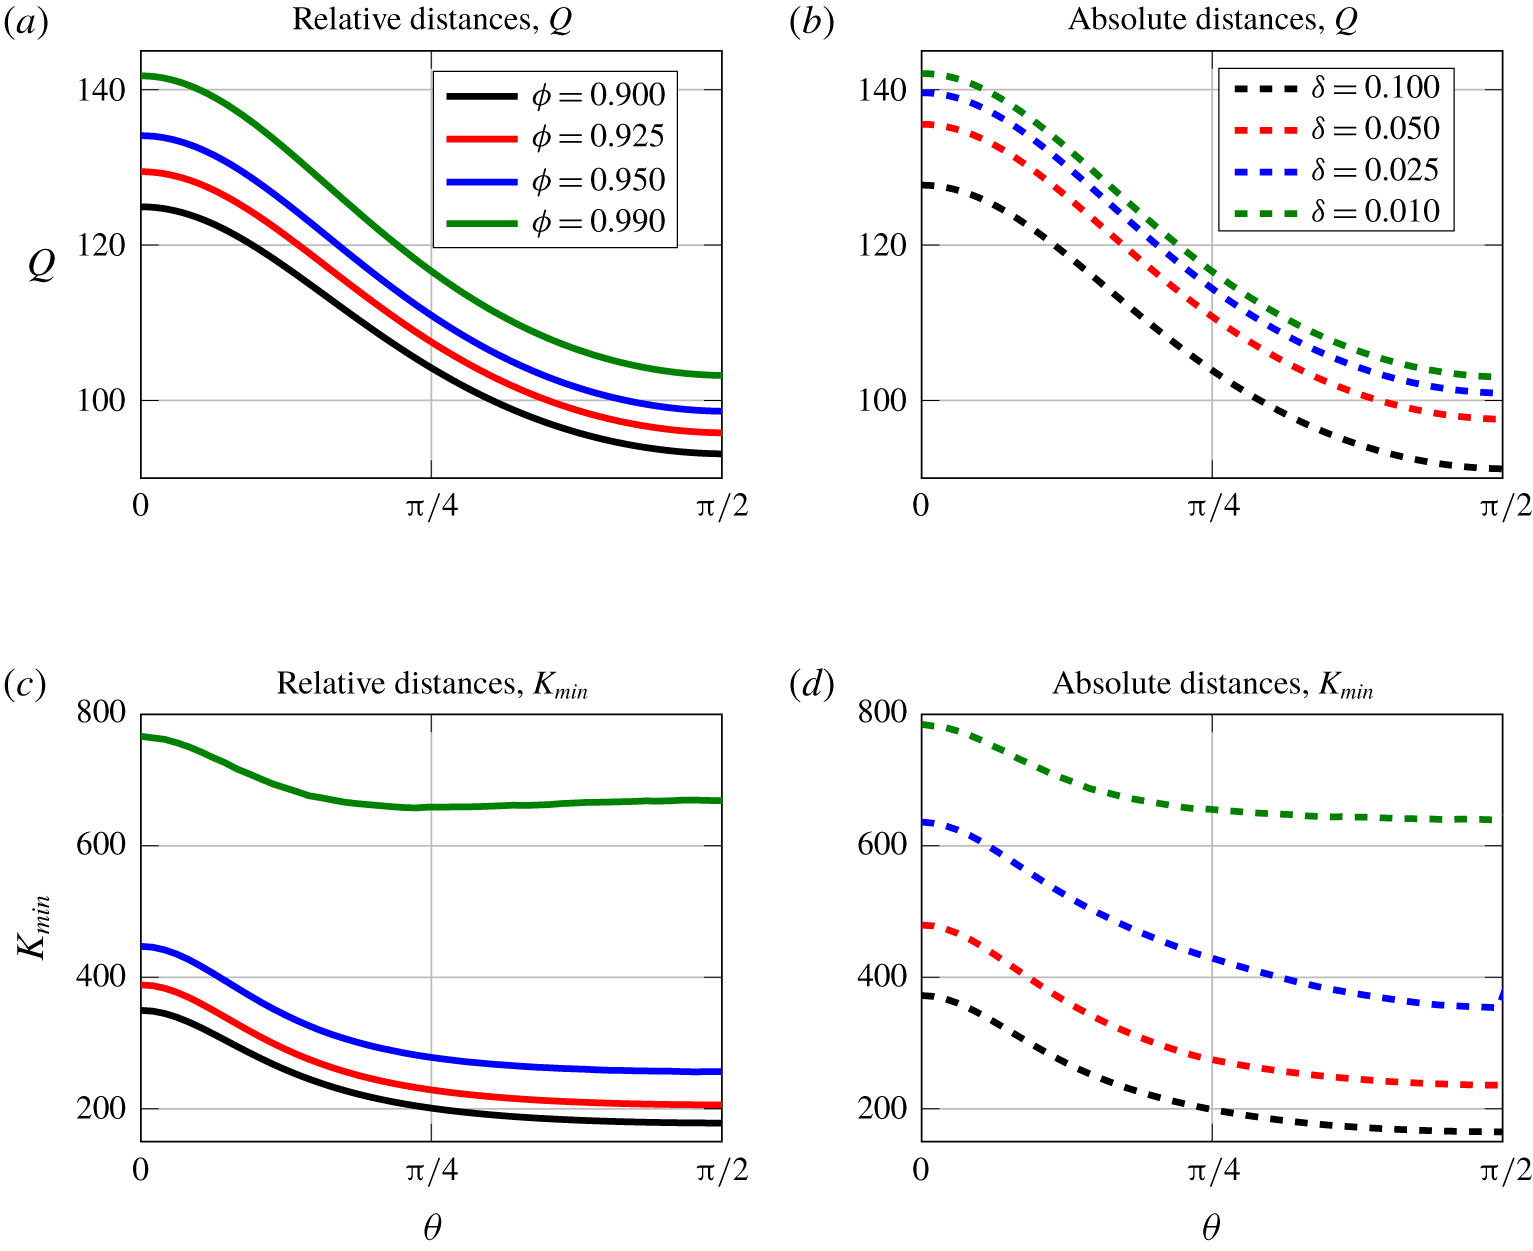
In figures 6(a)–6(c), we show surface plots of  $Q$ in
 $(\unicode[STIX]{x1D719},\unicode[STIX]{x1D703})$ space for three different eccentricities:
 $e=0$,
 $e=0.7$ and
 $e=0.9$, respectively. Note that, as
 $Q$ varies most significantly with
 $\unicode[STIX]{x1D719}$, we have restricted to
 $0.9\leqslant \unicode[STIX]{x1D719}\leqslant 0.99$ to isolate the effects of
 $\unicode[STIX]{x1D703}$ and
 $e$. When
 $e=0$ (figure 6a),
 $Q$ is independent of
 $\unicode[STIX]{x1D703}$ due to the rotational symmetry of the domain, and increases monotonically with
 $\unicode[STIX]{x1D719}$. For eccentric domains,
 $e=0.7$ and
 $e=0.9$ (figures 6b and 6c, respectively),
 $Q$ is minimal at an intermediate value of
 $\unicode[STIX]{x1D703}$ and
 $\unicode[STIX]{x1D719}=0.9$ (the smallest
 $\unicode[STIX]{x1D719}$ value plotted). The maximum
 $Q$ is seen in figure 6(b) for
 $e=0.7$, further validating the existence of a non-zero eccentricity value that maximises flux,
 $\text{e}^{max}$. This existence of a non-zero eccentricity at which flux is maximised may be of particular interest from an engineering design point of view (Williams et al. Reference Williams, Turney, Rauniyar, Harrah, Waters and Moulton2019a). However, it is noteworthy that the optimal eccentricity itself will change based on the outer geometry. We plot
 $\text{e}^{max}$ as a function of
 $R_{o}$ in figure 6(d). As
 $R_{o}\rightarrow \infty$,
 $\text{e}^{max}\rightarrow 0$. As
 $R_{o}$ characterises the ratio between outer and inner cross-sectional areas, the limit as
 $R_{o}\rightarrow \infty$ corresponds to a negligible obstruction within the channel, and hence, the maximum flux will be attained for a circular cross-section (Williams et al. Reference Williams, Turney, Rauniyar, Harrah, Waters and Moulton2019a).
Surface plots (a–c) give the dimensionless flow rate,  $Q$, as a function of both offset,
 $\unicode[STIX]{x1D719}$, and angular position
 $\unicode[STIX]{x1D703}$ of the inner ellipse for three different eccentricity values: (a)
 $e=0$, (b)
 $e=0.7$ and (c)
 $e=0.9$. Here
 $R_{o}=2$. Panel (d) gives
 $\text{e}^{max}$ as a function of the characteristic radius
 $R_{o}$. The
 $\text{e}^{max}$ value is calculated as the one that produces maximum flow over 100 values from
 $0.01\leqslant e\leqslant 0.99$ for each radius ratio.

In this section we have determined that for equal eccentricities and orientations of the outer and inner ellipses, there is a position for the inner ellipse and a non-zero eccentricity value that maximises flux. We note that this may not be the configuration that maximises flux for all values of  $e_{i}$,
 $e_{o}$,
 $X$,
 $Y$ and
 $\unicode[STIX]{x1D6E9}$, and we consider this global optimisation problem in more detail in the following section.
3.4 Optimal geometry for axial flow
When solving for axial flow in § 3 we considered three reduced geometric parameter spaces: (i) circle in ellipse, (ii) ellipse in circle and (iii) ellipse in ellipse of the same eccentricity and orientation. We found, in each case, eccentricity values and positions for the inner rod that maximised  $Q$. In this section, we will relax all previous assumptions on ellipse eccentricity and explore finding a global optimal geometry for ellipses of fixed cross sectional area,
 $R_{o}=2$.
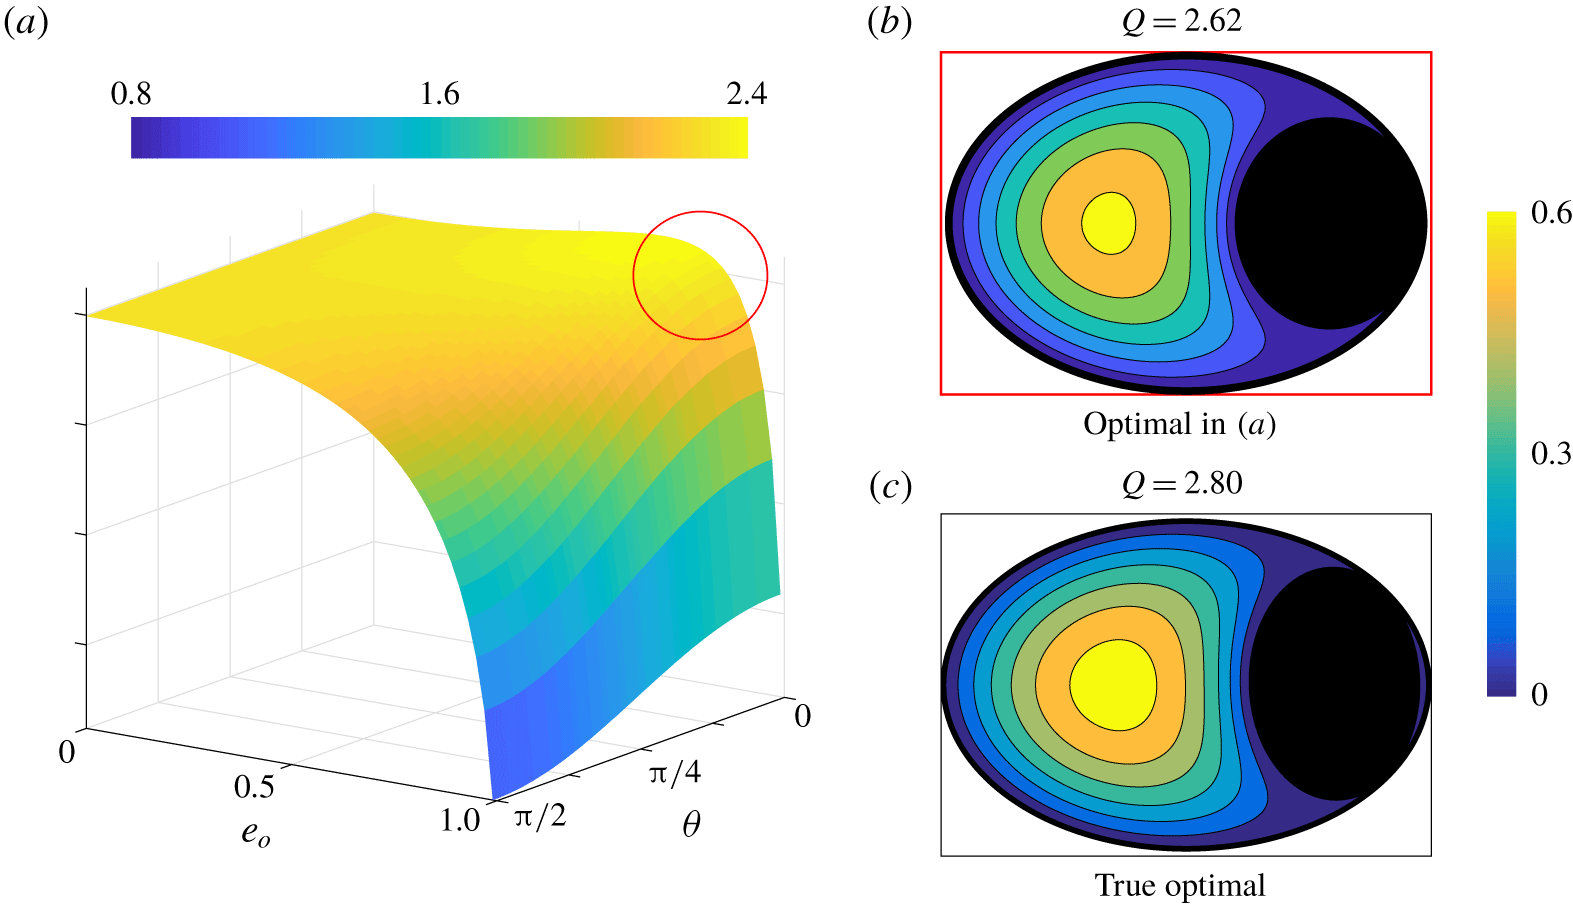
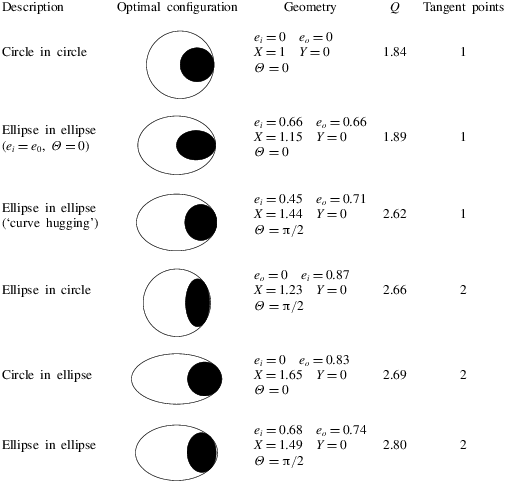
For all configurations previously considered, we demonstrated that axial flow resistance was lowered by increasing the distance between the centres of the inner and outer ellipses. Intuitively, we might expect that the optimal configuration is one where the inner ellipse touches the boundary of the outer ellipse and with matching curvature, i.e. when the inner ellipse ‘hugs’ the outer (although this was shown not to be the case for configuration I in § 3.1). This assumption enables a reduced parameter space that can be approached analytically (see appendix D). In figure 7(a) we show a surface plot of  $Q$ as a function of
 $e_{o}$ and
 $\unicode[STIX]{x1D703}$ produced by this calculation. We see that a global maximum occurs at
 $\unicode[STIX]{x1D703}=0$ and
 $e_{o}\approx 0.71$ with corresponding
 $Q=2.62$ (indicated by the red circle and corresponding flow profile figure 7b). (At this maximum, we also have
 $e_{i}\approx 0.45$,
 $\unicode[STIX]{x1D6E9}=0$.)
A plot of  $Q$ as a function of
 $e_{o}$ and
 $\unicode[STIX]{x1D703}$ for
 $R_{o}=2$. Here the inner ellipse touches the outer boundary tangentially at a single point, matching curvature. The red circle indicates the presence of a global maximum.

The optimal configuration in figure 7(a) shows a nearly 40 % improvement in flux over the optimal configuration computed in § 3.3. However, it is still not sufficient to claim this as the global optimum for ellipse geometries. In fact, the results in figure 3(a) suggested that a ‘curve-hugging’ configuration may not be optimal. Motivated by this, we relax assumptions about how the ellipses meet at the boundary and formulate an optimisation problem to traverse the full parameter space. To this end, we define a vector,  $\boldsymbol{g}$, containing the five parameters governing the geometry of the domain:
 $$\begin{eqnarray}\boldsymbol{g}=(e_{i},e_{o},X,Y,\unicode[STIX]{x1D6E9})^{\text{T}}.\end{eqnarray}$$
The boundaries of the inner and outer ellipses,  $\unicode[STIX]{x1D6E4}_{i}$ and
 $\unicode[STIX]{x1D6E4}_{o}$, are
 $$\begin{eqnarray}\boldsymbol{x}^{\text{T}}\unicode[STIX]{x1D63C}\boldsymbol{x}=0,\quad \boldsymbol{x}^{\text{T}}\unicode[STIX]{x1D63D}\boldsymbol{x}=0,\end{eqnarray}$$
respectively, where  $\boldsymbol{x}^{\text{T}}=(x,y,1)$ and matrices
 $\unicode[STIX]{x1D63C}$ and
 $\unicode[STIX]{x1D63D}$ are functions of
 $\boldsymbol{g}$. Thus, we seek the solution to the optimisation problem
 $$\begin{eqnarray}\min _{\boldsymbol{g}}-Q,\quad \text{subject to}~\boldsymbol{c}\geqslant 0,\end{eqnarray}$$
where  $\boldsymbol{c}$ is a vector of six nonlinear constraints, dependent on
 $\unicode[STIX]{x1D63C}$ and
 $\unicode[STIX]{x1D63D}$ and hence
 $\boldsymbol{g}$, that ensure
 $\unicode[STIX]{x1D6E4}_{i}$ is enclosed by
 $\unicode[STIX]{x1D6E4}_{o}$ (see appendix E for more details). We solve (2.24) in FEniCS (Alnaes et al. Reference Alnaes, Blechta, Hake, Johansson, Kehlet, Logg, Richardson, Ring, Rognes and Wells2015), and implement MATLAB’s optimisation routine, fmincon, to solve the optimisation problem (3.8) with an interior-point method from eight randomly generated starting points in the feasible five-dimensional parameter space. As the optimisation routine seeks local minima, a multi-start approach allows for global optimisation. The optimal geometry found through this method is shown in figure 7(c) with a corresponding flux,
 $Q\approx 2.80$. The geometric parameters, see (3.6), are
 $\boldsymbol{g}\approx (0.68,0.74,1.49,0,\unicode[STIX]{x03C0}/2)^{\text{T}}$. This global optimum gives a non-negligible (nearly 7 %) increase in flux compared with the ‘curve-hugging’ optimum. Indeed, rather than perfectly matching the geometries at the boundary, the global optimal geometry is tangent to the outer boundary in two locations (this was also true in the results in § 3.1). It is interesting to note that this divides the fluid domain into two separate regions, which may be connected to previous results (Ranger Reference Ranger1994, Reference Ranger1996) that demonstrate flux enhancement through creating multiply connected regions. Ranger (Reference Ranger1996) provides a short discussion on the mechanism whereby disconnected regions can lead to increased total flux, discussing the distribution of flux per unit area for flow through a circular pipe. As flux per unit area is low at the edge, removing these regions and replacing them with disconnected areas of higher flux may lead to enhanced flow.
4 Cross-sectional flow
We now turn attention to the cross-sectional flow problem, governed by the Stokes equations (2.11), (2.23), and the no-slip conditions (2.13a,b) and (2.14a). The objective is again to explore the impact of cross-sectional geometry within the configuration space of (i), (ii) and (iii); but here, the question is how the geometry impacts the resistance coefficients for cross-sectional rod motion.
We solve the equations numerically using a finite element method implemented in oomph-lib (Heil & Hazel Reference Heil, Hazel, Schäfer and Bungartz2006) (details in § A.2), and subsequently compute the dimensionless forces and torque on the rod due to the surrounding fluid via (2.28). We validate our numerical solution by comparing with analytical solutions for geometries where these are available in the literature.
We consider a cross-section of the domain illustrated in figure 2(i), where the rod is given a prescribed instantaneous velocity,  $\dot{\boldsymbol{X}}=({\dot{X}},{\dot{Y}})$ in the
 $(x,y)$ plane and a rotation,
 $\dot{\unicode[STIX]{x1D6E9}}$ about the
 $z$-axis. The resulting forces and torques,
 $\boldsymbol{F}=(F_{x},F_{y})$ and
 $\unicode[STIX]{x1D70F}$, are linearly related to
 $({\dot{X}},{\dot{Y}})$ and
 $\dot{\unicode[STIX]{x1D6E9}}$ by a symmetric resistance matrix
 $$\begin{eqnarray}\left[\begin{array}{@{}c@{}}F_{x}\\ F_{y}\\ \unicode[STIX]{x1D70F}_{z}\end{array}\right]=-\left[\begin{array}{@{}ccc@{}}\unicode[STIX]{x1D612}_{xx} & \unicode[STIX]{x1D612}_{xy} & \unicode[STIX]{x1D60A}_{x}\\ \unicode[STIX]{x1D612}_{xy} & \unicode[STIX]{x1D612}_{yy} & \unicode[STIX]{x1D60A}_{y}\\ \unicode[STIX]{x1D60A}_{x} & \unicode[STIX]{x1D60A}_{y} & \unicode[STIX]{x1D608}_{zz}\end{array}\right]\left[\begin{array}{@{}c@{}}{\dot{X}}\\ {\dot{Y}}\\ \dot{\unicode[STIX]{x1D6E9}}\end{array}\right],\end{eqnarray}$$
as discussed in §§ 1.2 and 2.4. If  $\dot{\unicode[STIX]{x1D6E9}}=0$ then
 $$\begin{eqnarray}\left[\begin{array}{@{}c@{}}F_{x}\\ F_{y}\end{array}\right]=-\left[\begin{array}{@{}cc@{}}\unicode[STIX]{x1D612}_{xx} & \unicode[STIX]{x1D612}_{xy}\\ \unicode[STIX]{x1D612}_{xy} & \unicode[STIX]{x1D612}_{yy}\end{array}\right]\left[\begin{array}{@{}c@{}}{\dot{X}}\\ {\dot{Y}}\end{array}\right].\end{eqnarray}$$
The eigenvectors of the  $2\times 2$ matrix in (4.2) are the directions of minimum and maximum opposing forces experienced by the rod due to the flow. We will refer to these as the directions of minimum and maximum resistance. The corresponding eigenvalues give the magnitudes of the opposing forces that result from moving in the directions of minimum and maximum resistance with unit velocity. These values are non-negative (see § 1.2) and are given by
 $$\begin{eqnarray}\displaystyle & \displaystyle K_{max}=(1/2)\left(\unicode[STIX]{x1D612}_{xx}+\unicode[STIX]{x1D612}_{yy}+\sqrt{(\unicode[STIX]{x1D612}_{xx}-\unicode[STIX]{x1D612}_{yy})^{2}+4\unicode[STIX]{x1D612}_{xy}^{2}}\right), & \displaystyle\end{eqnarray}$$
 $$\begin{eqnarray}\displaystyle & \displaystyle K_{min}=(1/2)\left(\unicode[STIX]{x1D612}_{xx}+\unicode[STIX]{x1D612}_{yy}-\sqrt{(\unicode[STIX]{x1D612}_{xx}-\unicode[STIX]{x1D612}_{yy})^{2}+4\unicode[STIX]{x1D612}_{xy}^{2}}\right), & \displaystyle\end{eqnarray}$$
 $$\begin{eqnarray}\boldsymbol{k}_{max,min}=(\unicode[STIX]{x1D612}_{xy},K_{max,min}-\unicode[STIX]{x1D612}_{xx}).\end{eqnarray}$$
The six unique scalars in the resistance matrix (4.1) can be computed by imposing
 $$\begin{eqnarray}\displaystyle & \displaystyle \dot{\boldsymbol{X}}=(1,0),\quad \dot{\unicode[STIX]{x1D6E9}}=0,\quad \rightarrow \quad \unicode[STIX]{x1D612}_{xx},\unicode[STIX]{x1D612}_{xy}~\text{and}~\unicode[STIX]{x1D60A}_{x}, & \displaystyle\end{eqnarray}$$
 $$\begin{eqnarray}\displaystyle & \dot{\boldsymbol{X}}=(0,1),\quad \dot{\unicode[STIX]{x1D6E9}}=0,\quad \rightarrow \quad \unicode[STIX]{x1D612}_{yy},\unicode[STIX]{x1D612}_{xy}~\text{and}~\unicode[STIX]{x1D60A}_{y}, & \displaystyle\end{eqnarray}$$
 $$\begin{eqnarray}\displaystyle & \displaystyle \dot{\boldsymbol{X}}=(0,0),\quad \dot{\unicode[STIX]{x1D6E9}}=1,\quad \rightarrow \quad \unicode[STIX]{x1D60A}_{x},\unicode[STIX]{x1D60A}_{y}~\text{and}~\unicode[STIX]{x1D608}_{zz}, & \displaystyle\end{eqnarray}$$
 $\unicode[STIX]{x1D612}_{xy}$,
 $\unicode[STIX]{x1D60A}_{x}$, and
 $\unicode[STIX]{x1D60A}_{y}$ can each be determined by two separate calculations, and we perform both as validation (to within numerical error).
4.1 (i) Circle in ellipse
The analytical solution for Stokes flow between concentric and offset circular cylinders demonstrates a dependence of the forces and torque experienced by the rod on the geometry of the domain (Finn & Cox Reference Finn and Cox2001). We first consider how these results change when the bounding cylinder is elliptical. To limit the candidate geometries, we position the rod along the  $x$-axis, i.e.
 $\boldsymbol{X}=(X,0)$. We fix the cross-sectional area and set
 $R_{o}=2$.
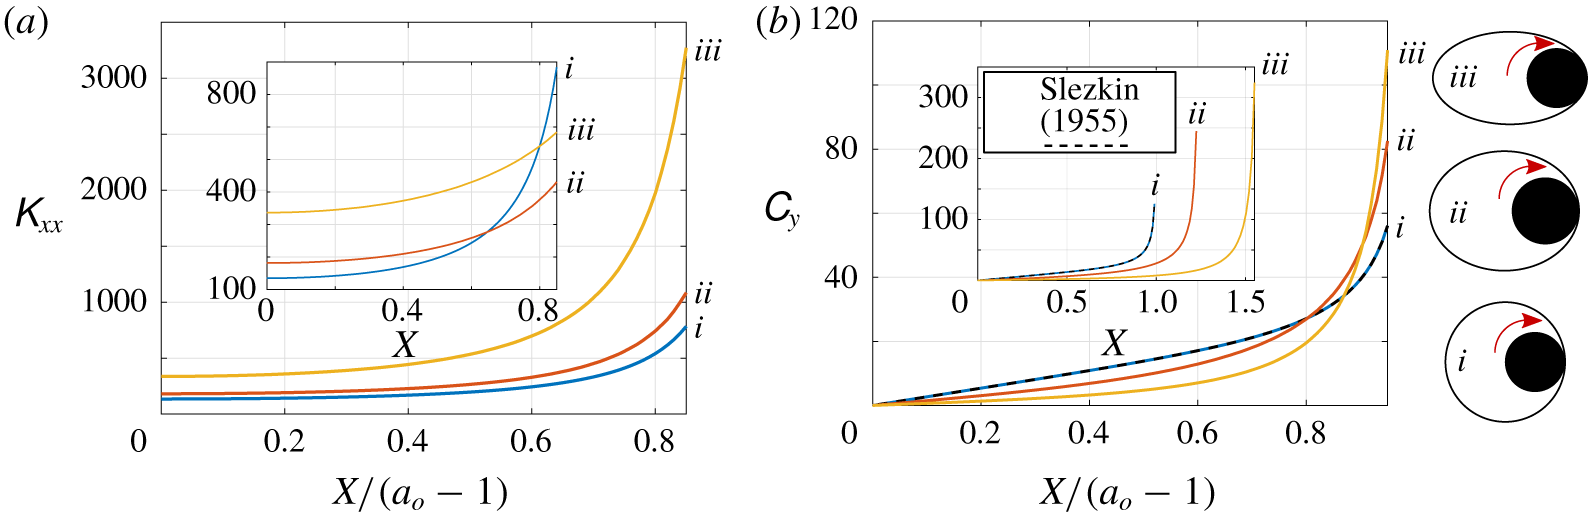
For a circular rod translating within a circular cylinder,  $\unicode[STIX]{x1D612}_{xx}$ and
 $\unicode[STIX]{x1D612}_{yy}$ increase as the rod approaches the edge of the bounding cylinder, and
 $\unicode[STIX]{x1D612}_{xy}=0$, due to the symmetry of the domain (Slezkin Reference Slezkin1955). As expected, we find that for
 $e_{o}>0$, the same behaviour occurs. The effect of
 $e_{o}$ on the resistance coefficients is not quite so straightforward as the effect of position – as
 $e_{o}$ increases for fixed
 $X$, the proximity of the rod to the boundary in the vertical direction decreases while the distance to the boundary in the horizontal direction increases, and at non-equal rates. Due to these competing features,
 $\unicode[STIX]{x1D612}_{yy}$ exhibits an interesting dependence on
 $e_{o}$ for
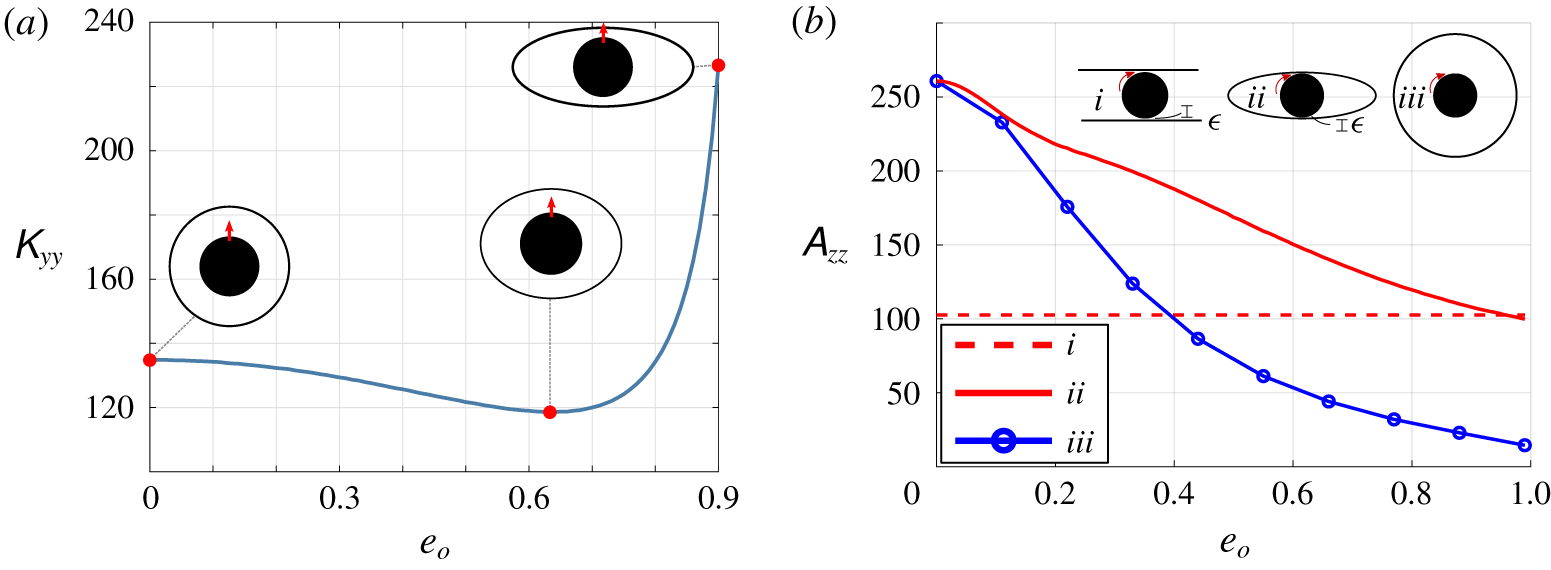
 $X=0$. In figure 8(a), we plot
 $\unicode[STIX]{x1D612}_{yy}$ as a function of
 $e_{o}$ for a centred rod, and we observe a non-monotonic behaviour, highlighting the complexity of boundary interactions. Comparing resistance coefficients for
 $X\neq 0$ adds yet another complexity: as the range of feasible
 $X$ values increases with
 $e_{o}$ (as long as the rod can still fit tangent to the vertex of the outer cylinder), we can either compare values at absolute,
 $X$, or relative,
 $X/(a_{o}-1)$, distance from the centre, which qualitatively affects the observed trends. We find that, depending on the metric used,
 $\unicode[STIX]{x1D612}_{xx}$,
 $\unicode[STIX]{x1D60A}_{y}$, and
 $\unicode[STIX]{x1D608}_{zz}$ can also be non-monotonically related to
 $e_{o}$ when the cylinder is offset (results shown in appendix F). We note that
 $\unicode[STIX]{x1D60A}_{x}=0$ for a rod centred on the
 $x$-axis, due to arguments of symmetry.
If, instead of fixing cross-sectional area, we fix the gap between the rod and the cylinder, the domain approaches one of a rod between parallel plates as  $e_{o}\rightarrow 1$. An asymptotic approximation to the Stokes force and torque on a cylinder rotating between parallel plates was obtained by Yang et al. (Reference Yang, Wolgemuth and Huber2013), where the ratio of gap width to cylinder radius defines the small parameter,
 $\unicode[STIX]{x1D716}$. To test whether the resistance coefficients for a rod in an elliptic cylinder approach those for a rotating rod between parallel plates (Yang et al. Reference Yang, Wolgemuth and Huber2013), we consider a rod at
 $X=0$ in an elliptic cylinder of fixed minor axis,
 $b_{o}=1.025$, which sets the gaps between the rod and the cylinder at
 $x=0$, to be 0.025. In figure 8(b) we plot
 $\unicode[STIX]{x1D608}_{zz}$ as a function of outer eccentricity (line ii), and we see that as
 $e_{o}\rightarrow 1$ the resistance approaches the value for parallel plates with
 $\unicode[STIX]{x1D716}=0.025$ (Yang et al. Reference Yang, Wolgemuth and Huber2013) (line i). As we increase
 $e_{o}$ with fixed minor axis, the cross-sectional area of the elliptic cylinder is also increasing. Thus, as a further geometric comparison, line iii plots
 $\unicode[STIX]{x1D608}_{zz}$ for a rod centred in a circular cylinder with increasing and equivalent cross-sectional area (i.e. for each
 $e_{o}$, the bounding circle has cross-sectional area equal to that of an ellipse of eccentricity
 $e_{o}$ and minor axis
 $b_{o}=1.025$). Although
 $\unicode[STIX]{x1D608}_{zz}$ decreases with
 $e_{o}$ due to the increase in cross-sectional area available for the fluid,
 $\unicode[STIX]{x1D608}_{zz}$ is larger when the outer boundary is an ellipse compared to a circle of the same cross-sectional area.
Results for  $R_{o}=2$. (a) Rod translating with unit velocity in the
 $y$-direction, centred at
 $(0,0)$.
 $\unicode[STIX]{x1D612}_{yy}$ is plotted as a function of
 $e_{o}$. Inset schematics are for (left to right)
 $e_{o}=0$,
 $e_{o}=0.63$ and
 $e_{o}=0.9$. (b) Plot of
 $\unicode[STIX]{x1D608}_{zz}$ for a circular rotating rod centred at
 $(0,0)$. The rod is rotating: (iv) between parallel plates with gap size
 $\unicode[STIX]{x1D716}=0.025$ (Yang et al. Reference Yang, Wolgemuth and Huber2013) (v) within an outer elliptic cylinder with
 $b_{o}=1.025$ (
 $R_{o}$ not fixed) (vi) within an outer circular cylinder of radius
 $R_{o}=1.025(1-e_{o}^{2})^{-1/4}$. Solution obtained from (1.3c).

4.2 (ii) Ellipse in circle
The next domain we consider is an ellipse in a bounding circle. As in § 3.2, due to the rotational symmetry of the outer domain, the number of unique combinations of position and orientation of the rod can be reduced; it is sufficient to consider the rod centred at  $\boldsymbol{X}=(X,0)$ and to vary
 $X$,
 $\unicode[STIX]{x1D6E9}$ and
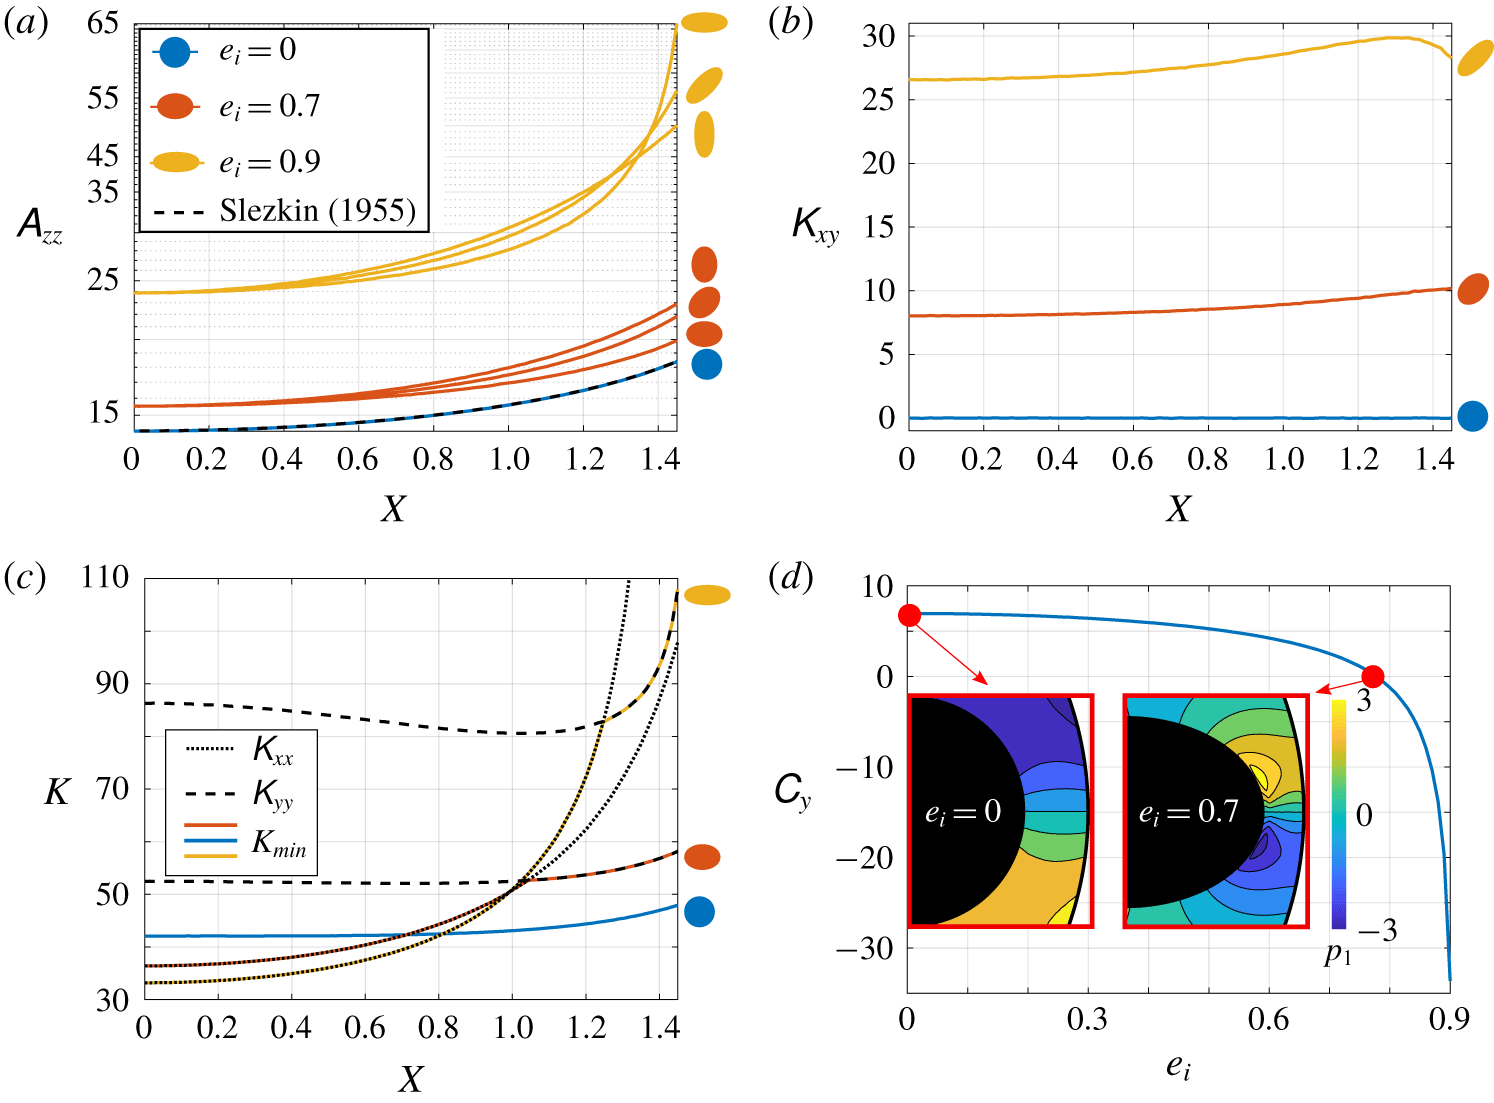
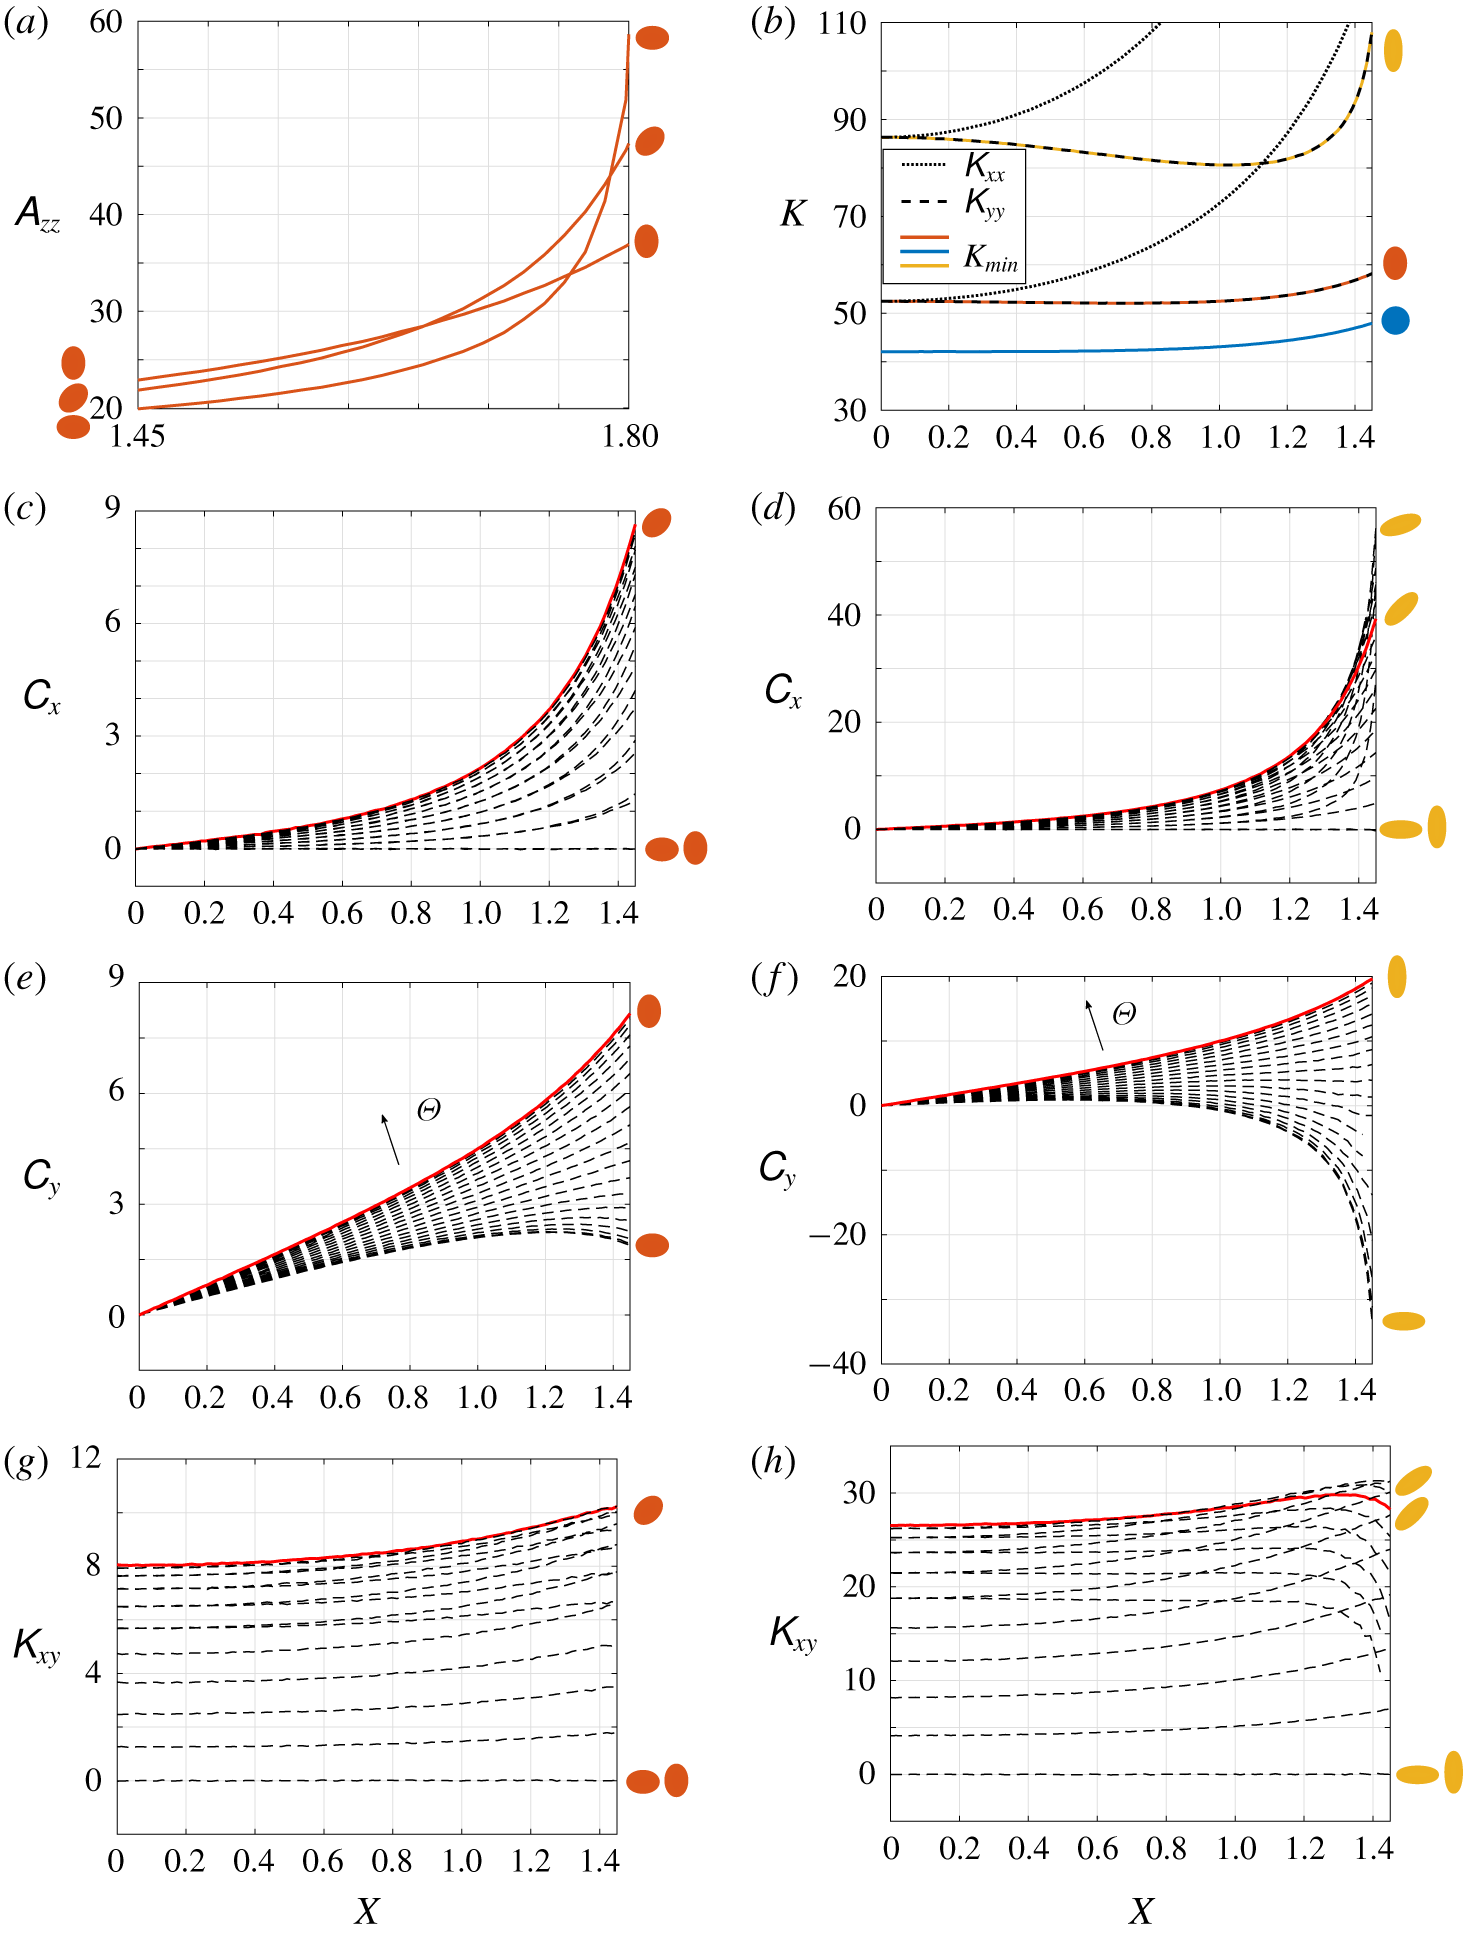
 $e_{i}$. In figure 9 we investigate how the resistance coefficients are influenced by the shape of the rod’s cross-section and its orientation and proximity to the outer boundary. In figure 9(a–c), results are plotted as functions of absolute offset, and the orientation of the rod,
 $\unicode[STIX]{x1D6E9}$, as well as its position,
 $X$, determine its proximity to the outer cylinder’s boundary, and in a non-trivial way.
Panels (a) and (b) give  $\unicode[STIX]{x1D608}_{zz}$ and
 $\unicode[STIX]{x1D612}_{xy}$, respectively, as functions of
 $X$ for
 $e_{i}=0$,
 $e_{i}=0.7$ and
 $e_{i}=0.9$ and
 $\unicode[STIX]{x1D6E9}=0$,
 $\unicode[STIX]{x1D6E9}_{0}=\unicode[STIX]{x03C0}/4$ and
 $\unicode[STIX]{x1D6E9}=\unicode[STIX]{x03C0}/2$. In (b),
 $\unicode[STIX]{x1D612}_{xy}$ is identically zero for
 $\unicode[STIX]{x1D6E9}=0$ and
 $\unicode[STIX]{x1D6E9}=\unicode[STIX]{x03C0}/2$, so these are not shown as they coincide with the line for
 $e_{i}=0$. Panel (c) displays
 $K_{min}$ for
 $\unicode[STIX]{x1D6E9}=0$ and
 $e_{i}=0$,
 $e_{i}=0.7$ and
 $e_{i}=0.9$. Panel (d) gives
 $C_{y}$ as a function of
 $e_{i}$ for
 $\unicode[STIX]{x1D6E9}=0$ and
 $X=1.45$. Colour maps of pressure
 $p_{1}$ near the bounding wall, due to an imposed angular velocity, are shown for
 $e_{i}=0$ and
 $e_{i}=0.7$ with the colour bar providing the magnitude of
 $p_{1}$, centred around
 $p_{1}=0$. All plots have a dimensionless outer radius of
 $R_{o}=3$.

We first consider resistance to rotation. We find that  $\unicode[STIX]{x1D608}_{zz}$ increases as a function of offset for fixed
 $e_{i}$ and
 $\unicode[STIX]{x1D6E9}$. Results are shown in figure 9(a) for three eccentricities,
 $e_{i}=0$,
 $e_{i}=0.7$ and
 $e_{i}=0.9$, oriented at
 $\unicode[STIX]{x1D6E9}=0$,
 $\unicode[STIX]{x1D6E9}=\unicode[STIX]{x03C0}/4$, and
 $\unicode[STIX]{x1D6E9}=\unicode[STIX]{x03C0}/2$. For fixed position and orientation, rotational resistance increases with eccentricity. Without boundary interactions,
 $\unicode[STIX]{x1D608}_{zz}$ would be independent of
 $\unicode[STIX]{x1D6E9}$; however, due to the presence of the bounding circular cylinder, for moderate
 $X\neq 0$,
 $\unicode[STIX]{x1D608}_{zz}$ is largest when
 $\unicode[STIX]{x1D6E9}=\unicode[STIX]{x03C0}/2$ and smallest when
 $\unicode[STIX]{x1D6E9}=0$. As evidenced by the crossing lines for
 $e_{i}=0.9$ in figure 9(a), when
 $X$ is sufficiently large, a rod oriented at
 $\unicode[STIX]{x1D6E9}=0$ receives the largest opposing torque, which is likely due to the proximity of the vertex of the major axis to the boundary. We note that, if we increase the
 $X$ range in figure 9(a), this effect is also seen for
 $e_{i}=0.7$. (Results shown in appendix F.)
Turning now to translational resistance, our results validate the intuition that when the major or minor axis of the rod’s cross-section is aligned both with the direction of motion and a radial line of the outer cylinder’s cross-section, the force on the rod acts parallel to its direction of motion, and the lift force is zero. Brenner (Reference Brenner1962a) proved this to be true for the motion of a bounded arbitrary particle.
Of the three translational resistances, we first consider the lift force,  $\unicode[STIX]{x1D612}_{xy}$. We find, that for fixed
 $e_{i}$ and
 $X$ away from the boundary,
 $\unicode[STIX]{x1D612}_{xy}$ is maximised for
 $\unicode[STIX]{x1D6E9}=\unicode[STIX]{x03C0}/4$. Thus the outer cylinder does not seem to change classic results for an elliptic cylinder in an unbounded fluid (Lee & Leal Reference Lee and Leal1986). To see how the lift force changes with inner eccentricity, in figure 9(b) we fix the orientation at the maximal value
 $\unicode[STIX]{x1D6E9}=\unicode[STIX]{x03C0}/4$ for eccentricities
 $e_{i}=0$,
 $e_{i}=0.7$ and
 $e_{i}=0.9$, and plot
 $\unicode[STIX]{x1D612}_{xy}$ as a function of
 $X$. We find a significant increase in lift force with eccentricity, and also a non-monotonic relation with position in the case of
 $e_{i}=0.9$.
Next, we analyse  $\unicode[STIX]{x1D612}_{xx}$,
 $\unicode[STIX]{x1D612}_{yy}$ and
 $K_{min}$. For relatively small offset,
 $\unicode[STIX]{x1D612}_{xx}$ is smallest (and
 $\unicode[STIX]{x1D612}_{yy}$ largest) when
 $\unicode[STIX]{x1D6E9}=0$. We restrict ourselves to this orientation, and plot
 $\unicode[STIX]{x1D612}_{xx}$ (dotted line) and
 $\unicode[STIX]{x1D612}_{yy}$ (dashed line) as functions of
 $X$ for
 $e_{i}=0.7$ and
 $e_{i}=0.9$ in figure 9(c). An interesting feature is the non-monotonic behaviour of
 $\unicode[STIX]{x1D612}_{yy}$ with
 $X$. The solid coloured lines give the value of the minimum resistance,
 $K_{min}$. Looking particularly at
 $e_{i}=0.9$ we see that for small values of
 $X$,
 $K_{min}$ coincides with
 $\unicode[STIX]{x1D612}_{xx}$ (and thus the eigenvector
 $\boldsymbol{k}_{min}=\boldsymbol{i}$). However, near
 $X=1.2$ the lines
 $\unicode[STIX]{x1D612}_{xx}$ and
 $\unicode[STIX]{x1D612}_{yy}$ cross, and the direction of minimum resistance switches to be aligned with the
 $y$-axis. The same behaviour is seen for
 $e_{i}=0.7$, with the switching occurring at a smaller offset (near
 $X=1$). The solid lines denoting
 $K_{min}$ for each eccentricity also cross. When
 $X$ is small,
 $K_{min}$ is largest for
 $e_{i}=0$ and smallest for
 $e_{i}=0.9$ and vice versa for large
 $X$. Again, this can be explained by the significance of boundary interactions: far from the boundary the more eccentric ellipse has a direction of small resistance – its major axis – but closer to the boundary the major vertex is in closer proximity to the boundary, compared to ellipses of smaller eccentricity, hence the resistance in both the
 $x$- and
 $y$-directions rapidly increases. We have also demonstrated that for
 $\unicode[STIX]{x1D6E9}=\unicode[STIX]{x03C0}/2$,
 $\boldsymbol{k}_{min}$ is aligned with the
 $y$-axis for
 $e_{i}=0$,
 $e_{i}=0.7$ and
 $e_{i}=0.9$ (at least for
 $0\leqslant X\leqslant 1.45$). (Results shown in appendix F.)
Finally, we consider the coupling between translation and rotation. We find, for fixed  $e_{i}$ and
 $X$ away from the boundary,
 $\unicode[STIX]{x1D60A}_{x}$ is largest for
 $\unicode[STIX]{x1D6E9}=\unicode[STIX]{x03C0}/4$ and
 $C_{y}$ is largest for
 $\unicode[STIX]{x1D6E9}=\unicode[STIX]{x03C0}/2$. (Results shown in appendix F.) When the rod is oriented at
 $\unicode[STIX]{x1D6E9}=0$, there is coupling between rotation and translation in the
 $y$-direction (
 $C_{y}\neq 0$). This is known analytically for
 $e_{i}=0$ (Slezkin Reference Slezkin1955), and in this classic case,
 $C_{y}$ increases monotonically with
 $X$. Interestingly, for more eccentric ellipses, this is no longer true; in fact,
 $C_{y}$ can change sign as a function of position along the
 $X$-axis. Alternatively, this behaviour can be illustrated by plotting
 $C_{y}$ as a function of eccentricity for fixed
 $X$ sufficiently close to the outer boundary. This is shown in figure 9 for
 $X=1.45$ (the furthest-right position in figure 9a–c). We observe that
 $C_{y}$ decreases as a function of
 $e_{i}$, changing sign from positive to negative. To explain this behaviour, consider a rotating rod with imposed angular velocity, in which case
 $C_{y}$ characterises the induced translational force in the
 $y$-direction. Example pressure profiles for
 $e_{i}=0$ and
 $e_{i}=0.775$ near the proximal boundary are shown in the insets, and these show that the pressure drop in the lubrication layer between the rod and the outer boundary changes direction as a function of
 $e_{i}$. Due to the proximity to the boundary, we can appeal to Reynolds’ lubrication equation to understand this inversion in terms of the behaviour of the fluid in the lubrication layer: for a circular surface rotating near a fixed plane, the pressure drop is in the opposite direction compared to the pressure drop for a highly curved surface moving parallel to the plane (Wannier Reference Wannier1950). For our system, rotating an ellipse of high eccentricity is analogous to moving the vertex (and point closest to the boundary) parallel to the boundary, whereas rotating an ellipse of small eccentricity does not change significantly the minimal distance to the boundary and hence behaves more like a rotating circle.
4.3 (iii) Ellipse in ellipse
In this section we revisit the configuration considered in § 3.3, with both the rod and bounding cylinder having elliptical cross-sections of the same eccentricity,  $e$, and orientation (
 $\unicode[STIX]{x1D6E9}=0$). We set
 $R_{o}=2$, and parameterise
 $\boldsymbol{X}$ by offset
 $\unicode[STIX]{x1D719}$ and angular position
 $\unicode[STIX]{x1D703}$, illustrated in figure 4. Returning to figure 5, the direction of minimum resistance is marked with a dashed white line. We see that when the rod is centred in the outer cylinder,
 $\boldsymbol{k}_{min}$ lies along the major axis of the ellipse. As we move towards the wall, this direction switches to the minor axis, due to the build-up of pressure between the rod and the proximal edge of the outer cylinder. As we break symmetry and vary
 $\unicode[STIX]{x1D703}$,
 $\boldsymbol{k}_{min}$ no longer lies along an axis of symmetry of the inner ellipse and for
 $\unicode[STIX]{x1D719}=0.99$ it varies from vertical for
 $\unicode[STIX]{x1D703}=0$ to horizontal for
 $\unicode[STIX]{x1D703}=\unicode[STIX]{x03C0}/2$, see figure 5(e–g).
Surface plots (a–c) give the value of  $K_{min}$ as a function of both offset,
 $\unicode[STIX]{x1D719}$, and angular position
 $\unicode[STIX]{x1D703}$ (where these values are defined as in § 3) of the inner ellipse for three different eccentricity values: (a)
 $e=0$, (b)
 $e=0.7$ and (c)
 $e=0.9$. Panels (d) and (e), respectively, show the maximum and minimum value of
 $K_{min}$ gives the minimum value of
 $K_{min}$ for a given equal inner and outer ellipse eccentricity value. The geometries that provide the
 $\min (K_{min})$, (d), and
 $\max (K_{min})$, (e), for
 $e=0$,
 $e=0.4$,
 $e=0.7$ and
 $e=0.9$ are demonstrated by diagrams and the white-dashed line on each of these shows the direction of minimum resistance.
 $R_{o}=2$.

Figure 6(a–c) shows the axial flow rate in the  $(\unicode[STIX]{x1D719},\unicode[STIX]{x1D703})$ parameter space for three different eccentricity values, and in figure 10(a–c), we plot
 $K_{min}$ for the same domains. For both
 $e=0.7$ and
 $e=0.9$, the smallest value of
 $K_{min}$ occurs at
 $\unicode[STIX]{x1D703}=\unicode[STIX]{x03C0}/2$ and an intermediate
 $\unicode[STIX]{x1D719}$ value
 $0<\unicode[STIX]{x1D719}<1$. Here,
 $K_{min}$ is in the
 $x$-direction, aligned with the major axis of the rod. This is similar to the behaviour determined by Dvinsky & Popel (Reference Dvinsky and Popel1987) of a circular cylinder translating between two plates, parallel to the boundaries, where the lowest force was incurred at a position between the centreline and the wall, with the exact location being dependent upon the ratio of the radius of the cylinder to the distance between the walls.
In figure 10(d), the minimum value of  $K_{min}$ over
 $(\unicode[STIX]{x1D719},\unicode[STIX]{x1D703})$-space is plotted as a function of
 $e$. Several points have been illustrated to show the domain that produces the value, and the
 $\boldsymbol{k}_{min}$ axis is demonstrated on these by a dashed white line. We see that
 $K_{min}$ has a local minimum near
 $e=0.7$. Note also that the position where the minimum
 $K_{min}$ is achieved changes with
 $e$, moving from the centre of the outer cylinder to the edge with increasing eccentricity. Figure 10(e) shows the maximum value of
 $K_{min}$ for increasing eccentricity, and again, the locations along with the
 $\boldsymbol{k}_{min}$ axis that produces these values is demonstrated at four points. Here there is a monotonic increase with eccentricity, and the location of the maximum
 $K_{min}$ always occurs on the major axis of the outer cylinder, closest to the wall (
 $\unicode[STIX]{x1D703}=0$,
 $\unicode[STIX]{x1D719}=0.99$).
Connecting these results with those in § 3.3, we find that for each  $e$, the location where
 $K_{min}$ is maximised coincides with the position where
 $Q$ is maximised. This can be seen by comparing figure 10(a–c) with figure 6(a–c). Contour plots of
 $Q$,
 $\log (K_{min})$ and
 $\log (K_{max})$ for
 $e_{o}=e_{i}=0.7$,
 $\unicode[STIX]{x1D6E9}=0$ are shown in figure 11 as functions of
 $(X,Y)$. The plots are computed for
 $0\leqslant \unicode[STIX]{x1D719}\leqslant 0.99$,
 $0\leqslant \unicode[STIX]{x1D703}\leqslant \unicode[STIX]{x03C0}/2$, and the black boundary indicates the edge of the outer ellipse. The coincident positions of
 $\max (Q)$ and
 $\max (K_{min})$ are indicated in figures 11(a) and 11(b), respectively, by the red circles.
We note that, by parametrising the position of the rod by  $\unicode[STIX]{x1D719}$, the minimum gap between the rod and the bounding cylinder depends on the angular position
 $\unicode[STIX]{x1D703}$. To test the sensitivity – of positions of highest minimum resistance and maximum flux – to the minimum fixed distance between the rod and the cylinder wall, we consider, in appendix G, an absolute minimum distance between the rod and bounding cylinder, rather than one that depends on
 $\unicode[STIX]{x1D703}$, as well as different maximum
 $\unicode[STIX]{x1D719}$ values. We find, for all considered minimum distances between the rod and cylinder, that the correspondence between rod positions of highest minimum resistance and maximum flux persists.
The resistance contours, figures 11(b) and 11(c), show increasingly narrow contours with proximity to the edge of the outer ellipse, demonstrating a rapid increase in the gradient of  $K_{min}$ and
 $K_{max}$, respectively. In contrast, the distances between neighbouring
 $Q$ contour lines in figure 11(a) remain relatively constant. Thus, it is interesting to note that small changes to the position of the inner rod when it is near the outer boundary may incur vast changes to the resistance to cross-sectional motion, but only a small change to the corresponding axial flux. The arrows in figures 11(b) and 11(c) demonstrate the directions of minimum and maximum resistance, respectively. Along the major axis of the outer ellipse, and close to its centre, the direction of minimum resistance is towards the vertex of the inner rod, demonstrating the effect of the rod’s streamlined elliptical cross-section. However, the directions of the arrows change once the rod is sufficiently far from the centre, and the competing effects of the bounding walls become significant. This is in agreement with the results in figure 9(c). As anticipated, when the rod is near the outer boundary, the direction of minimum resistance is tangent to the wall and the direction of maximum resistance perpendicular to it. The arrows in figures 11(b) and 11(c) allow some conjecturing as to local trajectories of the inner rod; however, it is important to recall that the results in figure 11 are computed for fixed orientation of the inner rod (
 $\unicode[STIX]{x1D6E9}=0$). In actuality, torque will be induced by the translational motion of the rod, thus changing the resistance contours. Although similar trends exist between
 $Q$,
 $K_{min}$ and
 $K_{max}$, as shown in figure 11, the non-monotonic contour shapes in figure 11(b), as well as the difference in gradients, indicate that the apparent correspondence between axial and cross-sectional resistance is complicated, even in the particular reduced parameter space (of equal ellipse eccentricity and orientation) explored in figures 10 and 11.
Panels (a), (b) and (c), show  $Q$,
 $\log (K_{min})$ and
 $\log (K_{max})$ as functions of position for ellipses of equal eccentricity
 $e_{o}=e_{i}=0.7$, and equal orientation (
 $\unicode[STIX]{x1D6E9}=0$). The arrows in (b) and (c) show the directions of
 $\boldsymbol{k}_{min}$ and
 $\boldsymbol{k}_{max}$, respectively. Red circles in (a) and (b) indicate the coincident locations of maximum
 $Q$ and maximum
 $K_{min}$.

5 Discussion
We have considered in this paper the effect of geometry in an annular region, formed by an elliptic rod and coaxial elliptic cylinder, on two types of resistance: the resistance to axial flow, and the resistance to movement of the rod in the cross-section. This research was motivated by questions of optimal device design: where to position the rod, and how to shape the cross-sections of the rod and the bounding cylinder, to maximise axial flux and minimise movement of the rod. Motivated by the design of urological devices, we have restricted to the parameter regime in which the fluid behaviour is dominated by viscous forces, but in which inertia of the inner cylinder is non-negligible. In this regime, we showed that the axial flow decouples from the cross-sectional flows. Therefore, we can separately solve a Poiseuille flow problem for the axial flow and Stokes flow in the cross-section, with the profile of the cross-sectional flow producing a net force and torque that couple to the motion of the inner cylinder.
5.1 Axial flow resistance
For all configurations considered, the flux increases monotonically as the rod is positioned further from the centre of the outer cylinder, and the maximum flux is achieved when the rod touches the boundary of the outer cylinder. For a circular rod in a circular cylinder, the maximum flux is achieved when the circle touches the outer boundary at a single point (Snyder & Goldstein Reference Snyder and Goldstein1965; MacDonald Reference MacDonald1982). When either the outer cylinder or the rod is elliptical, we found that flux can be increased from the circular case by touching the boundary tangentially at two points. Even within the reduced space of elliptical cylinders, the full optimisation problem is five-dimensional and non-trivial, containing many local minima. Along with the global optimum, we have also considered several constrained optimisation problems; these are summarised in table 3, grouped by geometric constraint. Of particular relevance is the fact that the global optimum gives a 52 % increase over the circle in circle case. Also of note is the observation that the true optimum in the case of an ellipse in circle, circle in ellipse and ellipse in ellipse, all occur at configurations for which the inner cylinder meets the outer cylinder at two tangent points and thus does not correspond to a matching of the curvature of the boundaries.
The existence of an optimal eccentricity value to minimise resistance for an outer elliptic cylinder containing an inner circular rod is of particular interest to the endourological community. It is important to note, however, that in a biomedical context, the value of  $R_{o}$ varies with the particular medical device under consideration. Even within the category of ureteroscopes, there are a variety of available sizes for working tools and access sheaths, and hence, as the optimal geometry depends on the size of
 $R_{o}$, there is no single optimal configuration. The system is further complicated by concurrent flows through the working channel and access sheath, connected by pressure within the kidney. We derive an irrigation systems model in Williams et al. (Reference Williams, Waters, Moulton, Rouse and Turney2019b) and discuss – based on the fluid mechanics presented in § 3.4 – the effects of modifying flow resistance through the access sheath on flow rate and kidney pressure.
Summary of optimal configurations for  $R_{o}=2$.

5.2 Cross-sectional flow resistance
The cross-sectional resistance to imposed translational and rotational movement of the rod is fully characterised by six unique scalars. The behaviour of these resistance coefficients is determined both by the shape of the rod’s cross-section and its proximity to the bounding cylinder. When varying eccentricity, position and orientation, and the impact on six scalars, we are thus faced with a very high-dimensional parameter space to investigate. Our results do not represent a complete sweeping of all configurations; rather, we have tried to uncover trends, to compare with classic results in particular limits, and to focus on unexpected behaviour. One particularly interesting result was found for an elliptic rod near the edge of a bounding circular cylinder, in which case we found that the sign of the coefficient coupling translational and rotational motion changed as the eccentricity of the inner ellipse increased. This result could be rephrased as a change in motion being generated by a change in shape, and we might speculate whether such a process could be harnessed in a micro-swimming context, where trajectories are determined by principles of Stokes resistance (Lauga & Powers Reference Lauga and Powers2009).
It is important to note that all resistance coefficients diverge as the rod approaches the outer boundary. Thus, positions for the rod which lead to high axial flux (close to the edge of the bounding cylinder) receive extremely high resistance to translational and rotational motions. Thus, it is impossible to fully connect configurations of maximum axial flux to positions of highest minimal resistance within our modelling framework, as the maximum axial flow occurs when the rod touches the wall, and here the resistance always diverges. Nevertheless, for the particular class of an elliptic rod in an elliptic cylinder of the same eccentricity and orientation, we restricted the parameter space of rod positions to those within a fixed relative distance to the boundary, and found a correspondence between the position of maximum axial flux and highest minimum resistance.
Although we have uncovered coincident rod positions for optimal axial flow and highest minimum resistance, a question still remains as to whether the rod will be driven to such a position by the hydrodynamic forces and torque, a question that may have interesting design implications. One could address this with rod trajectories calculated by integrating forward the equations of motion for the rod. Within the parameter regime where rod inertia is included while fluid inertia is neglected, one could quasi-statically update the forces and torques on the rod after updating its position and resolving the Stokes equations in the cross-section. While more work is needed to fully characterise how a rod will move in these geometries, we can provide at least an answer to the question of whether the rod will always naturally move to the position of maximum axial flow: the answer is no, when one considers that the fluid is not really pushing the rod at all but merely dissipating energy that has to be input to the rod from the external world. However, as positions of near contact between the rod and wall correlate both with high axial flux and high cross-sectional resistance, we speculate that a large energy input is required to move the rod if it originates in such a position. Of course, these conclusions rely on the decoupling of axial and cross-sectional flow, which would cease to be the case if one breaks the co-axial assumption. It would be interesting to consider how such effects, as well as including fluid inertia, impact on our findings.
Low Reynolds number flow in annular regions bounded internally and externally by ellipses is a surprisingly rich area of research. There are many industrial flows through cylinders containing a coaxial rod, such as oil wells and small-scale medical devices, and in these applications, it is often important to maximise the flux. Our results indicate that an understanding of the complex effect of geometry on resistance in annular domains can enhance optimal device design. Our work has particular impact in the field of endourology, where an understanding of the axial flow resistance and geometric configurations can help guide the design of surgical tools.
Acknowledgements
This publication is based on work supported (or partially supported) by the EPSRC Centre For Doctoral Training in Industrially Focused Mathematical Modelling (EP/L015803/1) in collaboration with Boston Scientific. S.L.W. is grateful for funding in the form of a Royal Society Leverhulme Trust Senior Research Fellowship. The authors would like to acknowledge the support of Boston Scientific Corporation; in particular, helpful conversations were had with N. Rauniyar, T. Harrah and A. Ray on the application of this work to ureteroscopy device design. The authors are also grateful for input from M. Heil on using oomph-lib (Heil & Hazel Reference Heil, Hazel, Schäfer and Bungartz2006).
Declaration of interests
The authors report no conflict of interest.
Appendix A. Numerical details
A.1 Elements
The finite elements are implemented with an open-source finite element library, oomph-lib (Heil & Hazel Reference Heil, Hazel, Schäfer and Bungartz2006). In § 3, the elements for solving the Poisson equation are first-order triangular elements. In § 4, the elements for solving the Stokes equations are triangular Taylor–Hood elements (second order for velocity and first order for pressure).
A.2 Mesh
An unstructured mesh of triangular elements is generated for each domain via the use of the Triangle library within an oomph-lib driver code (Shewchuk Reference Shewchuk1996). A single, automatic mesh adaptation is enabled, to allow elements to cluster where there is a narrow gap between the rod and the outer cylinder. The maximum allowed element area is set to be 0.1 and the minimum element area to be  $10^{-6}$. A typical number of elements is 4000.
A.3 Calculating the analytical flux for offset circles
A formula for the flow rate between a pair of offset circular cylinders is given in Piercy et al. (Reference Piercy, Hooper and Winny1933, p. 650), equation (8). This equation can be made dimensionless by setting  $R_{i}=\text{d}p/\text{d}z=\unicode[STIX]{x1D707}=1$. The formula contains an infinite sum over
 $n$, and in figure 12 we plot
 $Q(N)$ (which we define as the formula with sum truncated at
 $n=N$) as a function of
 $N$, for
 $R_{o}=2$ and three values of
 $\unicode[STIX]{x1D719}$. We observe that the rate of convergence decreases monotonically with
 $\unicode[STIX]{x1D719}$. When validating our numerical solution for flow in an offset circular annulus, and when plotting the analytical solution for
 $Q$ in figure 3(b), we take
 $N=50$. For
 $\unicode[STIX]{x1D719}=0.99$ – the largest
 $\unicode[STIX]{x1D719}$-value considered in this section, and thus the
 $\unicode[STIX]{x1D719}$-value which will have the largest error induced by truncating the sum – the relative error for
 $N=50$ is
 $$\begin{eqnarray}\unicode[STIX]{x1D700}=\frac{Q(50)-Q(49)}{Q(50)}=O(10^{-8}).\end{eqnarray}$$
Equation (8) in Piercy et al. (Reference Piercy, Hooper and Winny1933) with the infinite sum truncated at  $n=N$ as a function of
 $N$ for
 $\unicode[STIX]{x1D719}=0.01$,
 $\unicode[STIX]{x1D719}=0.5$ and
 $\unicode[STIX]{x1D719}=0.99$.

Appendix B. Position that maximises flux (§ 3.1)
The rod position that maximises axial flux for a circular rod in an elliptic cylinder is the position as close to the vertex of the bounding cylinder as geometrically possible. This will be when the radius of the inner circle is less than the radius of curvature of the ellipse at the vertex, which for a cylinder of major axis  $a$ and minor axis
 $b$ is
 $b^{2}/a$.
Thus, for a circle of radius  $r$, if
 $b^{2}/a\geqslant r$ then the rod position that maximises flux is
 $a-r$ from the centre of the ellipse. If
 $b^{2}/a<r$, we can solve for the position of the circle centre where the circle and the ellipse are tangent in two locations. This is
 $\sqrt{a^{2}-b^{2}}\sqrt{1-r/b^{2}}$ from the centre of the bounding ellipse.
Thus, for our configuration, the rod position that maximises flux is
 $$\begin{eqnarray}X=a_{o}-1,\quad \text{if}~e_{o}\geqslant \text{e}^{\star },\quad X=a_{o}e_{o}\sqrt{1-b_{o}^{-2}},\quad \text{if}~e_{o}<\text{e}^{\star },\end{eqnarray}$$
where
 $$\begin{eqnarray}\text{e}^{\star }=\sqrt{1-R_{o}^{-4/3}}.\end{eqnarray}$$
A closer look at the ellipse vertex for configuration (ii) in figure 3 (the configuration that maximises flux over all  $e_{o}$ for
 $R_{o}=2$) is shown in figure 13. The two points of intersection between the rod and bounding cylinder are indicated by red dots. As the eccentricity of the outer ellipse is greater that
 $\text{e}^{\star }$, the inner circle touches the outer ellipse in two locations, rather than just at the vertex.
The geometry that maximises flux in figure 3. A close-up of configuration (ii).

Appendix C. Additional results (§ 3.3)
Figure 6(a–c) shows colour maps of  $Q$ as a function of the position of the rod, parameterised by
 $\unicode[STIX]{x1D719}$ and
 $\unicode[STIX]{x1D703}$, for an elliptical rod in an elliptical cylinder of the same eccentricity
 $e$, and orientation
 $\unicode[STIX]{x1D6E9}=0$. To highlight the behaviour of
 $Q$ with respect to individual variation of
 $e$,
 $\unicode[STIX]{x1D719}$ and
 $\unicode[STIX]{x1D703}$, in figure 14 we fix two of our three parameters and plot
 $Q$ as a function of the third. Figure 14(a) shows a monotonic increase of
 $Q$ with
 $\unicode[STIX]{x1D719}$ for
 $\unicode[STIX]{x1D703}=0$ and
 $e=0$, 0.4, 0.65 and 0.8. Figure 14(b) captures a zoomed-in view of figure 14(a) between
 $0.9\leqslant \unicode[STIX]{x1D719}\leqslant 0.99$, and shows that over this range of
 $\unicode[STIX]{x1D719}$, for the four eccentricity values plotted,
 $e=0.65$ has the highest flux and
 $e=0$ has the lowest. Figure 14(c) plots the non-monotonic relationship between
 $\unicode[STIX]{x1D703}$ and
 $Q$ indicated by figure 5(e–h) for
 $e=0$, 0.4, 0.65 and 0.8. The flux is largest for
 $\unicode[STIX]{x1D703}=0$ and has a minimum between
 $\unicode[STIX]{x1D703}=\unicode[STIX]{x03C0}/4$ and
 $\unicode[STIX]{x1D703}=\unicode[STIX]{x03C0}/2$. For
 $e=0$,
 $Q$ is constant with respect to
 $\unicode[STIX]{x1D719}$ as expected due to the rotational symmetry of the domain. Figure 14(d) shows
 $Q$ as a function of
 $e$ for fixed offset,
 $\unicode[STIX]{x1D719}=0.99$, and
 $\unicode[STIX]{x1D703}=0$,
 $\unicode[STIX]{x03C0}/4$ and
 $\unicode[STIX]{x03C0}/2$. For
 $\unicode[STIX]{x1D703}=0$, the flux is maximum for
 $e$ between 0.6 and 0.8. For
 $\unicode[STIX]{x1D703}=\unicode[STIX]{x03C0}/4$, there is a maximum
 $Q$ near
 $e=0.3$, whereas for
 $\unicode[STIX]{x03C0}/2$,
 $Q$ decreases monotonically with
 $e$. The results in figure 14 suggest that
 $\unicode[STIX]{x1D719}=0.99$,
 $\unicode[STIX]{x1D703}=0$, and a non-zero value of
 $e$ lead to the maximum flux.
Dimensionless flow rate,  $Q$, as a function of (a) and (b) offset,
 $\unicode[STIX]{x1D719}$, (c) eccentricity,
 $e$, and (d), angular position,
 $\unicode[STIX]{x1D703}$. Panel (b) displays the outlined section of (a). Here
 $R_{o}=2$.

Appendix D. Curvature matching (§ 3.4)
The equations for  $\unicode[STIX]{x1D6E4}_{i}$ and
 $\unicode[STIX]{x1D6E4}_{o}$ are
 $$\begin{eqnarray}\frac{((x-X)\cos \unicode[STIX]{x1D6E9}+(y-Y)\sin \unicode[STIX]{x1D6E9})^{2}}{a_{i}^{2}}+\frac{((x-X)\sin \unicode[STIX]{x1D6E9}+(y-Y)\cos \unicode[STIX]{x1D6E9})^{2}}{b_{i}^{2}}=1,\end{eqnarray}$$
 $$\begin{eqnarray}\frac{x^{2}}{a_{o}^{2}}+\frac{y^{2}}{b_{o}^{2}}=1,\end{eqnarray}$$
 $a_{i,o}$ and
 $b_{i,o}$ can be calculated from
 $R_{o}$,
 $e_{i,o}$ via (3.2). We seek values for
 $X$,
 $Y$,
 $\unicode[STIX]{x1D6E9}$ and
 $e_{i}$ so that the inner ellipse will touch the outer ellipse tangentially with matching curvature at a point
 $$\begin{eqnarray}(x,y)=(a_{o}\cos \unicode[STIX]{x1D703},b_{o}\sin \unicode[STIX]{x1D703}),\end{eqnarray}$$
with its centre located furthest from the centre of the outer ellipse. Transforming coordinates
 $$\begin{eqnarray}(x,y)\rightarrow \left(\frac{x}{a_{o}}\cos \unicode[STIX]{x1D6FC}+\frac{y}{b_{o}}\sin \unicode[STIX]{x1D6FC},\frac{x}{a_{o}}\sin \unicode[STIX]{x1D6FC}-\frac{y}{b_{o}}\cos \unicode[STIX]{x1D6FC}\right):=(\tilde{x},{\tilde{y}}),\end{eqnarray}$$
where  $\unicode[STIX]{x1D6FC}=\unicode[STIX]{x03C0}/2-\unicode[STIX]{x1D703}$, the equations for the inner and outer ellipse are then
 $$\begin{eqnarray}\frac{(\tilde{x}\cos \tilde{\unicode[STIX]{x1D6E9}}+({\tilde{y}}-{\tilde{Y}})\sin \tilde{\unicode[STIX]{x1D6E9}})^{2}}{\tilde{a}_{i}^{2}}+\frac{(\tilde{x}\sin \tilde{\unicode[STIX]{x1D6E9}}+({\tilde{y}}-{\tilde{Y}})\cos \tilde{\unicode[STIX]{x1D6E9}})^{2}}{\tilde{b}_{i}^{2}}=1,\end{eqnarray}$$
 $$\begin{eqnarray}\frac{\tilde{x}^{2}}{\tilde{a}_{o}^{2}}+\frac{y^{2}}{\tilde{b}_{o}^{2}}=1.\end{eqnarray}$$
As the outer boundary is now circular, we seek without loss of generality, a geometry for the inner ellipse that touches the outer boundary in a single point,  $(0,{\tilde{Y}})$ with matching tangent and curvature. As
 $R$ is fixed, the major and minor axes of the ellipses are determined by their eccentricity values. To maximise the distance between the centres of the ellipse we take
 $\tilde{\unicode[STIX]{x1D6E9}}=0$ and the ellipse centres are a distance
 $1-\tilde{b}_{i}$ apart. Hence, we have
 $$\begin{eqnarray}\tilde{a}_{i}=R^{-2/3},\quad \tilde{b}_{i}=R^{-4/3},\quad \tilde{X}=0,\quad {\tilde{Y}}=1-R^{-4/3}.\end{eqnarray}$$
We can therefore determine the position and orientation angle of the initial ellipse by reversing the transformation (D 3). Some velocity colour maps are shown in figure 15. The values for  $\unicode[STIX]{x1D703}$ and
 $e_{o}$ in figure 15(a–h) correspond to those in figure 5(e–l), respectively. This comparison shows that
 $Q$ is larger for
 $e_{i}$,
 $\unicode[STIX]{x1D6E9}$ that match the curvature of the outer ellipse (figure 15), compared to
 $e_{i}=e_{o}$ and
 $\unicode[STIX]{x1D6E9}=0$ (figure 5).
Dimensionless velocity colour maps with dimensionless flow rates,  $Q$. Axes are in
 $(x,y)$ coordinates and these vary with eccentricity as the available space for fluid flow is constant. Panels (a–d) show the effect of the position of the inner ellipse,
 $\unicode[STIX]{x1D703}$, and panels (e–h) show the effect of the outer ellipse eccentricity,
 $e_{o}$. Given
 $\unicode[STIX]{x1D703}$ and
 $e_{o}$, we solve for
 $X$,
 $Y$ and
 $\unicode[STIX]{x1D6E9}$, so that the ellipses touch at a single point with matching tangent and curvature.

Appendix E. Optimisation constraints (§ 3.4)
From (3.8), we have that the equations of the outer and inner ellipses can be written respectively as
 $$\begin{eqnarray}\boldsymbol{x}^{\text{T}}\unicode[STIX]{x1D63C}\boldsymbol{x}=0,\quad \boldsymbol{x}^{\text{T}}\unicode[STIX]{x1D63D}\boldsymbol{x}=0,\end{eqnarray}$$
where  $\boldsymbol{x}=(x,y,1)^{\text{T}}$ and
 $\unicode[STIX]{x1D63C}$ and
 $\unicode[STIX]{x1D63D}$ are symmetric matrices of coefficients, functions of the components of
 $\boldsymbol{g}$ (3.6). The intersections of two conics can be determined by considering their pencil,
 $\unicode[STIX]{x1D706}\unicode[STIX]{x1D63C}+\unicode[STIX]{x1D63D}$ (Casey Reference Casey1893). Conditions to determine the relative position of two ellipses were derived by Etayo & Gonzalez-Vega (Reference Etayo and Gonzalez-Vega2006), which we can then write in terms of the components of
 $\boldsymbol{g}$. The characteristic polynomial of the pencil (once turned monic) is
 $$\begin{eqnarray}f(\unicode[STIX]{x1D706})=\unicode[STIX]{x1D706}^{3}+a\unicode[STIX]{x1D706}^{2}+b\unicode[STIX]{x1D706}+c.\end{eqnarray}$$
In order for the inner ellipse to be fully enclosed in the outer ellipse, the following conditions must hold:
 $$\begin{eqnarray}a>0,\quad -3b+a^{2}>0,\quad 3ac+ba^{2}-4b^{2}>0,\end{eqnarray}$$
 $$\begin{eqnarray}-27c^{2}+18cab+a^{2}b^{2}-4a^{3}c-4b^{3}>0,\end{eqnarray}$$
 $$\begin{eqnarray}n_{22}\det (N)>0,\quad \det (N_{11})>0,\end{eqnarray}$$
where  $N=v{\mathcal{A}}+{\mathcal{B}}=(n_{ij})$ and
 $N_{11}$ is the minor of
 $N$ (Etayo & Gonzalez-Vega Reference Etayo and Gonzalez-Vega2006). Equations (E 2) and (E 3) provide a set of six nonlinear constraints on
 $\boldsymbol{g}$. Thus, the optimisation problem can be formulated as (3.8)
 $$\begin{eqnarray}\min _{\boldsymbol{g}}-Q,\quad \text{subject to}~\boldsymbol{c}>0,\end{eqnarray}$$
where
 $$\begin{eqnarray}\boldsymbol{c}=\left[\begin{array}{@{}c@{}}a\\ -3b+a^{2}\\ 3ac+ba^{2}-4b^{2}\\ -27c^{2}+18cab+a^{2}b^{2}-4a^{3}c-4b^{3}\\ n_{22}\det (N)\\ \det (N_{11})\end{array}\right].\end{eqnarray}$$
Appendix F. Additional results (§§ 4.1 and 4.2)
Sections 4.1 and 4.2 explore Stokes resistance to rod motion for a circular rod and a circular outer cylinder, respectively. Although we fix the eccentricity of either the rod or bounding cylinder in each section, the parameter space remains vast and comprises: the position of the rod, the eccentricity of the rod or outer cylinder and the six Stokes coefficients. We have highlighted key results in figures 8 and 9 and provide plots of additional results (which we refer to in the main text) in this appendix for completeness.
F.1 Section 4.1
We plot  $\unicode[STIX]{x1D612}_{xx}$ as a function of relative offset (which varies from
 $0$ when the rod is concentric to
 $1$ when the rod touches the boundary (for all
 $e_{o}$ values shown, the rod can fit tangent to the vertex, so
 $X/(a_{o}-1)=1$ is achievable)) in figure 16(a) for
 $e_{o}=0$,
 $e_{o}=0.6$ and
 $e_{o}=0.8$ (lines i, ii and iii, respectively). For each offset value,
 $\unicode[STIX]{x1D612}_{xx}$ increases with
 $e_{o}$, although it should be noted that when plotting
 $\unicode[STIX]{x1D612}_{xx}$ as a function of absolute offset
 $X$, a crossing of the curves is observed (see inset in figure 16a); this is due to the fact that with higher eccentricity, there is a larger absolute distance to the edge. In all cases we compute the lift force
 $\unicode[STIX]{x1D612}_{xy}=0$ (to within numerical error), which is expected by the symmetry of the domain. We next consider the coupling coefficients
 $\unicode[STIX]{x1D60A}_{x}$ and
 $C_{y}$. For concentric circular cylinders, there is no coupling between translation and rotation, i.e.
 $\unicode[STIX]{x1D60A}_{x}=C_{y}=0$ (see § 1.2). However, coupling does occur when there is an offset; e.g. when the rod is rotating and positioned away from the centre of the outer cylinder, the viscous fluid provides both an opposing torque and a force orthogonal to the minimal spacing. The force parallel to the minimal spacing in this scenario is zero (Slezkin Reference Slezkin1955). We now explore how these results extend for a circular rod in an outer elliptical cylinder. We determine that, as with a circular outer cylinder, if the rod is offset in the
 $x$-direction, the coupling coefficient
 $\unicode[STIX]{x1D60A}_{x}=0$, while
 $C_{y}\neq 0$ for all
 $e_{o}$ with
 $X\neq 0$. In figure 16(b) we plot
 $C_{y}$ as a function of relative offset for
 $e_{o}=0$,
 $e_{o}=0.6$, and
 $e_{o}=0.8$ (lines i, ii and iii, respectively). As observed by the crossing of the curves, for small relative offset the coupling is highest for the circular rod, while for large offset the most eccentric rod has the largest coupling coefficient. That is, as the inner rod approaches the edge of the domain, the fluid couples rotation to vertical force (and likewise vertical velocity to torque) more strongly for increased eccentricity. Again, the picture appears differently when plotted against absolute offset, since a greater total distance is available with increased eccentricity: for each absolute distance
 $X$,
 $C_{y}$ decreases with eccentricity (plotted in the inset).
Results for  $R_{o}=2$. (a) Rod of unit radius centred at
 $(X,0)$, translating with unit velocity in the
 $x$-direction.
 $\unicode[STIX]{x1D612}_{xx}$ is plotted both as a function of relative offset and of
 $X$ (inset) for three values of
 $e_{o}$: (i)
 $e_{o}=0$ (ii)
 $e_{o}=0.6$ and (iii)
 $e_{o}=0.8$. (b) Rod centred at
 $(X,0)$, rotating with unit velocity in the clockwise direction for (i)
 $e_{o}=0$, (ii)
 $e_{o}=0.6$ and (iii)
 $e_{o}=0.8$. The solution for
 $e_{o}=0$ is compared against the analytical solution – Slezkin (Reference Slezkin1955), dashed black line. The main plot is function of relative offset, and inset is a function of
 $X$.

F.2 Section 4.2
Figure 17(a) plots  $\unicode[STIX]{x1D608}_{zz}$ as a function of absolute offset,
 $1.45\leqslant X\leqslant 1.8$, for
 $e_{i}=0.7$, continuing the plot in figure 9(a) for larger values of
 $X$. We observe the same line crossing behaviour noted for
 $e_{i}=0.9$ in figure 9(a).
Panel (a) shows  $\unicode[STIX]{x1D608}_{zz}$ as a function of offset for
 $e_{i}=0.7$ oriented at
 $\unicode[STIX]{x1D6E9}=0$,
 $\unicode[STIX]{x1D6E9}=\unicode[STIX]{x03C0}/4$ and
 $\unicode[STIX]{x1D6E9}=\unicode[STIX]{x03C0}/2$. Offset,
 $X\in [1.45,1.8]$ (a continuation from figure 9a). Panel (b) shows
 $K_{min}$ for
 $e_{i}=0$,
 $e_{i}=0.7$ and
 $e_{i}=0.9$ all oriented at
 $\unicode[STIX]{x1D6E9}=\unicode[STIX]{x03C0}/2$. Panels (c–h) show coupling and lift force coefficients for
 $e_{i}=0.7$ (a,c,e,g) and
 $e_{i}=0.9$ (b,d,f,h). Orientation angles vary between
 $\unicode[STIX]{x1D6E9}=0$ and
 $\unicode[STIX]{x1D6E9}=\unicode[STIX]{x03C0}/2$ in steps of
 $\unicode[STIX]{x03C0}/40$.

Figure 17(b) plots  $\unicode[STIX]{x1D612}_{xx}$ (dotted),
 $\unicode[STIX]{x1D612}_{yy}$ (dashed) and
 $K_{min}$ (solid) for ellipses of eccentricities
 $e_{i}=0$,
 $e_{i}=0.7$ and
 $e_{i}=0.9$, all oriented at angle
 $\unicode[STIX]{x1D6E9}=\unicode[STIX]{x03C0}/2$. We see that over this range of offset values (
 $0\leqslant X\leqslant 1.45$),
 $K_{min}=\unicode[STIX]{x1D612}_{yy}$, and
 $\boldsymbol{k}_{min}=\boldsymbol{j}$.
Figure 17(c–h) shows either coupling or lift coefficients for  $e_{i}=0.7$ (a,c,e,g) and
 $e_{i}=0.9$ (b,d,f,h) as functions of absolute offset,
 $X$. The dashed black lines are different
 $\unicode[STIX]{x1D6E9}$ values, ranging from
 $\unicode[STIX]{x1D6E9}=0$ to
 $\unicode[STIX]{x1D6E9}=\unicode[STIX]{x03C0}/2$ in steps of
 $\unicode[STIX]{x03C0}/40$. In each plot, the
 $\unicode[STIX]{x1D6E9}$ value that maximises the force coefficient (over the majority of the
 $X$ range) is indicated by a solid red line. Schematics indicate orientation for the minimal and maximal lines.
The coupling between rotation and translation in the  $x$-direction is shown in figure 17(c,d). We see that for
 $\unicode[STIX]{x1D6E9}=0$ and
 $\unicode[STIX]{x1D6E9}=\unicode[STIX]{x03C0}/2$,
 $\unicode[STIX]{x1D60A}_{x}=0$. Over the majority of the offset values,
 $\unicode[STIX]{x1D60A}_{x}$ is maximal when
 $\unicode[STIX]{x1D6E9}=\unicode[STIX]{x03C0}/4$. However, for
 $e_{i}=0.9$, there is a region close to the outer boundary, where smaller offset angles provide a higher coupling force.
The coupling between rotation and translation in the  $y$-direction is shown in figures 17(e) and 17(f). For both
 $e_{i}=0.7$ and
 $e_{i}=0.9$,
 $C_{y}$ increases monotonically with
 $\unicode[STIX]{x1D6E9}$ from
 $\unicode[STIX]{x1D6E9}=0$ to
 $\unicode[STIX]{x1D6E9}=\unicode[STIX]{x03C0}/2$ over the full range of offset values.
The lift force,  $\unicode[STIX]{x1D612}_{xy}$ is plotted in figure 17(g) and figure 17(h). This is zero for
 $\unicode[STIX]{x1D6E9}=0$ and
 $\unicode[STIX]{x1D6E9}=\unicode[STIX]{x03C0}/2$ and maximal (over the majority of the offset values) for
 $\unicode[STIX]{x1D6E9}=\unicode[STIX]{x03C0}/4$. However, for
 $e_{i}=0.9$, as with
 $\unicode[STIX]{x1D60A}_{x}$, there is a region close to the boundary, where crossing of the lines occurs.
Appendix G. Absolute versus relative distance from the wall
Plots of  $Q$ (a,b) and
 $K_{min}$ (c,d) as functions of angular position
 $\unicode[STIX]{x1D703}$ (see figure 4) for different offset values from the wall. Panels (a) and (c) with solid lines show relative distances, denoted with
 $\unicode[STIX]{x1D719}$ (figure 4) and absolute distances,
 $\unicode[STIX]{x1D6FF}$.

In figure 11, the closest distance to the wall at each value of angular position  $\unicode[STIX]{x1D703}$ is taken as
 $\unicode[STIX]{x1D719}=0.99$, with
 $\unicode[STIX]{x1D719}$ and
 $\unicode[STIX]{x1D703}$ defined as in figure 4:
 $\unicode[STIX]{x1D719}=0$ corresponds to the rod positioned in the centre of the outer cylinder (
 $X=Y=0$) and
 $\unicode[STIX]{x1D719}=1$ denotes the rod touching the cylinder wall. For each value of (
 $\unicode[STIX]{x1D719}$,
 $\unicode[STIX]{x1D703}$), the position of the rod is
 $$\begin{eqnarray}X=\unicode[STIX]{x1D719}(r_{o}-r_{i})\cos \unicode[STIX]{x1D703},\quad Y=\unicode[STIX]{x1D719}(r_{o}-r_{i})\sin \unicode[STIX]{x1D703},\end{eqnarray}$$
where  $r_{o}$ and
 $r_{i}$ are the effective radii of the inner and outer ellipses at an angle
 $\unicode[STIX]{x1D703}$, as defined in (3.3). Because the radius of the inner and outer ellipses vary with angular position
 $\unicode[STIX]{x1D703}$,
 $\unicode[STIX]{x1D719}$ provides a ‘relative’ position for the rod; i.e. the absolute distance between the edge of the rod and the cylinder is different for constant
 $\unicode[STIX]{x1D719}$ at each value of
 $\unicode[STIX]{x1D703}$. In figure 18 we test the sensitivity to the fixed distance from the wall of the observed correspondence between positions of highest minimum resistance and maximum axial flux in figure 11 (where
 $e_{i}=e_{o}=0.7$,
 $\unicode[STIX]{x1D6E9}=0$). Positions for the rod with an absolute distance,
 $\unicode[STIX]{x1D6FF}$, are
 $$\begin{eqnarray}X=(r_{o}-r_{i}-\unicode[STIX]{x1D6FF})\cos \unicode[STIX]{x1D703},\quad Y=(r_{o}-r_{i}-\unicode[STIX]{x1D6FF})\sin \unicode[STIX]{x1D703}.\end{eqnarray}$$
We plot, as the solid lines in figure 18(a,c),  $Q$ and
 $K_{min}$, respectively, for fixed values of
 $\unicode[STIX]{x1D719}=0.9$, 0.925, 0.95, 0.99 (increasing
 $\unicode[STIX]{x1D719}$ correlates with decreasing distance between the rod and the cylinder wall). We see that the position that provides both maximum flux and highest minimum resistance is at
 $\unicode[STIX]{x1D703}=0$ for all values of
 $\unicode[STIX]{x1D719}$. We compare this with flux and resistance when the rod is positioned at an absolute distance from the edge of the cylinder,
 $\unicode[STIX]{x1D6FF}$. In figure 18(b,d), we again plot
 $Q$ and
 $K_{min}$, respectively, but now for fixed
 $\unicode[STIX]{x1D6FF}=0.1$, 0.05, 0.025, 0.01 (dashed lines). We see that the qualitative nature of the curves is unchanged, and that again, the position of both maximum flux and highest minimum resistance is at
 $\unicode[STIX]{x1D703}=0$ for all values of
 $\unicode[STIX]{x1D6FF}$.