INTRODUCTION
Understanding the trophic ecology of populations allows inferences to be made about other parameters of the population, such as growth and size at sexual maturity. The quality and abundance of resources available to a population at a given location affect the ability of individuals to grow to reach their size at maturity, as diet quality determines growth rates and eventually how soon size at maturity is reached (Bjorndal et al., Reference Bjorndal, Bolten and Chaloupka2000; Diez & van Dam, Reference Diez and van Dam2002; Heppell et al., Reference Heppell, Snover, Crowder, Lutz, Musick and Wyneken2003). As part of their life cycle, green turtles undergo long-distance developmental migrations, using different types of habitat as neonates, juveniles and adults (Bolten, Reference Bolten, Lutz, Musick and Wyneken2003).
Gorgona National Park (GNP) is part of the migratory developmental route of black and yellow morphotype green turtles Chelonia mydas (Linnaeus, 1758) that belong to geographically separate rookeries (Amorocho et al., Reference Amorocho, Abreu-Grobois, Dutton and Reina2012). Black morphotype turtles occur only in the eastern Pacific, from California to Chile (Márquez, Reference Márquez1990), whereas yellow morphotype turtles found at GNP belong to rookeries from the central and/or western Pacific (Amorocho et al., Reference Amorocho, Abreu-Grobois, Dutton and Reina2012). The individuals of both morphotypes that arrive to GNP waters are juveniles (black turtles <79.4 cm SCL, yellow turtles <96.0 cm SCL), and use the park's coastal waters to feed and rest (Sampson et al., Reference Sampson, Payán, Amorocho, Seminoff and Giraldo2014). This is one of few locations in the eastern Pacific used exclusively by juveniles (Heppell et al., Reference Heppell, Snover, Crowder, Lutz, Musick and Wyneken2003; Velez-Zuazo et al., Reference Velez-Zuazo, Quiñones, Pacheco, Klinge, Paredes, Quispe and Kelez2014), and the only known feeding aggregation of juvenile green turtles in Colombia (Amorocho & Reina, Reference Amorocho and Reina2007).
Green turtles at GNP have been monitored since 2003. A previous study identified tunicates as an important component in the diet of these individuals, along with terrestrial plants (Amorocho & Reina, Reference Amorocho and Reina2007). A diet that includes an invertebrate component has also been observed in black morphotype C. mydas in Mexico (Seminoff et al., Reference Seminoff, Resendiz and Nichols2002; López-Mendilaharsu et al., Reference López-Mendilaharsu, Gardner, Seminoff and Riosmena-Rodríguez2005; Carrión-Cortez et al., Reference Carrión-Cortez, Zárate and Seminoff2010). Yellow morphotype C. mydas consume mainly algae and seagrasses, but can also include invertebrates in their diet, as has been reported for Australia (Heithaus et al., Reference Heithaus, McLash, Frid, Dill and Marshall2002; Burkholder et al., Reference Burkholder, Heithaus, Thomson and Fourqurean2011) and Brazil (Reisser et al., Reference Reisser, Proietti, Sazima, Kinas, Horta and Secchi2013; González-Carman et al., Reference González-Carman, Botto, Gaitán, Albareda, Campagna and Mianzan2014; Prior et al., Reference Prior, Booth and Limpus2015). The diet of yellow morphotype C. mydas present in GNP has not yet been studied, as the turtles previously studied at this location belonged to the black morphotype (Amorocho & Reina, Reference Amorocho and Reina2007). The present study seeks to fill this knowledge gap by comparing the diet of black and yellow morphotype C. mydas at this feeding ground, taking into account resource availability, because the main food previously identified in the diet of black morphotype C. mydas only occurs sporadically in this area (Sampson & Giraldo, Reference Sampson and Giraldo2014).
An assessment of the diet of green turtles and of food availability during the year would help clarify the use of resources at GNP. Although Parker et al. (Reference Parker, Dutton and Balazs2011) found no difference in the diet of black and yellow morphotype pelagic juveniles, neritic juveniles might have differing diets, as the amount of invertebrates reported in the diet of black morphotype turtles tends to be greater than that reported for yellow morphotype turtles (Heithaus et al., Reference Heithaus, McLash, Frid, Dill and Marshall2002; Amorocho & Reina, Reference Amorocho and Reina2007; Arthur et al., Reference Arthur, Boyle and Limpus2008; Carrión-Cortez et al., Reference Carrión-Cortez, Zárate and Seminoff2010). This analysis could help determine whether these two morphotypes are sharing or competing for resources at this important point along their migratory paths (Sampson et al., Reference Sampson, Payán, Amorocho, Seminoff and Giraldo2014).
Consumption of resources can be done in a selective or non-selective manner, with selection implying that animals are choosing among available resources (Litvaitis, Reference Litvaitis, Boitani and Fuller2000). When animals select a certain food resource based on specific characteristics they are exhibiting a preference towards that resource, independently of the abundance of the resource, whereas opportunistic feeding behaviour denotes consumption of the resource in the same proportion as it is available in the environment (Litvaitis, Reference Litvaitis, Boitani and Fuller2000; Manly et al., Reference Manly, McDonald, Thomas, McDonald and Erickson2002). It has been reported that neritic green turtles can select food based on appearance, with juvenile green turtles selecting clear-coloured plastic over coloured plastic (Schuyler et al., Reference Schuyler, Hardesty, Wilcox and Townsend2012). The co-existence of species, or in this case of different morphotypes, could indicate that resources are being shared (Manly et al., Reference Manly, McDonald, Thomas, McDonald and Erickson2002).
To determine whether C. mydas at GNP are displaying selective and/or opportunistic feeding behaviour, the availability of resources had to be determined first. To date, there are no published studies on year-round availability of C. mydas potential resources at GNP. The present study was carried out to provide information on resources available on the reef substrate, as algae have been reported to be a preferred resource for C. mydas at several locations worldwide (Seminoff et al., Reference Seminoff, Resendiz and Nichols2002; López-Mendilaharsu et al., Reference López-Mendilaharsu, Gardner, Seminoff and Riosmena-Rodríguez2005; Carrión-Cortez et al., Reference Carrión-Cortez, Zárate and Seminoff2010; Jardim et al., Reference Jardim, López-Mendilaharsu and Barros2015; Prior et al., Reference Prior, Booth and Limpus2015). It is possible that C. mydas are selecting among the species available on the reef as has been reported for C. mydas in Hawaii (Arthur & Balazs, Reference Arthur and Balazs2008) and Brazil (Reisser et al., Reference Reisser, Proietti, Sazima, Kinas, Horta and Secchi2013).
Animals select forage items according to food quality (Manly et al., Reference Manly, McDonald, Thomas, McDonald and Erickson2002), which can be determined by analysing nutrient composition. This type of analysis provides information on protein and fat content, as well as on the amount of fibre, which impacts digestibility (Karasov & Martínez del Río, Reference Karasov and Martínez del Río2007). To confirm whether green turtles at GNP are selecting food items based on nutritional quality we performed a proximate analysis of some algae species present on the reef. According to the Optimal Foraging Theory, animals should adopt a strategy of either time minimization or nutrient maximization when foraging (MacArthur & Pianka, Reference MacArthur and Pianka1966). There are no large predators of sea turtles at GNP, such as tiger sharks, that would put pressure on time spent foraging (Acevedo-Bueno et al., Reference Acevedo-Bueno, Beltrán-León and Caicedo-Tulante2004), so the strategy of nutrient maximization is probably at play at this location.
In summary, the present study was conducted to determine resource use by the black and yellow morphotypes of C. mydas present at GNP over 1 year. In order to examine the diet of green turtles at GNP, we (1) determined the diet of turtles captured on the reefs through oesophageal lavages and stable isotope analysis of epidermis and of potential food items, (2) determined food availability on the reefs and selectivity by the turtles, (3) analysed the nutrient content of some reef algae available to the turtles, and (4) calculated the trophic position of green turtles at this foraging site.
MATERIALS AND METHODS
Study area
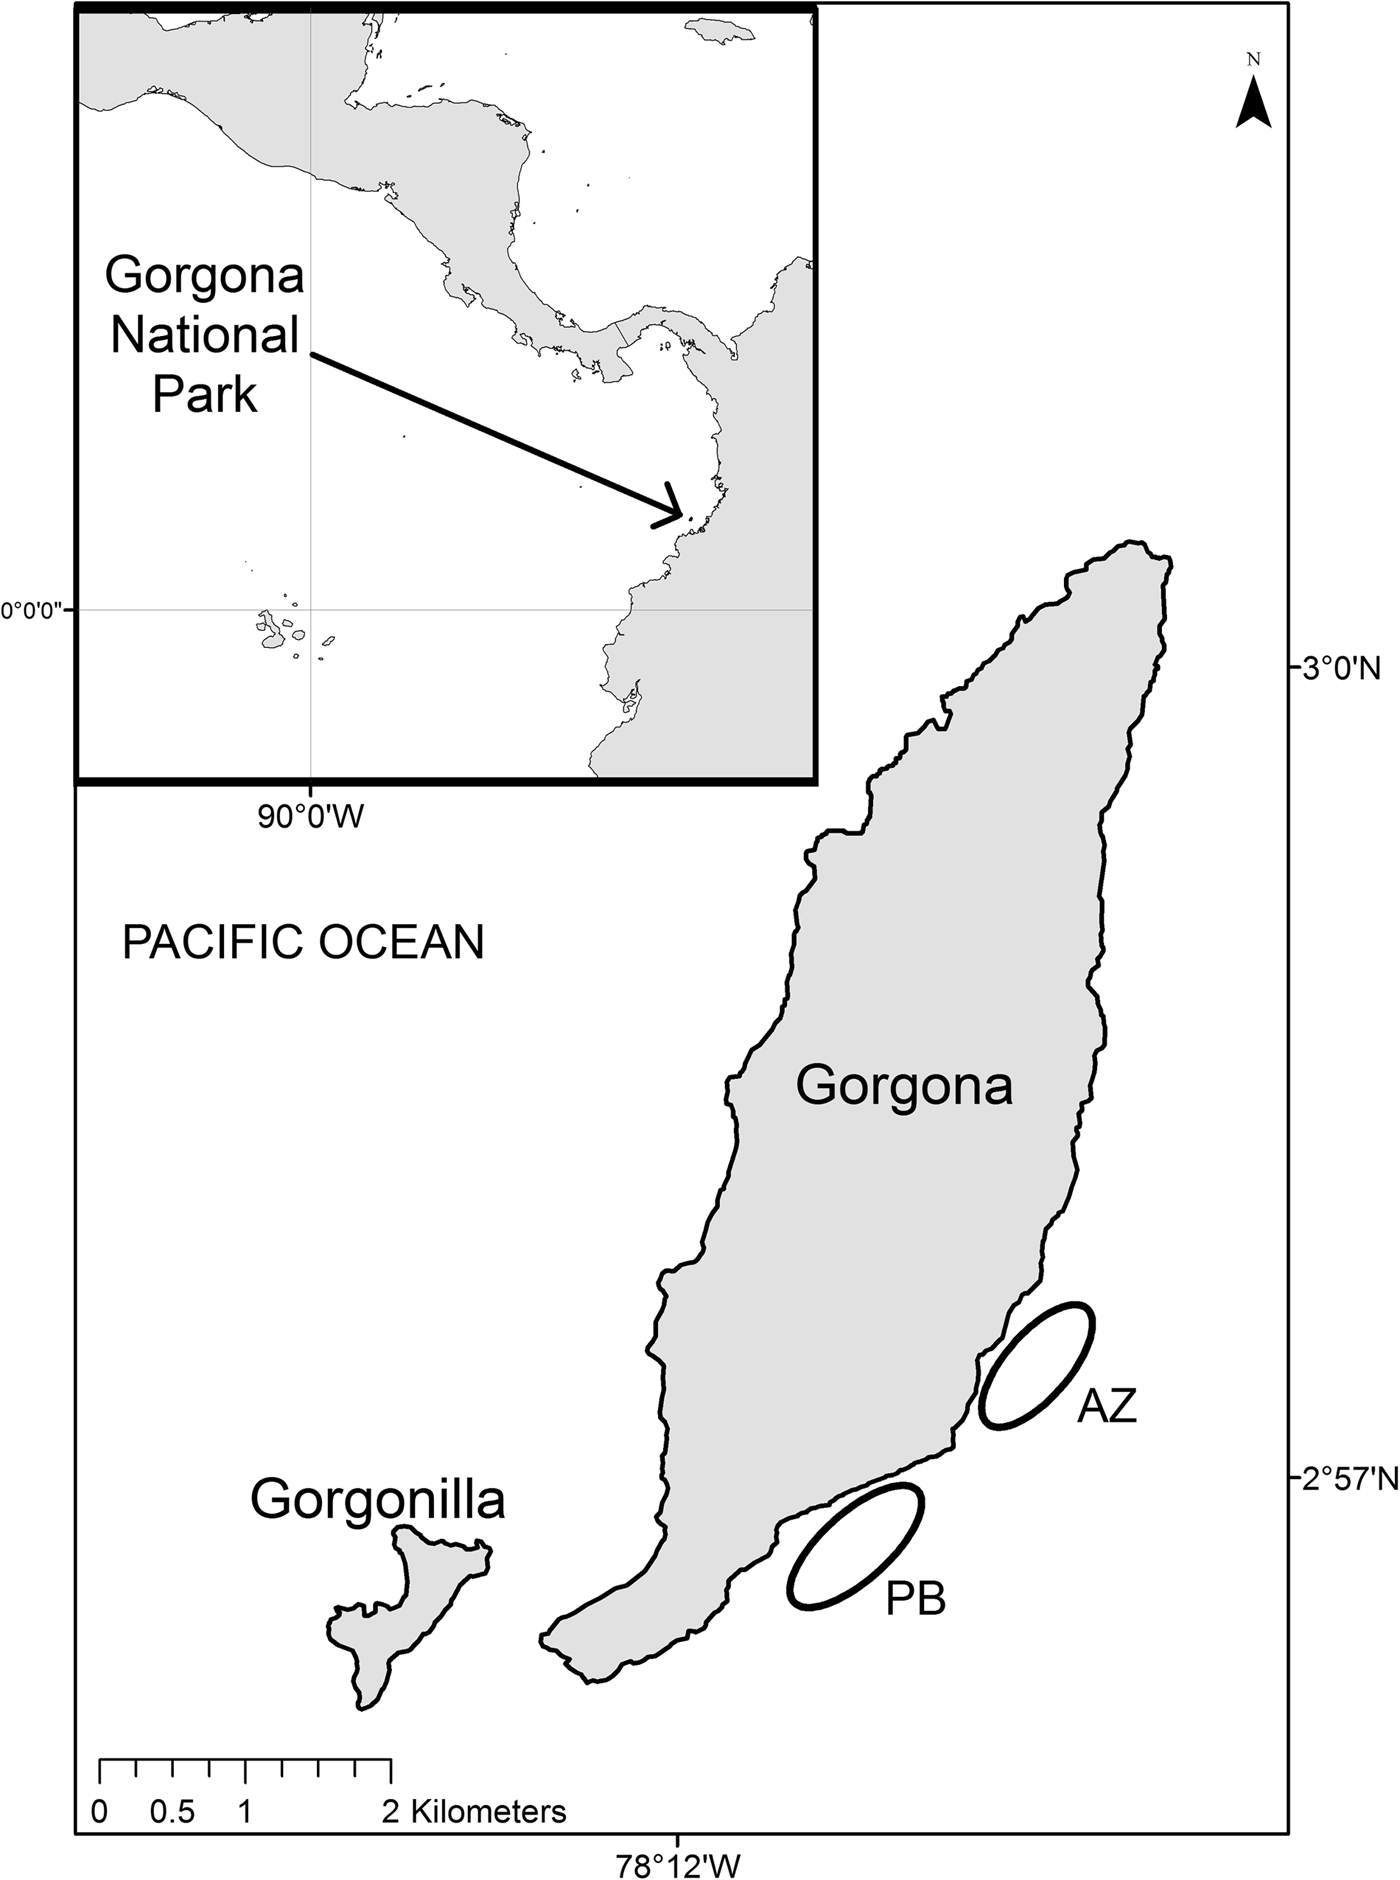
Gorgona National Park (GNP) is located in the Colombian Pacific and comprises a 6033 km2 marine area and a 13.3 km2 island; the closest location to the mainland is 30 km away (Figure 1). Two fringing reefs are located off the south-eastern end of Gorgona Island. La Azufrada (11.2 ha) and Playa Blanca (±10.9 ha) consist mainly of pocilloporid corals (Zapata & Vargas Ángel, Reference Zapata, Vargas-Ángel and Cortes2003) and are at <15 m depth; these reefs can be exposed at extremely low tides (Glynn et al., Reference Glynn, von Prahl and Guhl1982). The amount of coral and algal cover at La Azufrada fluctuates and is influenced by sedimentation and stress; coral cover ranges between ~55 and 65% and algal cover ranges between ~29 and 37% (Zapata et al., Reference Zapata, Rodríguez-Ramírez, Caro-Zambrano and Garzón-Ferreira2010). Monthly precipitation on the island ranges from 180 to 400 mm during the dry season (January–March), and from 550 to 750 mm during the rainy season (April–December) (Giraldo et al., Reference Giraldo, Valencia and Ramírez2014). A total of 715 terrestrial plant species have been recorded on the island, and 85 algae have been identified in the coastal zone (Bula-Meyer, Reference Bula-Meyer and Pinto1995; Giraldo et al., Reference Giraldo, Valencia and Ramírez2014). Unlike many other green turtle foraging grounds, there are no seagrass pastures or mangroves in the area (Acevedo-Bueno et al., Reference Acevedo-Bueno, Beltrán-León and Caicedo-Tulante2004). A study carried out in 2010–2011 reported that 55.8% of algae identified on the coastal reefs of GNP belonged to the Rhodophyta, 27.9% belonged to the Chlorophyta, and 14% belonged to the Heterokontophyta (Murillo-Muñoz & Peña-Salamanca, Reference Murillo-Muñoz and Peña-Salamanca2014).
Study site. Black ellipses show two main reefs where Chelonia mydas individuals were captured.

Turtle capture and ID
Chelonia mydas individuals were captured by hand between 20:00 and 21:00 h in February, April, August, October and December 2012, following the protocol established by the Henry von Prahl research station at GNP. Two to five persons entered the water and searched for turtles over the reefs of La Azufrada and Playa Blanca (Figure 1). Turtles were taken to shore where morphotype was recorded and measures of straight carapace length (SCL in cm, ±0.5 cm), and weight (in kg, ±0.5 kg) were taken for each individual. Each turtle was tagged with a uniquely numbered INCONEL tag (No. 681, National Band and Tag Co., Newport, Kentucky, USA) in either the left or right front flipper.
Oesophageal lavage
Each captured turtle was lavaged once. Turtles were restrained using a vest with Velcro straps and placed on a tyre on the carapace, with the head at a lower height. The mouth was opened using a metal pry bar and downward pressure by hand grip was applied to the lower jaw; a 5 cm-long PVC pipe covered with rubber with diameters of 2, 3.5 or 4.5 cm, depending on turtle size, was used as a gag. Two flexible lubricated plastic tubes with rounded ends were inserted into the oesophagus. The retrieval tube measured 12.0 mm diameter by 1 m, and the injection tube measured 5.0 mm diameter by 3 m. A maximum of 4 l of fresh water were pumped through the injection tube. A bucket was placed under the turtle's head to collect the flushed water; this was later strained through a 20 µm mesh and stored in 4% formaldehyde solution (Forbes, Reference Forbes, Eckert, Bjorndal, Abreu-Grobois and Donnelly1999). Lavage procedures lasted <2 min; turtles were released back to the water as soon as each lavage was performed. One person remained at the shore to make sure the turtle was capable of swimming unassisted.
Identification and quantification of lavage samples
Samples were filtered using a 20-μm mesh net then placed in a Petri dish, adding distilled water to homogenize the sample. A 0.5 × 0.5 cm grid with a total of 266 grid points was placed under the Petri dish, and each item that fell under the grid points was counted. A Nikon SMZ-1500 stereoscopic microscope and a Nikon Eclipse Ni upright microscope were used to identify food items to the lowest possible taxonomic level. Each food type was separated into broad categories (terrestrial plants, algae, invertebrates, sand and plastic). Algae were identified to the lowest possible taxonomic level using the guides by Taylor (Reference Taylor1945); Schnetter & Bula-Meyer (Reference Schnetter and Bula-Meyer1982); Bula-Meyer (Reference Bula-Meyer and Pinto1995); Guiry & Guiry (Reference Guiry and Guiry2014) and Murillo-Muñoz & Peña-Salmanca (Reference Murillo-Muñoz and Peña-Salamanca2014).
Species accumulation curves were constructed for each morphotype using the sample rarefaction (Mao's tau) option in the Past v 2.17 program. The following indices were used to characterize the diet (Hyslop, Reference Hyslop1980):
Frequency of Occurrence (FO%)
 $${\rm FO}\% = \displaystyle{{{\rm Number\; of\; turtles\; with\; food\; item\; }i} \over {{\rm Total\; number\; of\; turtles\; sampled\; }}} \times 100$$
Number %
 $${\rm N}\% = \displaystyle{{{\rm Number\; of\; grid\; points\; covered\; by\; item\; }i} \over {{\rm Total\; number\; of\; grid\; points\; for\; all\; samples}}} \times 100$$
The frequency of occurrence of diet items that contributed >5 and >50% of total sample volume was also calculated (Arthur & Balazs, Reference Arthur and Balazs2008). Weight % was not calculated, as the amounts of sample recovered were very small.
Available food items
The available food items present on the two largest reefs at GNP (La Azufrada and Playa Blanca) were quantified using fifteen 0.5 × 0.5 m quadrats randomly placed 10 m apart on each reef. Each quadrat was divided into 100 squares by a 10 × 10 grid from which per cent cover of each substratum type was estimated in situ by one researcher using scuba equipment. Photographs were also taken of each quadrat using a Lumix Panasonic DMC-TS3 camera held ~1 m above and parallel to the substrate, and used to corroborate the identifications performed in the field. Due to logistical constraints sampling could not be carried out at the same tidal height on every occasion; sampling occurred at 2–10 m depths. Sampling trips to evaluate food availability were carried out in November 2011, February, April, August, October and December 2012.
Food selection
The availability of resources and the items consumed by each morphotype were compared using Ivlev's electivity index, calculated with the following equation:
 $$E_i = \displaystyle{{\left( {r_i - p_i} \right)} \over {\left( {r_i + p_i} \right)}}$$
where r i is the available proportion of item i in the habitat, and p i is the proportion of item i consumed by the predator (Manly et al., Reference Manly, McDonald, Thomas, McDonald and Erickson2002). This index takes on values from −1 (item is avoided) to +1 (item is selected).
Nutrient content
A proximate analysis of algae consumed by black and yellow morphotype turtles as well as abundant algae on the reef was carried out. The humidity, ash, protein, ether extract, crude fibre, lignin, neutral detergent fibre (NDF) and acid detergent fibre (ADF) content of samples were evaluated at the Analytical processes laboratory of the International Center for Tropical Agriculture (CIAT) in Cali, Colombia. This type of analysis identifies broad chemical compounds as follows: ashes represent minerals; ethereal extract represents fats; fibre represents the least digestible structural materials (cellulose, hemicellulose, cutin-suberin, pectin and lignin), NDF represents cellulose, hemicellulose and lignin, and ADF represents cellulose and lignin (Karasov & Martínez del Río, Reference Karasov and Martínez del Río2007).
Stable isotope analysis
Before the lavage was performed, a 6-mm sample of turtle epidermis from the neck area was obtained using a scalpel. Samples of resources available on the reef including algae, aquatic and terrestrial plants, invertebrates, phytoplankton and zooplankton were also collected from November 2011 to December 2012. The following potential food resources were collected for isotopic analysis: four Chlorophyta species (Bryopsis sp., Cladophora sp., Polysiphonia sp., Caulerpa racemosa), three Phaeophyta species (Dictyota humifusa, Dictyota adnata, Lobophora sp.), three Rhodophyta species (Gelidium sp., Hypnea pannosa, Jania sp.), turf algae, a cyanobacteria (Phormidium sp.), aquatic plants (mangrove fruit and water hyacinth leaves), terrestrial plants (leaves of Ficus sp., Hibiscus sp., a palm and climbing plant), phytoplankton, zooplankton, and gelatinous invertebrates (siphonophores, tunicates, jellyfish, and invertebrate eggs).
Samples were kept in NaCl for less than a week then dried at 60°C for 24 h, as it has been shown that NaCl has no effect on isotopic values (Barrow et al., Reference Barrow, Bjorndal and Reich2008). Prior to drying, turtle epidermis samples were cut finely with a scalpel and any connective tissue was removed (Reich & Seminoff, Reference Reich, Seminoff, Blumenthal, Panagopoulou and Rees2010). Lipids were not removed as lipid content does not affect sea turtle epidermis isotopic values (Vander Zanden et al., Reference Vander Zanden, Bjorndal, Mustin, Ponciano and Bolten2012).
Samples were ground and ~1 mg was packed in 5 × 9 mm tin capsules. Turtle samples were analysed with a PDZ Europa ANCA-GSL elemental analyser interfaced to a PDZ Europa 20–20 isotope ratio mass spectrometer (Sercon Ltd, Cheshire, UK) at the Stable Isotope Facility of the University of California at Davis, USA. Habitat samples were analysed using a continuous-flow isotope-ratio mass spectrometer at the Stable Isotope Laboratory of the University of Florida, Gainesville, USA. A Costech ECS 4010 elemental combustion system was interfaced via a ConFlo III device (Finnigan MAT, Bremen, Germany) to a Deltaplus gas isotope-ratio mass spectrometer (Finnigan MAT, Bremen, Germany).
Isotopic values are expressed as δ values relative to international standards (Vienna PeeDee Belemnite for carbon and air for nitrogen) in the following manner:
 $${\rm \delta } = \left[ {\left( {\displaystyle{{R_{{\rm sample}}} \over {R_{{\rm standard}}}}} \right) - 1} \right] \times 1000$$
where R sample and R standard are the ratios of heavy to light isotopes in the sample and the standard (13C/12C and 15N/14N). The two laboratories used to obtain sample stable isotope values are comparable as they used the same international reference standards for calibration, and both laboratories provided reference values against which the international standards were assessed.
Data analysis
The similarity of the diet between the two morphotypes was tested with non-metric multidimensional scaling analysis (NMDS) using a Bray–Curtis similarity matrix, followed by a similarity analysis (ANOSIM) to test the effect of the morphotype over the diet components. These analyses were carried out using the software PAST v 2.17. Data were tested for normality using Kolgomorov–Smirnov tests and for homogeneity of variances using Levene's test.
Isotopic values of the two morphotypes were compared with a Student's t-test. Individual δ15N and δ13C values and SCL were compared with a linear regression to examine whether ontogenetic changes in diet could be detected. Monthly δ15N and δ13C values of each morphotype were compared with a one-way ANOVA, followed by a HSD Tukey test if results were significant. If data failed the normality and homogeneity of variance assumptions Kruskal–Wallis non-parametric tests were used. Analyses were carried out using Statistica v. 8 (Statsoft).
Trophic level was calculated with the following equation proposed by Post (Reference Post2002):
 $${\rm TL} = \displaystyle{{\left( {{\rm \delta }^{15}{\rm N}_{{\rm top \, \,predator}} - {\rm \delta }^{15}{\rm N}_{{\rm baseline}}} \right)} \over {\hbox{discrimination factor}}} + {\rm \lambda }$$
where δ15Nbaseline is the value of the organism chosen to represent the base of the trophic food web, λ is the trophic level of that organism, and the discrimination factor is the change in δ15N values in ‰ between one trophic level and the next. The mean value of algae was used as δ15Nbaseline, using a λ of one. A discrimination factor of + 3.3‰ was used, calculated as the mean of the discrimination factors estimated for green turtles in previous studies (Seminoff et al., Reference Seminoff, Jones, Eguchi, Jones and Dutton2006; Vander Zanden et al., Reference Vander Zanden, Bjorndal, Mustin, Ponciano and Bolten2012).
The MixSIAR model (Stock & Semmens, Reference Stock and Semmens2013) was used to determine the most probable food source consumed by the black and yellow C. mydas morphotypes at GNP. Prey items were first grouped into large groups (algae, aquatic plants, cyanobacteria, terrestrial plants and plankton), and isotopic differences among groups were tested with a Kruskal–Wallis test. Isotopic discrimination factors specific to green turtles were incorporated into the model (−0.17 ± 0.03 for δ13C and +2.80 ± 0.20 for δ15N; Seminoff et al., Reference Seminoff, Jones, Eguchi, Jones and Dutton2006).
RESULTS
Turtle capture and ID
A total of 30 black morphotype and 47 yellow morphotype C. mydas were sampled for lavage and measurements from February to December 2012. The size of black morphotype turtles ranged from 52.3 to 73.2 cm SCL (mean = 63.9 cm), whereas yellow morphotype turtles measured from 40.9 to 68.9 cm (mean = 54.3 cm). The body mass of black morphotype turtles ranged from 23.0 to 52.0 kg (mean = 36.7 kg), whereas the body mass of yellow morphotype turtles ranged from 11.0 to 41.5 kg (mean = 23.2 kg).
Oesophageal lavage
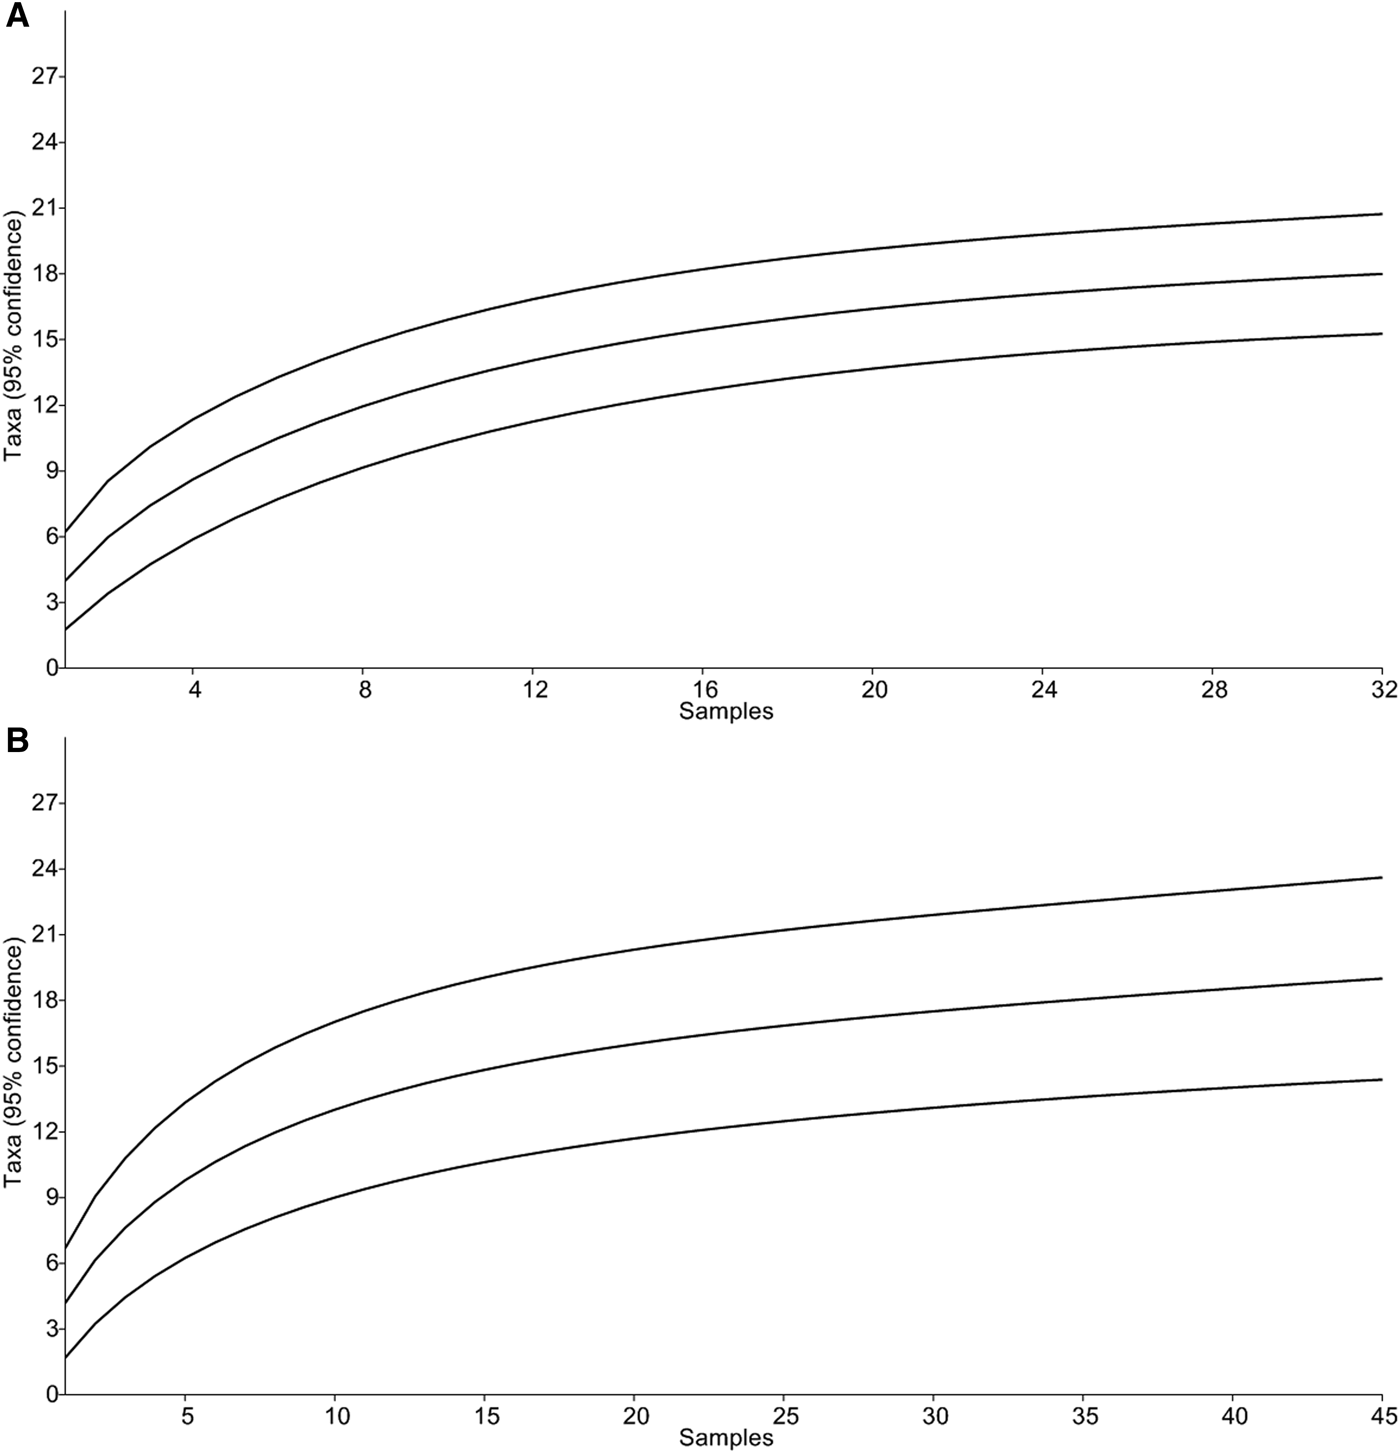
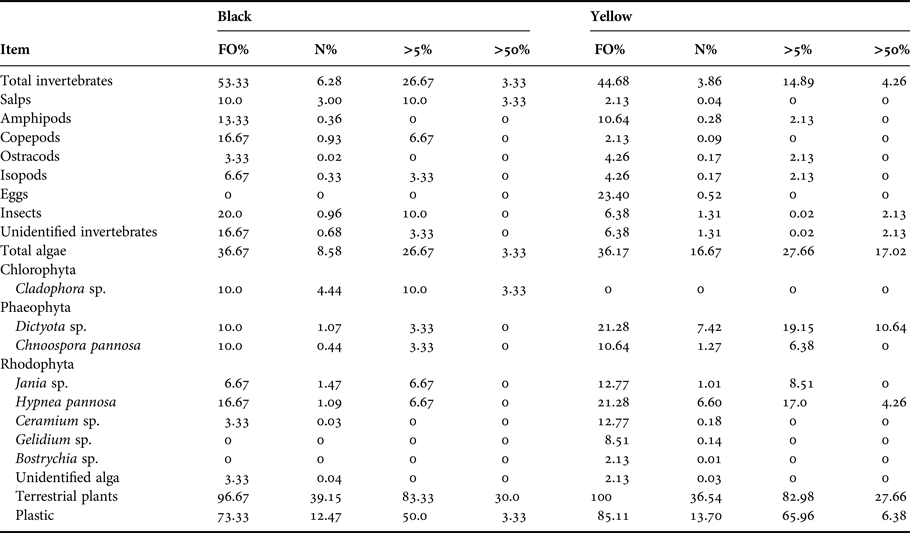
A total of 19 items, including eight invertebrates and nine algae species, were identified in 30 black morphotype and 47 yellow morphotype C. mydas sampled (Table 1). The species accumulation curve showed that the number of turtles sampled was representative of the diet (Figure 2). Most samples contained epithelial cells accidentally scraped from the oesophagus during the lavages, and sand particles, probably incidentally ingested during the turtles’ foraging. The cells found corresponded to the turtle's own epithelial cells and not to half-digested food, because a study of the digestive apparatus of green turtles found that no glands are associated to the oesophagus (Magalhaes et al., Reference Magalhaes, dos, Barsante Santos, da Silva and de Moura2012), which indicates that there is no digestion in this part of the digestive apparatus. Epithelial cells and sand particles were excluded from later analyses.
Species accumulation curve of green turtles lavaged at GNP from February to December 2012 at Gorgona National Park; (A) black morphotype, (B) yellow morphotype.

Frequency of occurrence (FO%) and per cent volume (N%) of items recovered from lavage samples of black and yellow morphotype Chelonia mydas sampled at Gorgona National Park from February to December 2012.

>5 and >50% represent the percentage of turtles in which the diet item contributed over 5% and 50% of relative volume (N%).
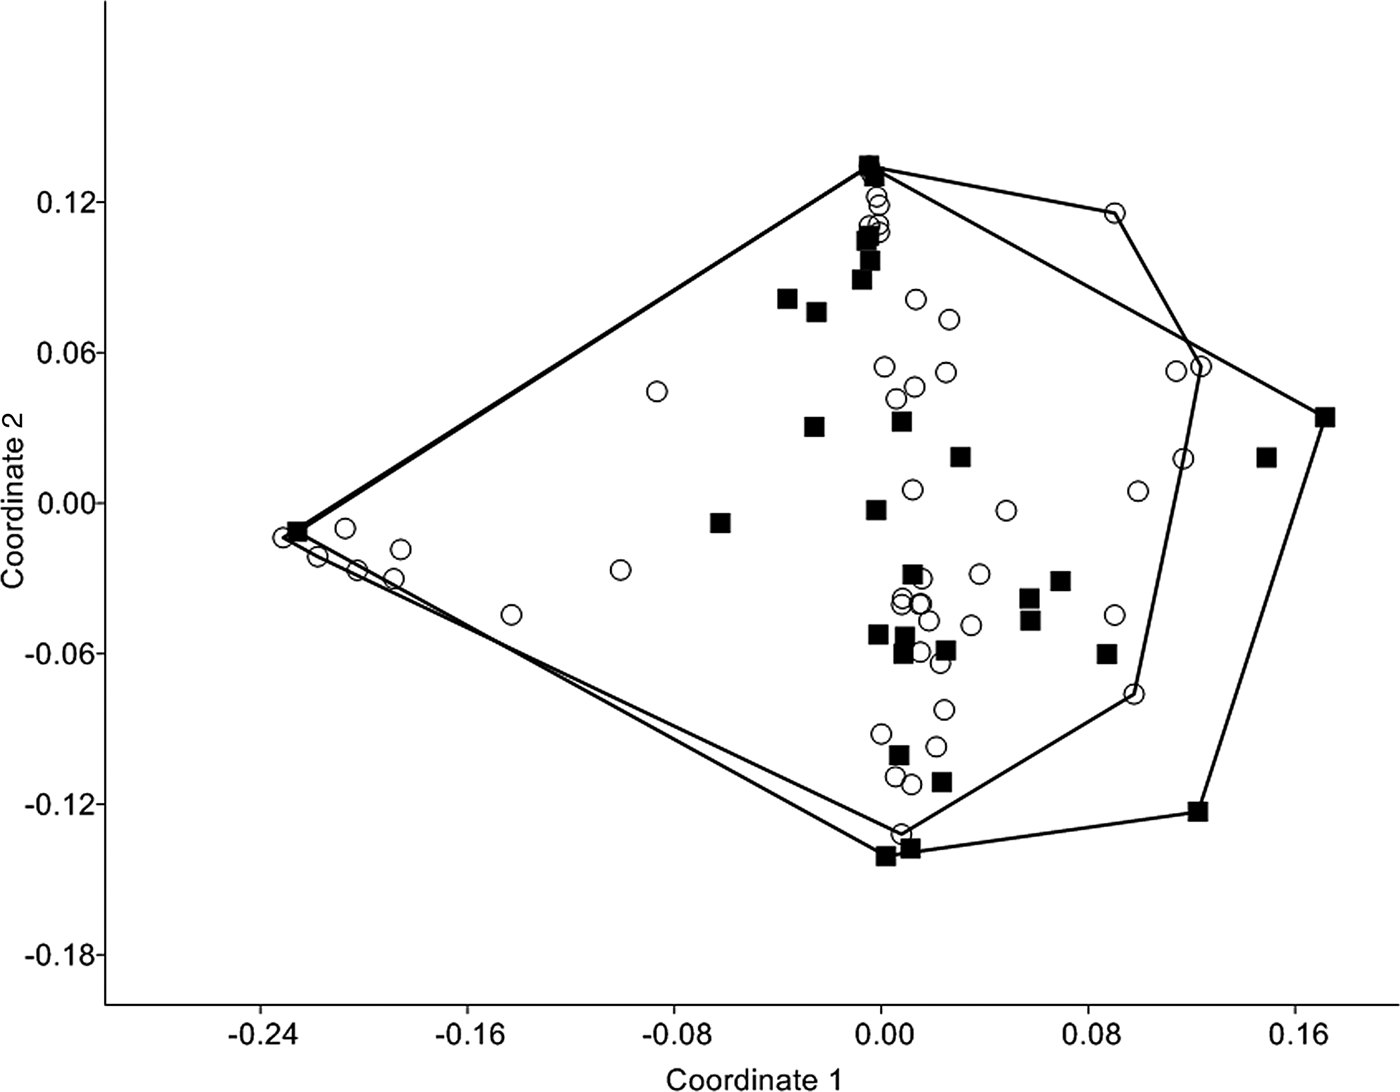
Plastic fibres were found in 73% of samples from black morphotype turtles and 85% of samples from yellow morphotype turtles. The non-metric multidimensional analysis showed high overlap in diet components between the two morphotypes (stress = 0.142; Figure 3), and the ANOSIM showed that there were no significant differences in the diet of yellow and black morphotypes during the study period (R = 0.010, P = 0.41). However, yellow morphotype turtles consumed fewer invertebrates than black morphotype turtles, whereas black morphotype turtles consumed fewer algae than yellow morphotype turtles. No yellow morphotype turtles consumed Cladophora sp. Both morphotypes ingested large amounts of terrestrial plants (leaves and seeds) (Table 1).
Non-metric multidimensional analysis of diet components of black (black squares) and yellow (white circles) Chelonia mydas sampled from February to December 2012 at Gorgona National Park.

Available food items
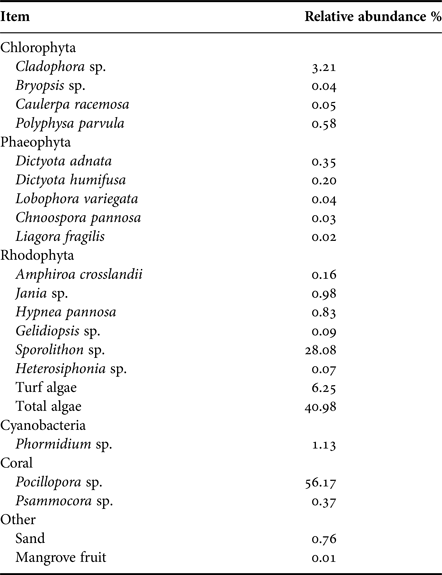
Each reef was sampled six times between November 2011 and December 2012. The total area sampled in each reef was 5.62 m2. A total of 27 items were identified in the quadrats, including 15 algae species (four Chlorophyta, five Phaeophyta, six Rhodophyta), and turf algae mats which include several small green and red algae species (Murillo-Muñoz & Peña-Salmanca, Reference Murillo-Muñoz and Peña-Salamanca2014). The most abundant items in the quadrats were the coral Pocillopora sp. and rodoliths (Sporolithon sp.; Table 2). Availability was not significantly different during the year for any of the algae recorded on the reef (H = 5, N = 11, P > 0.05).
Per cent cover of potential food items identified at the two main reefs of Gorgona National Park between November 2011 and December 2012.

Food selection
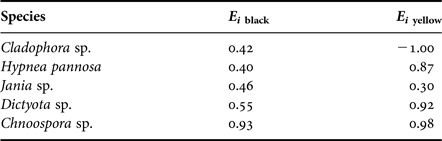
The electivity index was calculated only for those items found in the lavages as well as in the quadrats (Table 3). Hypnea pannosa (Agardh, 1847) and Dictyota sp. were selected by both morphotypes, but selection by yellow morphotype turtles was stronger. Both morphotypes selected Jania sp., probably because this alga comes attached to Dictyota clumps (Schnetter & Bula-Meyer, Reference Schnetter and Bula-Meyer1982). Cladophora sp. was avoided by yellow morphotype turtles but was selected for by black morphotype turtles. The high electivity values obtained for Chnoospora sp. are probably due to the low availability of this alga on the reef.
Ivlev's electivity values obtained for the main consumed items by black and yellow morphotype Chelonia mydas captured at Gorgona National Park between February and December 2012.

Nutrient content
A proximate analysis of Dictyota sp., Cladophora sp., Colpomenia sp. and turf algae was carried out. The algae with highest protein content were Dictyota sp. and Cladophora sp. The brown alga Dictyota sp. had the highest humidity content and the lowest ash content, and a low lignin amount compared with Cladophora sp. and Colpomenia sp., making it more digestible. Crude fibre was also higher in Cladophora sp. than in Dictyota sp. Ether extract, which is indicative of lipid content, was much higher in Dictyota sp. than in the other analysed algae, suggesting that this alga has a higher nutritive value (Table 4).
Results of proximate analysis of algae collected at the two main reefs of Gorgona National Park.

Stable isotope analysis
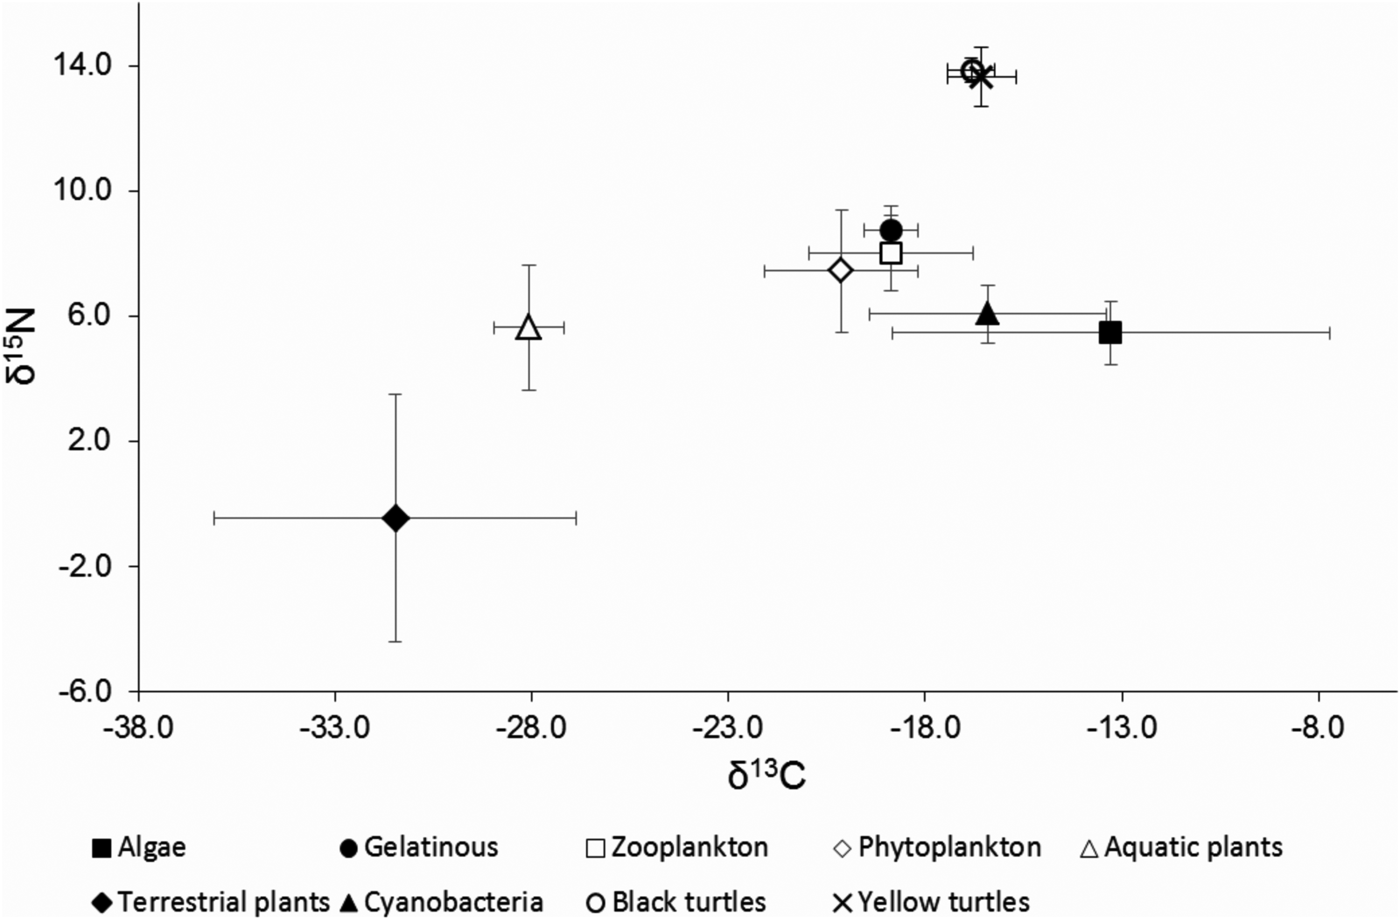
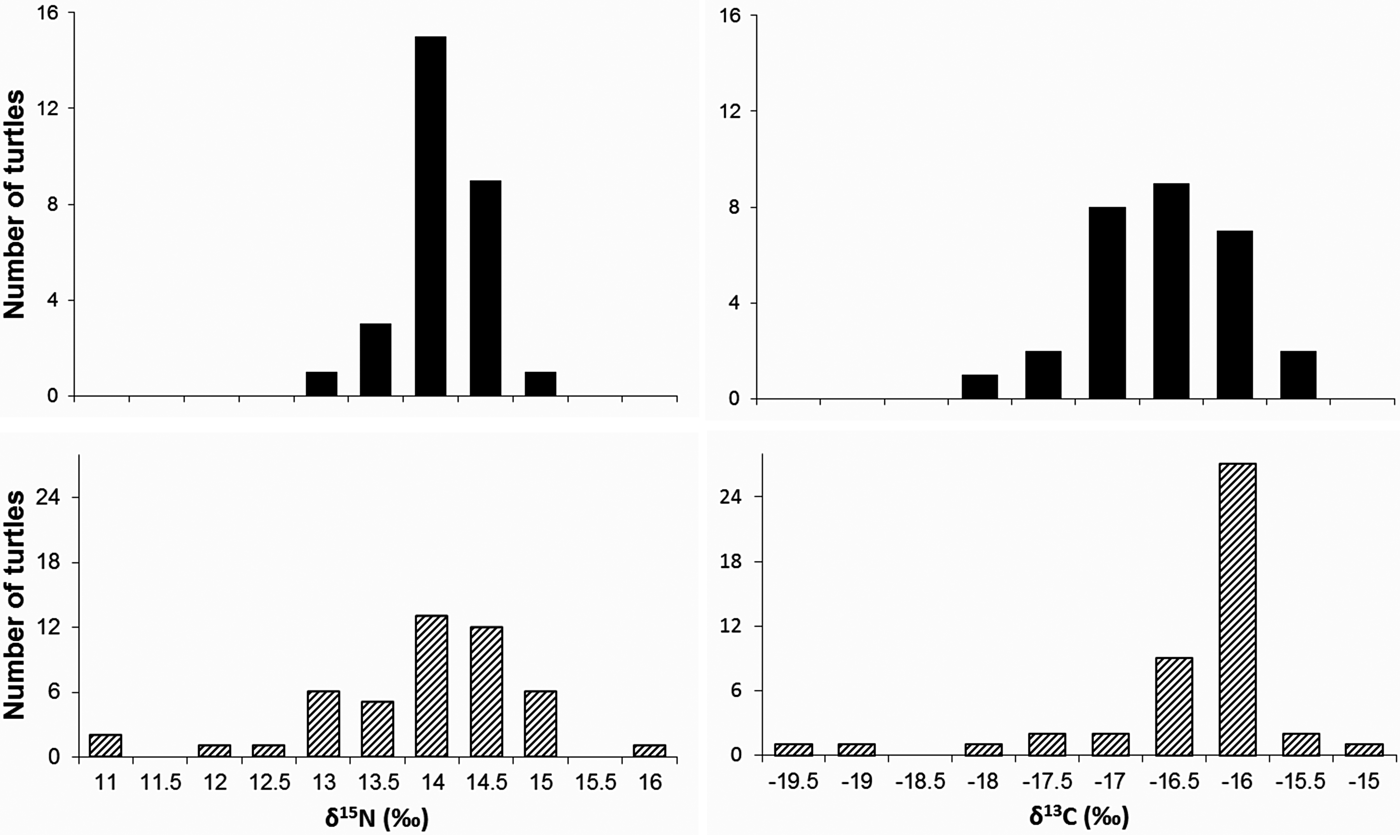
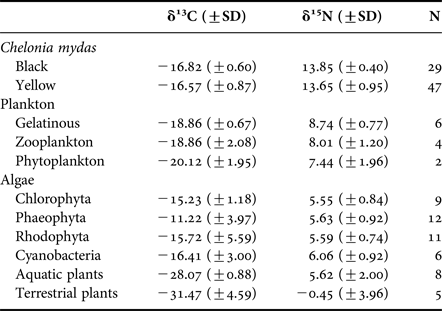
A total of 29 black morphotype and 47 yellow morphotype C. mydas juveniles were sampled from February to December 2012. Although isotopic values were not significantly different between the two morphotypes (δ13C: t-test, N1 = 29, N2 = 47, P = 0.17; δ15N: t-test, N1 = 29, N2 = 47, P = 0.28) (Figs 4–6), yellow morphotype values were more variable than those of black morphotype turtles, as can be seen by the higher SD and wider range (Figure 5). Mean δ13C of black morphotype turtles was −16.82 (SD = 0.60; range = −18.06 to −15.76), whereas that of yellow morphotype turtles was −16.57 (SD = 0.87; range = −19.85 to −14.69). Mean δ15N of black morphotype turtles was 13.85 (SD = 0.40; range = 12.95 to 14.85), whereas that of yellow morphotype turtles was 13.65 (SD = 0.95; range = 10.75 to 15.79) (Figure 4).
Biplot of δ15N and δ13C values of black and yellow Chelonia mydas and potential food items sampled at GNP from February to December 2012. Gelatinous includes gelatinous invertebrates such as siphonophores, jellyfish and salps; Aquatic plants include water hyacinth and mangrove fruit.

Frequency of δ15N and δ13C values of black (black bars) and yellow (stippled bars) Chelonia mydas sampled at GNP from February to December 2012.

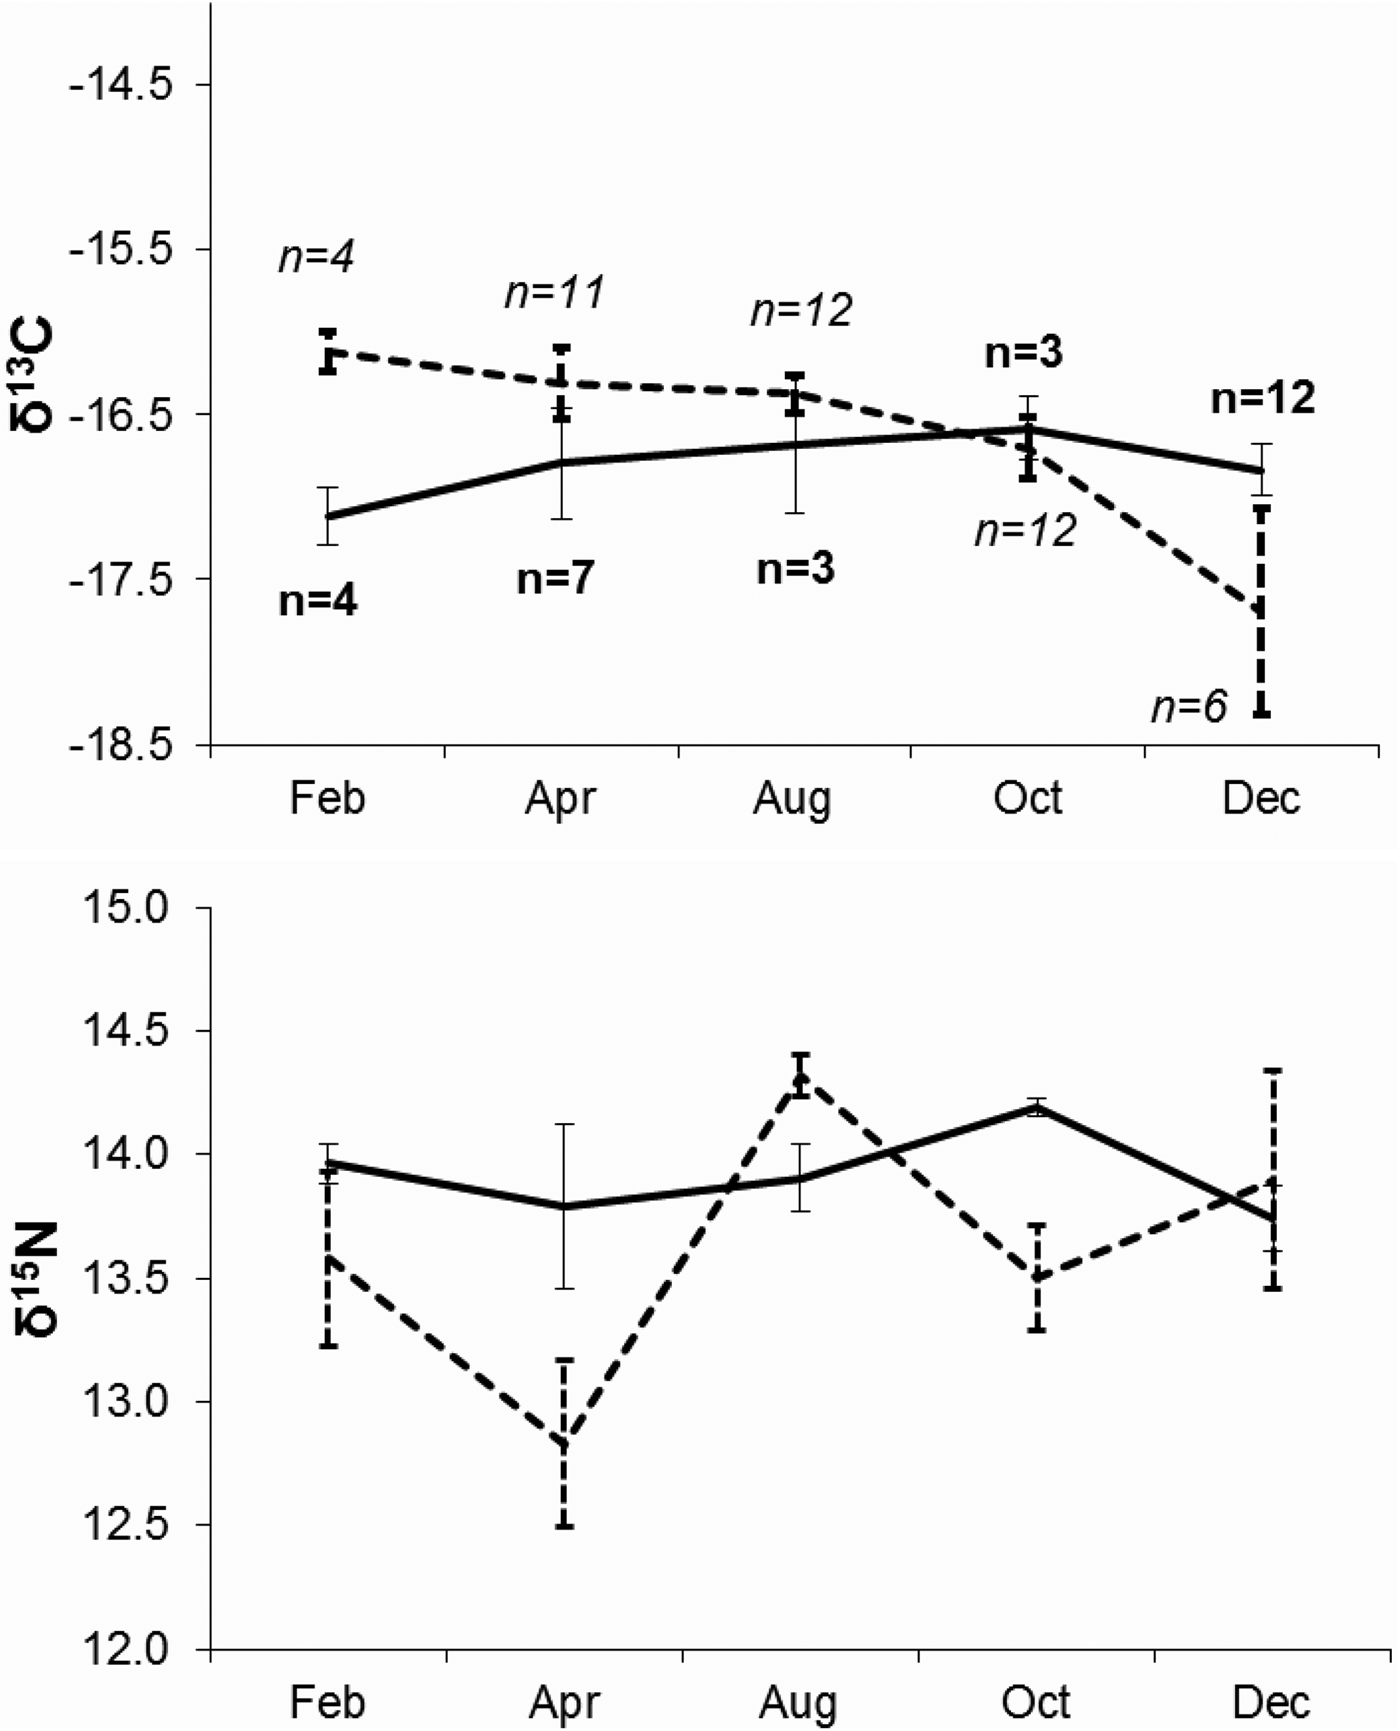
δ13C and δ15N values per sampled month for black (solid line) and yellow (dotted line) C. mydas caught at GNP between February and December 2012. Number of samples is shown in the upper panel, number of black morphotype turtles in bold, number of yellow morphotype turtles in italics.

Isotopic values of black morphotype turtles did not change over time (δ13C: F = 0.37, P = 0.83; δ15N: F = 0.78, P = 0.55), whereas there was a significant change in isotopic values of yellow morphotype turtles during the year of sampling (δ13C: F = 4.60, P = 0.004, df = 4; δ15N: F = 3.57, P = 0.01, df = 4). The δ13C values of yellow morphotype turtles were significantly lower in December, while δ15N values were significantly higher in August (Unequal Tukey HSD test, P < 0.01; Figure 6).
The values of algae, aquatic plants, cyanobacteria, terrestrial plants and plankton were significantly different from each other (δ15N: H(4, N = 63) = 31.929, P < 0.001; δ13C: H(4, N = 63) = 42.9309, P < 0.001). These different food sources could therefore be used as separate sources in the MixSIAR model, since their isotopic values were significantly different and would occupy different spaces in the isoplot. Running this model, however, did not result in a feasible solution. Additional potential food sources would need to be sampled to obtain results in a mixing model.
The calculation of trophic level using the equation proposed by Post (Reference Post2002) requires a homogeneous isotopic signal of the baseline. In this study algae were sampled over 1 year (November 2011 to December 2012), so that variations in isotopic values were taken into account (Table 5). A Kruskal–Wallis test showed that algal isotopic values (Chlorophyta, Rhodophyta and Phaeophyta) were not significantly different from each other (H (2, N = 32) = 0.143) so the overall mean of algae isotopic values (5.59‰) was used as δ15N baseline, and λ = 1. The calculated trophic level using stable isotope values was 3.5 for black morphotype turtles and 3.4 for yellow morphotype turtles.
δ13C and δ15N values of black and yellow morphotype Chelonia mydas and potential food items sampled at GNP between November 2011 and December 2012.

DISCUSSION
This study provides information on the diet and use of resources of a juvenile aggregation comprising the two known morphotypes of Chelonia mydas at an insular foraging ground. This information complements what has been reported for black morphotype C. mydas at this location, and is the first to consider diet intake in the context of resource availability.
There was no significant difference in the diet of black and yellow morphotype juveniles at GNP, which indicates that individuals are sharing the same resources at this foraging site. Contrary to what has been observed previously (Amorocho & Reina, Reference Amorocho and Reina2007) tunicates were not the main food item consumed. Terrestrial plants were the most frequently consumed item, whereas invertebrates comprised a low percentage by frequency and by volume of the diet, and tunicates occurred infrequently. Mangrove fruits and leaves have been reported in the diet of green turtles from the Galapagos Islands (Carrión-Cortez et al., Reference Carrión-Cortez, Zárate and Seminoff2010), Bahía Magdalena, Mexico (López-Mendilaharsu et al., Reference López-Mendilaharsu, Gardner, Seminoff and Riosmena-Rodríguez2005) and Australia (Read & Limpus, Reference Read and Limpus2002), but the only other study to report terrestrial plant matter as an important part of the diet of neritic green turtles was carried out at the same foraging site (Amorocho & Reina, Reference Amorocho and Reina2007). The present study therefore corroborates that green turtles at GNP consume a terrestrial food resource, which indicates nutrient cycling from terrestrial to marine areas through marine turtles. These plants could have entered the ocean from the coastal area of the park or could have been carried over from the continent.
In their study, Amorocho & Reina (Reference Amorocho and Reina2007) reported that green turtles at GNP consumed large amounts of pelagic tunicates. The turtles in that study belonged to the black morphotype, as yellow morphotype turtles were very rarely observed in GNP at the time (Sampson et al., Reference Sampson, Payán, Amorocho, Seminoff and Giraldo2014) and were not included in that analysis. However, tunicates are not available at GNP in high abundance year-round (Sampson & Giraldo, Reference Sampson and Giraldo2014), and it is possible that black morphotype turtles have evolved a behaviour where they use pulses of invertebrate resources whereas yellow morphotype turtles maintain a diet mainly based on algae. This would explain the higher incidence of invertebrates and tunicates in lavages of black morphotype turtles compared with yellow morphotype turtles. Green turtles at GNP seemed to rely on opportunistic ingestion of terrestrial plants and invertebrate pulses, while selecting a few algae species from what was available on the reefs. Non-selectivity and opportunism in the diet of green turtles have been reported at other locations, such as Nicaragua (Mortimer, Reference Mortimer1981), Queensland, Australia (Read & Limpus, Reference Read and Limpus2002), Western Australia (Heithaus et al., Reference Heithaus, McLash, Frid, Dill and Marshall2002), Bahía Magdalena, Mexico (López-Mendilaharsu et al., Reference López-Mendilaharsu, Gardner, Seminoff and Riosmena-Rodríguez2005), the south-west Pacific (Boyle & Limpus, Reference Boyle and Limpus2008) and Hawaii (Arthur & Balazs, Reference Arthur and Balazs2008). It would therefore seem that this type of feeding behaviour is exhibited by individuals of the two C. mydas morphotypes throughout their distribution range in the eastern Pacific Ocean.
The number of algae species present at GNP (85 species; Bula-Meyer, Reference Bula-Meyer and Pinto1995) is relatively low compared with nearby eastern Pacific locations: 216 algae species at Costa Rica, 174 algae species at Panama, 146 algae species at El Salvador (Fernández-García et al., Reference Fernández-García, Riosmena-Rodríguez, Wysor, Tejada and Cortés2011), and compared with other sea turtle foraging areas: 115 algae species on Heron Reef, Australia (Forbes, Reference Forbes1996), ~400 algae species in the Hawaiian Islands (Arthur & Balazs, Reference Arthur and Balazs2008). The amount of coral vs algae cover (~55% coral: 29% algae) seems to indicate that algal abundance tends to be low on the reefs (Zapata et al., Reference Zapata, Rodríguez-Ramírez, Caro-Zambrano and Garzón-Ferreira2010), which corroborates that algal availability at GNP is low and green turtles need to supplement their diet with other resources.
The rodolith Sporolithon sp. was found to be the most abundant alga on both reefs during the length of this study, while turf algae (an assemblage of several small filamentous green and red algae), and the green alga Cladophora sp. were the most important in terms of relative abundance. Sporolithon sp. has been reported as the most abundant alga at La Azufrada reef, but the most abundant algae reported for the Playa Blanca reef were Lithophyllum sp., Gelidium pusillum, Sporolithon sp., Amphiroa crosslandii, Hypnea valentiae and Polyphysa clavata (Murillo-Muñoz & Peña-Salamanca, Reference Murillo-Muñoz and Peña-Salamanca2014). The difference in results with the present study could be due to sampling protocol or timing of the samples, as not all algae species were found in every sampled month during this study, and the total area sampled was small.
The main algae consumed by green turtle juveniles at GNP were Cladophora sp., Dictyota sp. and Hypnea pannosa. Both black and yellow morphotype turtles selected the brown alga Dictyota sp., which had the highest protein and fat content of the analysed algae, as well as the lowest ash content, and less fibre than the green alga Cladophora sp. This latter species had high protein content but higher lignin and fibre content than Dictyota sp., making it less nutritionally advantageous to turtles, as high lignin content is indicative of low nutritional value (Karasov & Martínez del Río, Reference Karasov and Martínez del Río2007).
It would appear that green turtle diet at GNP is of lower nutritional value than that of turtles in the Bahamas that feed on Thalassia testudinum blades. This seagrass species has lower lignin content and is therefore more nutritious than algae in this study and terrestrial plants previously analysed at our study site (Bjorndal, Reference Bjorndal1979; Amorocho & Reina, Reference Amorocho and Reina2007); this would explain the low growth rates found at GNP (Sampson et al., Reference Sampson, Giraldo, Payán, Amorocho, Eguchi and Seminoff2015). Higher growth rates than those found at GNP were also reported for black morphotype turtles at high-productivity locations off the coast of Peru (Velez-Zuazo et al., Reference Velez-Zuazo, Quiñones, Pacheco, Klinge, Paredes, Quispe and Kelez2014). The difference in growth rates between these geographic locations could be due to higher quality or more abundant resources being consumed at the Bahamas and Peru locations, which resulted in faster growth rates. The fact that condition indices are similar (1.49 and 1.55 at the Peru locations; 1.38 for black and 1.49 for yellow turtles at GNP), however, points to resources at GNP being sufficient for green turtles at this location to result in good body condition (Sampson et al., Reference Sampson, Payán, Amorocho, Seminoff and Giraldo2014; Velez-Zuazo et al., Reference Velez-Zuazo, Quiñones, Pacheco, Klinge, Paredes, Quispe and Kelez2014).
Compared with the range of isotopic values reported by Burkholder et al. (Reference Burkholder, Heithaus, Thomson and Fourqurean2011) for yellow turtles in Australia, the δ13C variability of turtles at GNP was relatively low, which could be indicative of residency in the coastal area. In this study green turtles had low isotopic variance, which suggests that they stayed within the GNP foraging area during the turnover time of epidermis (3–4 months for loggerhead turtle Caretta caretta Linnaeus, 1758 epidermis; Reich et al., Reference Reich, Bjorndal and Martínez del Río2008). Turtles sampled had probably already spent some time in the neritic zone, integrating the isotopic values of neritic food consumed within GNP over the last few months. The wider range in yellow turtle isotopic values suggested greater diversification in the diet of yellow turtle individuals, with black turtles possibly being more specialized.
The low variability in green turtle δ15N values indicates similarity in the diet and physiology of individuals of both morphotypes present at GNP. Since all individuals sampled were juveniles within a narrow range of sizes, we did not expect large physiological differences. The low variance of isotopic values of both morphotypes (black turtle δ15N SD = 0.40; yellow turtles δ15N SD = 0.95) could indicate specialization in feeding, or it could be due to synchronous changes in diet in the population, for example when taking advantage of resource pulses (Bearhop et al., Reference Bearhop, Adams, Waldron, Fuller and Macleod2004). Further studies should be undertaken to elucidate this. If turtles are opportunistically relying on ephemeral invertebrate resources this could be ascertained by sampling tunicates and/or other invertebrates during their abundance peaks and comparing the isotopic signal with that of green turtles. If this is a resource on which green turtles rely, the effect of possible changes in temperature or currents due to climate change should be studied as they could have an impact on resource availability for green turtles.
The tissue of black morphotype turtles did not change significantly during the study period, whereas δ15N values of yellow morphotype turtles were higher in August 2012, and δ13C values were lower in December 2012. These differences could be reflecting an actual change in the isotopic baseline of the environment, but given the lack of difference in diet between the two morphotypes, it is probably due to individual isotopic differences of the turtles sampled during those months. It is possible that the yellow morphotype turtles captured in August and December had recently arrived to GNP and were reflecting isotopic signals of a different geographic location, or that they had moved out of the study area to forage.
We used the isotopic values of several algae species collected over 1 year in order to obtain an isotopic baseline value that integrated temporal variability. There was large variability in δ13C values of algae both among and within species; high δ13C variability over time is typical of what has been reported for algae (Cornelisen et al., Reference Cornelisen, Wing, Clark, Bowman, Frew and Hurd2007). δ15N variability was much lower, allowing us to use this food source as δ15Nbaseline. The calculated trophic level for black and yellow morphotype sea turtles at GNP (3.5 and 3.4 respectively) was higher than expected. If green turtles were entirely herbivorous, they should have a trophic level of ~2, and if they included only small invertebrates in their diet, their trophic level should be similar to that reported for Cetorhinus maximus, a zooplanktivorous shark, by Estrada et al. (Reference Estrada, Rice, Lutcavage and Skomal2003) (TL = 3.1). The trophic level calculated in this study is indicative of a diet that includes diet items higher up the food chain (large invertebrates or possibly even fish). The higher δ15N and higher calculated trophic position found in this study point to green turtles at GNP not being completely herbivorous, because the inclusion of animal matter would increase their trophic level. If green turtles at GNP are indeed consuming fish as has been reported for other green turtle aggregations (Cardona et al., Reference Cardona, Aguilar and Pazos2009), potential sources should be identified, as interactions with fishermen when turtles forage on discarded fish could pose a potential threat to this protected species.
Potential food items had significantly different isotopic values, which allowed their use in the MixSIAR model as independent food sources (Stock & Semmens, Reference Stock and Semmens2013). No feasible solution could be found with this model, however. The lack of solution of the MixSIAR model was caused by the position of green turtle isotopic values on the isotopic biplot above that of habitat samples, because in order to find a solution the consumer's isotopic values should be located midway between those of their potential prey (Stock & Semmens, Reference Stock and Semmens2013). Similarly, Cardona et al. (Reference Cardona, Aguilar and Pazos2009) found that in a mixing model of green turtle diet in Mauritania fish had to be included, because using only jellyfish, seagrasses and macroalgae did not result in feasible solutions. Habitat samples collected during this study for isotopic analysis were selected based on what was identified in lavage samples. No large invertebrates were identified in lavages, so these items were not collected, resulting in turtles being placed at a high position on the biplot. This is a result of the bias inherent to lavages, which only allow the collection of samples below the diameter of the collection tube. The inclusion in future studies of large invertebrates, small fish and tunicates obtained during abundance peaks could help further explain isotopic results obtained here and could also provide useful information in other areas with sea turtle feeding aggregations, as green turtles can include invertebrate matter in their diet, as was previously discussed.
The high position of sea turtles in the isotopic biplot could also be explained by the effect of decomposition on isotopic values of free-floating vegetation. If turtles fed on leaves that had been floating in the ocean for several days/weeks the decomposition of that material probably resulted in changes to the isotopic values, as has been reported for example for water hyacinth in Brazil, where δ15N values of decomposing plants increased over time (Fellerhoff et al., Reference Fellerhoff, Voss and Wantzen2003). This type of resource should also be sampled in future to identify the source of higher δ15N values found in GNP sea turtles. Another possible explanation is that individuals at GNP are not in good nutritional condition and therefore their values are more elevated, as it has been reported that individuals that are in poor nutritional condition have elevated δ15N values (Hobson et al., Reference Hobson, Alisauskas and Clark1993). However, the fact that condition indices at GNP were similar to those obtained off Peru where growth rates are quite high would tend to discard this explanation (Velez-Zuazo et al., Reference Velez-Zuazo, Quiñones, Pacheco, Klinge, Paredes, Quispe and Kelez2014).
It should be noted that this feeding ground provides habitat for turtles from distant origins (Amorocho et al., Reference Amorocho, Abreu-Grobois, Dutton and Reina2012) and is therefore of conservation importance. Algal resources on the reef seem to be limited and the two morphotypes are sharing available resources, taking advantage of high energy (higher up the food chain) resources. More studies are needed to identify other possible food resources for GNP turtles, as this location is part of an important marine corridor and could be vital for the migration of juveniles towards their adult breeding grounds.
In conclusion, black and yellow morphotype juvenile C. mydas captured at GNP did not have a significantly different diet; both consumed mostly terrestrial plants and a lower proportion of invertebrates and algae. There was a difference, however, in selectivity and in variability of isotopic values, which indicated higher specialization in black turtles than yellow turtles. The trophic level of green turtles at GNP as well as the lack of a feasible mixing model solution indicated that these juveniles are consuming prey higher on the food chain than would be expected from oesophageal lavages alone.
ACKNOWLEDGEMENTS
Fieldwork was carried out under permit PIDB DTPA 018–11 granted to LS by the Special Administrative Unit of the Colombian Wildlife National Parks. We thank the Colombian Wildlife National Parks (Programa de Monitoreo de VOC del PNN Gorgona) for assistance in data collection. We are grateful to Enrique Peña Salamanca for his help with identification of algae specimens, to Bellineth Valencia for her help with invertebrate identification, and to Joel Schumacher for his help with stable isotope analyses. We thank all individuals involved in data collection.
FINANCIAL SUPPORT
This research is part of LS's doctoral research, for which she received funding from the Natural Sciences and Engineering Research Council of Canada (PGSD3- 374164) and a teaching assistantship from the Biology Department at the Universidad del Valle.