Introduction
Since the birth of Dolly in 1996 (Wilmut et al., Reference Wilmut, Schnieke, McWhir, Kind and Campbell1997), nuclear transfer technology has developed rapidly, and many offspring from various species have been born. The nuclear transfer embryos, however, show reduced competence resulting in decreased pregnancy and birth rates after transfer when compared with in vivo-produced embryos. The reduced competence of nuclear transfer embryos is associated with morphological deviations during bovine prehatching development (Laurincik et al., Reference Laurincik, Zakhartchenko, Avery, Stojkovic, Brem, Wolf, Miiller and Hyttel2000, Reference Laurincik, Zakhartchenko, Stojkovic, Brem, Wolf, Müller, Ochs and Maddox-Hyttel2002; Hyttel et al., Reference Hyttel, Laurincik, Zakhartchenko, Stojkovic, Wolf, Müller, Ochs and Brem2001; Baran et al., Reference Baran, Vignon, LeBourhis, Renard and Flechon2002). In these investigations, however, most attention was paid to the nuclear structure and function. Thus, there is a need to focus on the changes in the cytoplasm that have occurred by nuclear transfer.
It is well known that the quality of in vitro-produced (IVP) embryos is compromised if compared with in vivo embryos living in a physiologically optimal microenvironment. The in vitro-fertilized embryos differ ultrastructurally from those produced in vivo. For example, in vitro-fertilized compact morulae of cattle had a greater volume density of lipid droplets (LD), a reduced proportional volume of total mitochondria, a greater volume density of vacuoles, and an increased cytoplasmic-to-nuclear ratio (Crosier et al., Reference Crosier, Dykstra, Alexander and Farin2000). Moreover, the blastomeres of in vivo embryos had a tendency to be rounder up to the 16-cell stage and to form a more compact mass at the morula stage than their IVP counterparts. Some structures (such as microvilli, phagosomes/lysosomes, intercellular junctions and intermediate filaments) appeared or reappeared, while others (such as LD, vesicles with flocculent materials, cortical granules, nuclear annulate lamellae, nuclear envelope blebs) decreased or disappeared. These changes were observed about the time of the 1-cell stage and were later in IVP than in in vivo embryos. Other structures present in both IVP and in vivo embryos either changed (such as mitochondria, ER, Golgi apparatus and nucleoli) or did not change (cytoplasmic annulate lamellae). Vacuolated nucleoli in both IVP and in vivo embryos were observed from the 2-cell stage (Plante & King, Reference Plante and King1994). Compared with in vivo embryos, IVP embryos had decreased volume densities of cytoplasm, of mitochondria and of nuclei, and increased volume densities of mature mitochondria, nuclei, blastocoele, and apoptotic bodies, proportional volumes of nuclei and inclusion bodies in inner cell mass cells of blastocysts and proportional volume of vacuoles and the volume density of lipid (Crosier et al., Reference Crosier, Farin, Dykstra, Alexander and Farin2001). Bovine blastocysts produced in vitro possessed deviations in volume densities of organelles associated with cellular metabolism, as well as deviations associated with altered embryonic differentiation (Crosier et al., Reference Crosier, Farin, Dykstra, Alexander and Farin2001).
The optimization of the in vitro culture system may improve the developmental capacity by improving the ultrastructural features of embryos. For instance, growth hormone (GH) treatment promoted the development of bovine IVP embryos by eliminating glycogen storage in the inner cell mass, stimulating the exocytosis of lipid vesicles of blastocysts, increasing the volume density of embryonic mitochondria, and altering ZP structure and pore size (Sabine et al., Reference Sabine, Miodrag, Sven, Horst-Dieter, Eckhard and Fred2004). Epidermal growth factor (Makarevich et al., Reference Makarevich, Chrenek, Zilka, Pivko and Bulla2005) and heat shock also influenced the embryo ultrastructure (Rivera et al., Reference Rivera, Kelley, Erdos and Hansen2003).
Morphometric analysis offers a more objective method of assessing differences in cellular ultrastructure than may occur in embryos because of nuclear transfer. Interspecies nuclear transfer is an invaluable tool for studying nucleus–cytoplasm interactions, and it provides a possible alternative to clone animals whose oocytes are difficult to obtain (Wen et al., Reference Wen, Yang, Cheng, Li, Liu, Sun, Zhang, Lei, Wu, Kou and Chen2003). By now, very few reports have been seen on the ultrastructural change of embryos produced by interspecies nuclear transfer (Hamilton et al., Reference Hamilton, Peura, Laurincik, Walker, Maddocks and Maddox-Hyttel2004). The objective of the present study was to use morphometric analysis to investigate the ultrastructure of organelles in interspecies cloned embryos at early stage.
Materials and Methods
Reagents and chemicals
All chemicals and reagents, unless otherwise specified, were from Sigma. Tissue culture medium 199 (TCM-199), Dulbecco's modified Eagle's medium/nutrient mixture, F12 Ham's (DMEM/F12, 1:1, Gibco-BRL), and M2 medium (M-7167) were used for oocyte in vitro maturation and embryo in vitro culture. Fetal bovine serum (FBS) used in the study was purchased from Gibco. Follicle-stimulating hormone (FSH) and luteinizing hormone (LH) were purchased from Institute of Zoology, Chinese Academy of Sciences. Estrogen (E2), hyaluronidase (HAE), cytochalasin B, HEPES and mineral oil.
In vivo embryo production
For production of in vivo embryos (multiple ovulations, MO), goat donors were superovulated by intramuscular (i.m.) administration of FSH given in a series of decreasing doses over a 3- or 4-day period. Estrus was induced by i.m. administration of prostaglandin F2α on the morning and evening of the third or fourth day of FSH treatment. The donor goats were inseminated three times after first standing estrus with semen. Embryos used in this study were recovered by surgical uterine flushing on either day 1, 2, 2.5 or 4 after first insemination. The recovered embryos at the 2-cell, 4-cell, 8-cell, and 16-cell stages were identified respectively.
Embryo reconstruction by nuclear transfer
The cloned embryos were reconstructed by using the methods reported previously (Liu et al., Reference Liu, Zhang, Chen, Zhang, Zhang, Jin, Wang, Zhang, Li, Li, Zhao and Cheng2004; Zhang et al., Reference Zhang and Liu2004, Reference Monika, Schernthaner, Sinowatz and Wolf2005). In brief, Boer goat ear skin slices were collected, and then the fibroblast cell line was established. The cumulus and oocyte complexes of goat and cattle were collected from a local slaughterhouse, and then matured in vitro. The oocytes at metaphase II were chosen and used as recipients. By micromanipulation, the goat somatic cells were transferred to goat and cattle oocytes respectively. Then, the reconstructed intraspecies or interspecies embryos were obtained by fusion and activation, and then the reconstructed embryos developed to the 2-cell, 4-cell, 8-cell, and 16-cell stages.
Preparation of ultrathin sections
Embedment procedures were modified from Crosier et al. (Reference Crosier, Dykstra, Alexander and Farin2000) and Hamilton et al. (Reference Hamilton, Peura, Laurincik, Walker, Maddocks and Maddox-Hyttel2004). In brief, the embryos at different stages were fixed respectively in 2.5% (v/v) glutaraldehyde (SP1-CHEM) in phosphate-buffered saline (PBS, 0.01 M sodium phosphate, 0.15 M sodium chloride, pH 7.4), and then held at 4 °C until processed for transmission electron microscopy. The embryos were removed from fixative and washed three times for a total of 15 min in 0.1 M PBS. A solution of low-melting-point agarose (4% w/v) was prepared in 0.2 M PBS, and embryos were individually transferred into liquid agarose at 37 °C. The agarose was cooled to 25 °C and allowed to harden. Agarose-embedded embryos were then removed as individual 3 mm3 blocks with a razor blade. Agarose blocks were postfixed in 1% osmium tetroxide (OsO4, SP1-Chem.) in 0.2 M PBS for 90 min. The samples were washed three times in deionized water for a total of 15 min, subjected to an alcohol dehydration series (30% 10 min, 50% 15 min, 70% 2 h or overnight, 80% 10 min, 95% 15 min, 100% 30 min, 100% 30 min). The embryos were removed to 1,2-epoxypropane (Lingfeng Chemical Co. Ltd) 30 min for transparence, and then transferred to 1,2-epoxypropane and resin Epon812 (1:1) 1.5 h. Samples were individually embedded in 50% Epon812 (Serva), 12% dodecenyl succinic anhydride (DDSA, SP1-Chem.), and 38% nadic methyl anhydride (MNA, SP1-Chem.). Resin blocks were solidified at 45 °C for at 12 h, and 60 °C for at least 48 h. Ultrathin sections (80 nm thick) were prepared from each embryos with an ultrathin section machine (LKB-NUBA, NOVA) and blade (LKB2178, knife maker II, BROMMA). The ultrathin sections were placed in Butvar-covered 75-mesh copper grids. Sections were poststained with 1% (w/v) methanolic uranyl acetate (Lanzhou State-owned Factory 404) 5 min, and then 2.66% Reynolds lead citrate (SP1-Chem) 5 min. The sections were rinsed in a stream of distilled water and dried prior to examination. Sections were visualized on a transmission electron microscope (Jeol, JEM-1230). Seven to 10 random micrographs were taken to represent each embryo.
Ultrastructure analysis
Selected organelles and structures were examined: mitochondria, zona pellucida (ZP), Golgi apparatus (Gi), endoplasmic reticulum (ER), lipid droplet (LD), vesicles, lysosomes and the nucleus.
Three types of normal mitochondria were distinguished: (i) mature mitochondria (MM) containing well developed and evenly stacked cristae; (ii) hooded mitochondria (HM), i.e. immature mitochondria having poorly developed, peripheral cristae and a particular hood; and (iii) vacuolated mitochondria (VM) containing a membrane-bound vesicle. The volume densities for the three individual mitochondrial types were added to represent the volume density of total mitochondria (Crosier et al., Reference Crosier, Farin, Dykstra, Alexander and Farin2001). Three random embryos at each stage were used. Five random micrographs were taken to count the total number of mitochondria of each embryo. The proportion of HM to MM was calculated, at the same time, the morphologically abnormal mitochondria were counted, and the proportion to the total mitochondria was calculated. Meanwhile, LD diameter was evaluated, and then compared with the mitochondrial diameter. Moreover, the volume density occupied by other cellular components was determined by the point count method using a sampling of five to six random micrographs from each embryos.
Statistical analysis
Data were expressed as mean ± SEM. The frequencies were subjected to arcsine transformation and analysed by chi-squared test. A p value < 0.05 was considered statistically significant.
Results
Zona pellucida
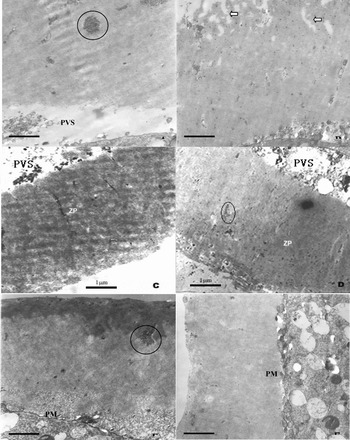
Three types of embryos differed in the change of surface, pore, perivitelline space (PVS) and thickness of ZP (Fig. 1).
Representative zona pellucida (ZP) morphology of different embryos. (a) Goat–cattle reconstructed embryo at the 2-cell stage. (b) Goat–cattle reconstructed embryo at the 8-cell stage. (c) Goat–goat reconstructed embryo at the 2-cell stage. (d) Goat–goat reconstructed embryo at the 8-cell stage. (e) Goat in vivo fertilized embryos at the 2-cell stage. (f) Goat in vivo fertilized embryos at the 8-cell stage. The gathering glycogen is shown (circle). The pores in the zona pellucida are shown (arrow). ZP, zona pellucida; PVS, perivitelline space, PM, cytoplasmic membrane. Bar = 1μm.

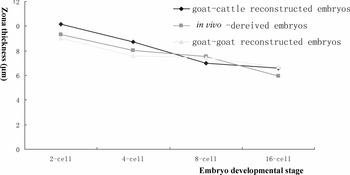
Change of ZP thickness of different embryos. Each value was the mean from photographs (n = 7–9) of three embryos. No significant difference was found between the three types of embryo at the same stage (p < 0.05).

Mitochondria
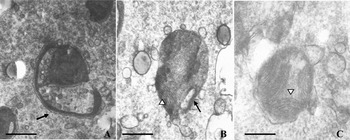
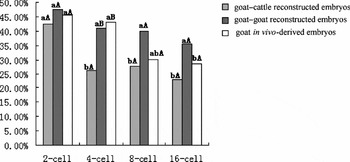
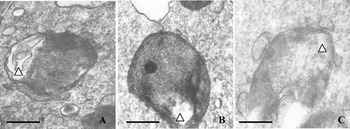
Three types of normal mitochondria were found in each embryo: HM containing few cristae (Fig. 3a), VM with vesicles and cristae (Fig. 3b), and MM (Fig. 3c). The proportion of HM to mitochondria was calculated for all three types of embryos (Fig. 4). Generally, the rate decreased for all the three types of embryos along with development. For GC embryos, HM rate at 2-cell stage (42.5%) was significantly higher than that of 4-cell (26.4%), 8-cell (27.8%) and 16-cell stages (23.2%) (p < 0.05). For GG embryos, the HM rate showed no significant change from the 2- to the 16-cell stage (p > 0.05). For in vivo-derived embryos, the HM rate at the 2-cell (45.6%) and the 4-cell stages (43.1%) was significantly higher than that at the 16-cell stage (28.7%) (p < 0.05). HM rate of GC embryos at the 4-cell stage was significantly lower than that of GG embryos and in vivo-derived embryos at the same stage (p < 0.05). HM rate of GG embryos had no statistical difference with that of in vivo-derived embryos at all stages (p > 0.05).
Electron micrographs showing different types of mitochondria. (a) Hooded mitochondria (HM) containing few cristae and a typical hood (arrow). (b) Vacuolated mitochondria (VM). The vacuole (arrow) and cristae (arrowhead) are shown. (c) Mature mitochondria (MM) presenting many cristae (arrowhead). Bar = 200 nm.

Proportion of hooded mitochondria in different embryos. a, b – Values compared at different stages of the same type of embryos, Groups lacking common letters are significantly different (p < 0.05). A,B – Values compared in different types of embryos at the same stage. Groups lacking common letters are significantly different (p < 0.05).

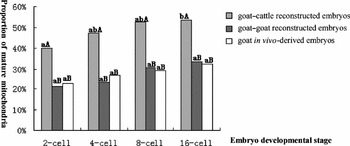
The proportion of MM to total normal mitochondria was calculated for three types of embryos (Fig. 5). Generally, the rate increased for all the three types of embryos along with the development. For GC embryos, MM rate at 16-cell stage (53.6%) was significantly higher than that of the 2-cell stage (40.0%) (p < 0.05). MM rate of GC embryos was significantly higher than that of GG embryos at the same respective stages (p < 0.05). MM rate of GG embryos had no difference with that of in vivo-derived embryos (p > 0.05). GG embryos displayed the same change as in vivo-derived embryos, while, in GC embryos, the HM were more quickly replaced by MM.
Proportion of mature mitochondria of different embryos. a,b – Values compared at different stages of the same type of embryos, Groups lacking common letters are significantly different (p < 0.05). A,B – Values compared in different types of embryos at the same stage. Groups lacking common letters are significantly different (p < 0.05).

Besides the normal mitochondria, morphologically abnormal mitochondria were also found, more or less, in all the three types of embryos at any stage. Deviations included myelin denaturalization, the matrix coagulation and rupture of membranes (Fig. 6a–c). The proportion of morphologically abnormal mitochondria to total mitochondria was examined (Table 1). In GC embryos, this rate was significantly higher at the 8-cell stage (51.5%) that at the 2-cell (31.0%) and the 4-cell stages (38.1%) (p < 0.05), but not different from that at the 16-cell stage (42.9%, p < 0.05). In GC embryos, the proportion of abnormal mitochondria at the 4-cell, 8-cell, and 16-cell stages was significantly higher than that at the 2-cell stage (20.6%, p < 0.05). In contrast, in vivo-derived embryos had no significant change in the proportion (p > 0.05). GC embryos had a significantly higher proportion of abnormal mitochondria than in vivo-derived embryos at the same respective stages (p < 0.05), but had no significant difference as compared with GG embryos at 4-cell, 8-cell, and 16-cell stages (p > 0.05). GG embryos showed a significantly higher proportions of abnormal mitochondria at the 4-cell, 8-cell, 16-cell stages than in vivo-derived embryos at the same stages (p < 0.05).
Electron micrographs showing representative morphology of abnormal mitochondria. (a) Myelin denaturation. (b) Lucent mitochondrial matrix. (c) Membrane breakdown, ruptured cristae. The abnormal structures in mitochondria were shown respectively (arrowheads). Bar = 200 nm.

Proportion of abnormal mitochondria in different embryos

a,b Values within the same row lacking common letters are significantly different (p < 0.05); c,d values within the same column lacking common letters are significantly different (p < 0.05).
Golgi apparatus
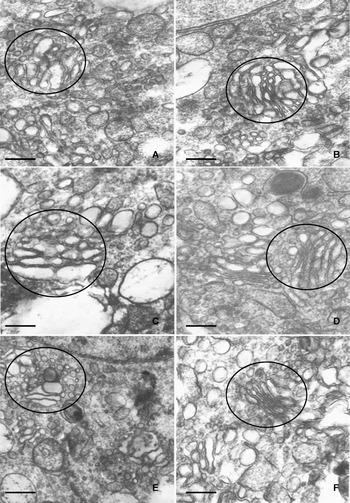
No well developed Gi was found in GC embryos at the 2-cell or the 4-cell stage. In GC the 8-cell embryos, poorly polarized Gi, with no clear secretion side (concave) or mature side (convexity), were distinguished (Fig. 7a). At the 16-cell stage, Gi had developed further and had become polarized. The secretion side presented small vesicles of medium electron density and different sizes (Fig. 7b). GG embryos had no Gi at the 2-cell or 4-cell stages. In the 8-cell stage, Gi started to form (Fig. 7c) and, at the 16-cell stage, Gi developed quickly with increased number and volume (Fig. 7d). In in vivo-derived embryos, no Gi was observed at the 2-cell and the 4-cell stages. At the 8-cell stage, Gi appeared near the nucleus. The morphology was similar to that seen in the two types of reconstructed embryos (Fig. 7e). At the 16-cell stage, the Gi had a typical structure (Fig. 7f).
Electron micrographs showing Golgi apparatus. (a) Goat–cattle reconstructed 8-cell embryo. (b) Goat–cattle reconstructed 16-cell embryo. (c) Goat–goat reconstructed 8-cell embryo. (d) Goat–goat reconstructed 16-cell embryo. (e) In vivo fertilized 8-cell embryo. (f) In vivo fertilized 16-cell embryo. SER, smooth endoplasmic reticulum. Gi, Golgi apparatus. Bar = 500 nm.

Endoplasmic reticulum
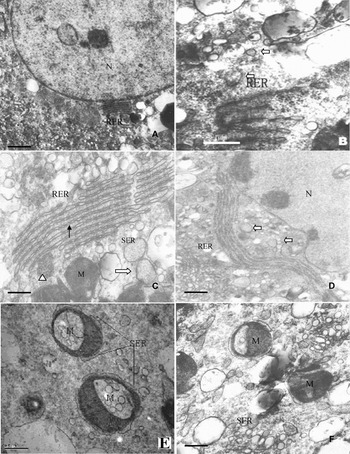
In in vivo-derived embryos, some rough ER (RER) appeared at the 8-cell stage (Fig. 8a). The RER cisternae became longer at the 16-cell stage. In GG embryos, likewise no RER was found at the 2-cell and 4-cell stages, while a sparse amount was observed at the 8-cell stage (Fig. 8b). In GC embryos, again no RER was found at the 2-cell and 4-cell stages, but RER developed abundantly at the 8-cell stage (Fig. 8c). The RER cisternae were longer at the 16-cell stage, approaching and connecting to the nuclear envelope (Fig. 8d). In summery, RER appeared at the same stage of development for three types of embryos, and the reconstructed embryos had the similar change of structure in RER. The SER was noted in all the three types of embryos at all stages. The electronic density of the SER was almost the same as of the cytoplasmic matrix. Many ribosomes were seen around the nucleus (Fig. 8d). The SER was close to Gi, RER, and especially mitochondria, and most mitochondria were surrounded by SER (Fig. 8e, f).
Electron-micrographs showing representative images of endoplasmic reticulum. (a) In vivo fertilized 8-cell embryo. (b) Goat–goat reconstructed 8-cell embryo. (c) Goat–cattle 8-cell embryo. (d) Goat–cattle reconstructed 16-cell embryo. (e,f) Representative structure of smooth endoplasmic reticulum (SER). The mitochondria surrounded by SER. RER, rough endoplasmic reticulum; M, mitochondria; N, nucleus. Long and thin arrows showed the gathering ribosomes. Thick and empty arrows showed RER. Triangle arrows indicate the aggregated ribosomes. Bars = 1μm.

Lipid droplet
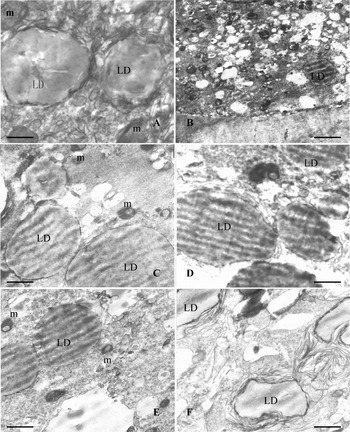
In in vivo-derived embryos, a few LD gathered at the 2- and 4-cell stages (Fig. 9a), but no aggregation was found at 8-cell stage, and most dispersed in the cytoplasm (Fig. 9b), while only few LD were observed at 16-cell stage. In GC embryos, aggregated LD were found at the 2-, 4- (Fig. 9)c, 8- (Fig. 9d) and 16-cell stages, and the degree of aggregation increased gradually, especially after the 4-cell stage. Around the LD, some mitochondria were often found (Fig. 9c–f). In GG embryos, a few LD gathered at the 2- and 4-cell stages (Fig. 9e), and even more at the 8-cell stage (Fig. 9f).
Electron-micrographs showing lipid droplets. (a) Goat in vivo-fertilized 4-cell embryo. (b) Goat in vivo-fertilized 8-cell embryo. (c) Goat–goat reconstructed 4-cell embryo. (d) Goat–goat reconstructed 8-cell embryo. (e) Goat–cattle reconstructed 4-cell embryo. (f) Goat–cattle reconstructed 8-cell embryo. LD, Lipid droplet; m, mitochondria. Bar = 400 nm.

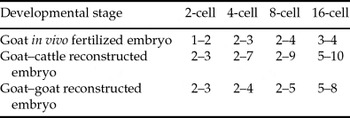
The diameter of LDs in the reconstructed embryos began to increase at the 4-cell stage, and reached a peak at the 16-cell stage (p < 0.05). The LD diameter in GG embryos at the 8-cell stage was significantly higher than that of GG embryos at the 2-cell stage (p < 0.05). In in vivo-derived embryos, the LD diameter also tended to increase with development, though not statistically significant (p> 0.05). GC embryos at the 4-, 8-, and 16-cell stages had significantly higher LD diameter than in vivo-derived embryos respectively (p < 0.05). GG embryos at the 8- and 16-cell stages had significantly higher LD diameter than those in in vivo-derived embryos at the same stages (p < 0.05) (Table 2). In summary, the lipid content of reconstructed embryos was increased, and this phenomenon was particularly pronounced in interspecies-reconstructed embryos. The ratio of LD diameter to mitochondria diameter increased for all three types of embryos, but this increase was steeper in GC embryos, especially from the 8-cell stage (Table 3).
Lipid droplet diameter change in different embryos

a−cValues within the same row lacking common letters are significantly different (p < 0.05); d,evalues within the same column lacking common letters are significantly different (p < 0.05).
Ratio of lipid droplet diameter to mitochondria diameter of different embryos

Lysosome
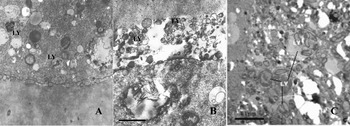
Lysosomes were found in in vivo-derived embryos at the 2-, 4-, 8-, and 16-cell stages without apparent change in number (Fig. 10a). In GC embryos, only a few lysosomes were observed at the 2-cell stage, while more were found at the 4-cell stage. In GG embryos, only a few lysosomes were found at the 2-cell stage, while more were observed at the 4-cell stage. A great number of sublysosomes, precursors of lysosomes, were found at the 8-cell stage, and some of these were found with some organelles licked up, as for the mitochondria with abnormal morphology (Fig. 10b,c).
Electron-micrographs showing lysosomes. (a) Goat in vivo-fertilized 8-cell embryo. A few lysosomes are contained. (b) Goat–cattle reconstructed 8-cell embryo. Many lysosomes are contained in perivitelline space (PVS). (c) Goat–goat reconstructed 8-cell embryo. Many lysosomes are contained with the abnormal mitochondria. LY, lysosomes; LD, lipid droplet; M, mitochondria; ZP, zona pellucida. Bar = 1μm.

Vesicle
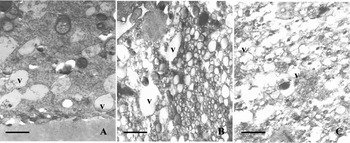
In in vivo-derived embryos, numerous electron-lucent vesicles were found at the 2-, 4-, 8- (Fig. 11a) and 16-cell stages, and they distributed uniformally in the cytoplasm. Some vesicles contained some flocculent material. The nucleus was surrounded by small vesicles while the more peripheral vesicles were larger. In GG embryos, a medium number of vesicles were found at the 2-cell stage, distributed equally throughout the cytoplasm. At the 4-cell stage, much more vesicles were observed, and the distribution had become uneven. Some blastomeres contained few vesicles, while others presented numerous aggregated vesicles (Fig. 11b). Many vesicles were still found at the 8- and 16-cell stages. In GC embryos, the number of the vesicles did not change much from the 2-cell to 8-cell stage. At the 16-cell stage, more vesicles were found (Fig. 11c).
Electron-micrographs showing representative images of the vesicles. (a) Goat in vivo-fertilized 8-cell embryo. The vesicles have membrane. (b) Goat–goat reconstructed 4-cell embryo. Some vesicles have no membrane. (c) Goat–cattle reconstructed 16-cell embryo. V, vesicle. Bar = 1μm.

Nucleus
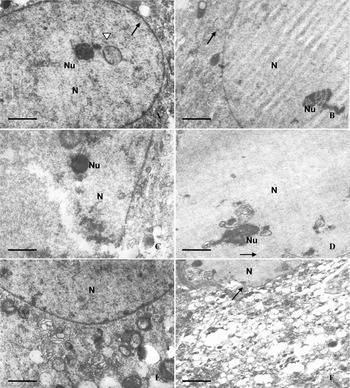
In in vivo-derived embryos, the nucleus was round at the 2-, 4- and 8-cell stages, and typically it contained one or more electron-dense nucleolus precursor bodies (Fig. 12a). At the 16-cell stage, the nucleus precursor bodies developed vacuoles and apparently active ribosome-synthesizing fibrillo-granular nucleoli were observed (Fig. 12b). In some GC embryos, the nuclear envelope was incomplete exposing the karyoplasm to the cytoplasm (Fig. 12c). At the 16-cell stage, the blastomeres had irregularly shaped nuclei, and the nuclear envelope was clearly defined, but undulating (Fig. 12d,f). In GG embryos, the nuclei were comparable to those of the GC embryos. Occasionally, blastomeres binucleated (Fig. 12e).
Electron-micrographs showing representative nucleus images. (a) Goat in vivo-fertilized 8-cell embryo with integrated nuclear envelope and dense nucleolus (Nu). (b) Goat in vivo-fertilized 8-cell embryo with integrated nuclear envelope and meshwork nucleolus. (c) Goat–cattle reconstructed 8-cell embryo with dense nucleolus. The broken nuclear envelope is shown. (d) Goat–cattle reconstructed 16-cell embryo with meshwork nucleus, nuclear envelope infolding. (e) Goat–goat reconstructed 4-cell embryo containing two nuclei with integrated nuclear envelope. (f) Goat-cattle reconstructed 16-cell embryo. N, nucleus (N), arrow shows nuclear envelope. The concentrated chromatin is shown (arrow). Bar = 500 nm.

Membrane and gap junctions
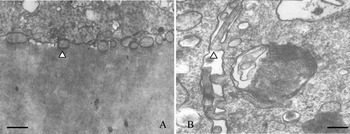
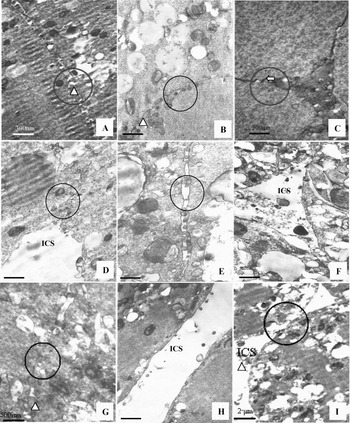
The plasma membrane of the blastomeres in all three types of embryos was intact. However, the membrane of the reconstructed embryos displayed more undulations. The blastomeres were covered by microvilli (Fig. 13a, b). In in vivo-derived embryos, the microvilli extended from the membrane at the 2-cell stage (Fig. 14a). At the 8-cell stage, there was no apparent intracellular space (Fig. 14b). At the 16-cell stage, the blastomeres contacted each other closely without intercellular spaces (Fig. 14c). In GC embryos, the space between blastomeres was considerable from before the 8-cell stage. At the 8-cell stage, the microvilli was quite long (Fig. 14d,e). At the 16-cell stage, the increasing blastomeres approached to each other, but quite a bit space between the blastomeres was still observed (Fig. 14f). In GG embryos, the junction became looser with a small space from the 2- to 8-cell stages (Fig. 14g,h). At the 16-cell stage, the blastomeres kept nearer (Fig. 14i).
Electron micrographs showing representative microvilli morphology. (a) Goat in vivo-fertilized 8-cell embryo with short microvilli (Mi). Scale bar, 400 nm. (b) Goat–cattle reconstructed 8–cell embryo with long microvilli. Scale bar, 200 nm. The Mi is shown with triangle arrow.

Electron micrographs showing junctions within the blastomeres. (a) Goat in vivo-fertilized 2-cell embryo with a microvilli (Mi) enchased junction. (b) Goat in vivo-fertilized 8-cell embryo with gap junction. Bar = 1μm. (c) Goat in vivo-fertilized 16-cell embryo with a gap junction. (d) Goat–cattle reconstructed 2-cell embryo with a few Mi enchased junctions. Bar = 1μm. (e) Goat–cattle reconstructed 8-cell embryo with a large intercellular space. Bar = 300 nm. (f) Goat–cattle reconstructed 16-cell embryo, has loose junction and large intercellular space. Bar = 300 nm. (g) Goat–goat reconstructed 2-cell embryo with gap junctions and a Mi enchased junction. (h) Goat–goat reconstructed 8-cell embryo contains few Mi and large ICS with no junctions. Bar = 1μm. (i) Goat–goat reconstructed 16-cell embryo has a few gap junctions and a large intercellular space. ICS, intercellular space. Arrow heads shows the microvilli, thick and empty arrows show the desmosomes, and the circle shows the junctions.

Discussion
At present, much more can be deduced from embryo morphology than previously thought and embryo morphology assessment has been one of the most popular methods for embryo selection (Abe et al., Reference Abe, Matsuzaki and Hoshi2002a; van Soom et al., Reference Van Soom, Mateusen, Leroy and de Kruif2003). In addition, the ultrastructural features may reflect various physiological anomalies and even apoptosis (Kerr et al., Reference Kerr, Winterford and Harmon1994; Desai et al., Reference Desai, Goldstein, Rowland and Goldfarb2000). Embryos produced by nuclear transfer have a greater variance in morphology and developmental rate. This study found that the intraspecies- and interspecies-reconstructed embryos showed some ultrastructural deviations in organelles, including mitochondria, lysosomes, vesicles, lipid drops and intracellular junctions. These changes may contribute to the reduction in potential viability that is found with reconstructed embryos.
Zona pellucida
The ZP thickness decreases during embryo development and, therefore, this feature may be applied as a useful marker to evaluate, and even predicate, the embryo quality in many species (Cohen et al., Reference Cohen, Malter, Fehilly, Wright, Elsner, Kort and Massey1988; Gabrielsen et al., Reference Gabrielsen, Bhatnager and Petersen2000), including humans (Dirnfeld et al., Reference Dirnfeld, Shiloh, Bider, Harari, Koifman, Lahav-Baratz and Abramovici2003; Pelletier et al., Reference Pelletier, Keefe and Trimarchi2004). It was thought that the fact that the in vivo embryo ZP became thinner was related to the oviduct and uterus endoenvironment (Funahashi et al., Reference Funahashi, Ekwall and Rodriguez2000). Furthermore, that the decrease in ZP thickness was necessary for hatching and implantation at a subsequent time for both in vivo and in vitro embryos. It was reported that the ZP of in vitro fertilized bovine embryos was thinner than that of in vivo embryos at the same stages (Abe et al., Reference Abe, Otoi, Tachikawa, Yamashita, Satoh and Hoshi1999). In addition, the diameter of bovine IVP blastocysts was also increased. We found the similar results in relation to ZP thickness and all three types of embryos became thinner with development, but no statistically significant difference in thickness was found among embryos at the same stage. However, the change in ZP thickness in the GG embryo was more comparable to that of in vivo embryos. Our results also showed that, compared with in vivo embryos, the ZP of intraspecies cloned embryos was less compact, with more pores and a less smooth surface. This change was more obvious for the ZP of interspecies cloned embryos, and this finding was identical to previous reports for IVP embryos. (Vanroose et al., Reference Vanroose, Nauwynck, Soom, Ysebaert, Charlier, Oostveldt and de Kruif2000; Sabine et al., Reference Sabine, Miodrag, Sven, Horst-Dieter, Eckhard and Fred2004; Nottola et al., Reference Nottola, Makabe, Stallone, Familiari, Correr and Macchiarelli2005). We speculated that these findings might be indicative of an altered ZP composition.
Mitochondria
The change for mitochondria is the important clue to the embryo's developmental potential. Immature mitochondria are found typically at the early cleavage and morula stages (Sun et al., Reference Sun, Tan, Qin and Yang1994; Yang et al., Reference Yang, Liu, Qi and Shorgan2003), while vacuolated mitochondria are associated with degeneration and subsequent cell death (Enders et al., Reference Enders, Hendricks and Binkerd1982). With embryo development, the cristae in mitochondria increased (Betteridge, Reference Betteridge1988). At the early developmental stage, hooded mitochondria control energy production (Devreker and Englert, Reference Devreker and Englert2000), however the IVP embryos have differences (Crosier et al., Reference Crosier, Dykstra, Alexander and Farin2000, Reference Crosier, Farin, Dykstra, Alexander and Farin2001). It seems that the development microenvironment of embryos might contribute to their reduced developmental ability. Our study showed that the interspecies and intraspecies cloned embryos and in vivo-produced goat embryos had a similar tendency for developmental mitochondria change. However, the change in the GG embryos was more comparable to that in in vivo embryos than in the GC embryos, in which the mitochondria had more severe alterations. In this sense, interspecies nuclear transfer is more difficult than previously thought and, therefore, to achieve offspring is more complicated. This difficulty might be due to the homogeneity between the cytoplasm and nucleus. The homogenous cytoplasm could facilitate cooperation and reprogramming to the nucleus, while the hexogenous cytoplasm showed a weaker capacity. Interestingly, mtDNA heteroplasmy in cloned cattle has been reported (Steinborn et al., Reference Steinborn, Schinogl, Zakhartchenko, Achmann, Schernthaner, Stojkovic, Wolf, Muller and Brem2000), while for Dolly there was a lack of heteroplasmy (Evans et al., Reference Evans, Gurer, Loike, Wilmut, Schnieke and Schon1999). Despite being authentic nuclear clones they were, in fact, genetic chimaeras that contained somatic cell-derived nuclear DNA but oocyte-derived mtDNA (Evans et al., Reference Evans, Gurer, Loike, Wilmut, Schnieke and Schon1999). Accordingly, mitochondrial morphological change can be used as an index to evaluate embryo quality and this change might be an indication for improvements in nuclear transfer and in the in vitro culture system.
Golgi apparatus and endoplasmic reticulum
This study showed that the three types of embryos had a similar tendency for changes in Gi and in ER. It seems that nuclear transfer causes no apparent injury to the Gi and ER, which indicates that the cloned embryos may have a normal material shipping and secretion model, at least to some extent.
Lipid droplet
Lipid is generally considered the resource for embryo energy and the base for material for membrane structure synthesis. A previous report in cattle found that the blastomeres of IVP embryos had more LD than was found in in vivo embryos (Abe et al., Reference Abe, Otoi, Tachikawa, Yamashita, Satoh and Hoshi1999). Our study found that the both intra- and interspecies reconstructed embryos had many LD. The volume of these LD increased as development progressed and there was a tendency to aggregate. LD existence is related to the in vitro culture system (Monika et al., Reference Monika, Schernthaner, Sinowatz and Wolf2002; Pereira et al., Reference Pereira, Dode and Rumpf2005). The in vitro culture system used in the present study consisted of 10% fetal bovine serum (FBS), which contributed partly to the LD existence. The study in bovine embryos found that the increase in LD might not be due to active absorption of nutrients from the medium and but instead because the embryos failed to adjust to in vitro culture conditions. Therefore, membrane structural change and the lipid accumulation occurred after lipid had been accessed (Crosier et al., Reference Crosier, Farin, Dykstra, Alexander and Farin2001). Another report proposed that the accumulation of cytoplasmic droplets was due to a reduced cryotolerance (Abe et al., Reference Abe, Yamashita, Satoh and Hoshi2002b).
Lipid metabolism is closely related to mitochondria and therefore the relationship of LD rate to mitochondria volume was investigated in the present study. We found that this rate changed little for in vivo-produced goat embryos, but that the rate for reconstructed embryos, especially for the interspecies cloned embryos, increased. This lipid accumulation delayed embryo development and decreased blastomere numbers (Thompson et al., Reference Thompson2000). Lipid accumulation was an indication of metabolic reduction in the mitochondria. In other words, the reconstructed embryos had weaker metabolic capacities than was found in in vivo-produced embryos. The increase in abnormal mitochondria, as noted above, might also contribute to the accumulation of LD. Furthermore, the accumulated LD might destroy the function of mitochondrial enzymes, so that lipids could not metabolized properly (Campos et al., Reference Campos, Huertas and Bautista1993; Dalakas et al., Reference Dalakas, Leon-Monzon and Bernardini1994). We used bovine oocytes that contain many lipids to produce interspecies embryos and we speculated, even though there was a similarity to goat oocytes, that the use of a different cytoplasm donor might be related to the aberration due to heteroplasmy.
Lysosome
A previous study found that the blastomeres of bovine IVP morulae contained few lysosome-like structures (Abe et al., Reference Abe, Otoi, Tachikawa, Yamashita, Satoh and Hoshi1999). We found that in vivo-produced embryos had few lysosomes and this number changed little with development. In contrast, lysosomes of cloned embryos increased from the 4-cell stage and more residues and secondary lysosome-containing organelles were found in the extracelluar space and PVS. Such a change might be related to in vitro culture. The nutrient ingredients in the medium are delivered to the blastomeres firstly through vesicles by pinocytosis and endocytosis and subsequently these vacuoles merge with lysosomes and their contents are digested by hydrolases located in lysosomes. We speculate that addition of serum and the increase in abnormal mitochondria might, in part, cause a lysosome increase to counteract this impact, as some mitochondria were found in lysosomes. This is a kind of compensation and self-recovery. Some articles ingested failed to be digested and formed residues to extrude to PVS and externally out of embryo via the ZP. Consequently, there was an increase in ZP pores, as noted above.
Vesicle
Vesicle formation might be linked to cell ingestion and, therefore, the number of vesicles reflects the absorptive ability of the cell to its environment. Vesicles, in themselves, are not detrimental to the embryo developmental potential and, on the contrary, they play an important role in molecular transportation. Human in vivo embryos were found to have an abundant number of vesicles (Pereda & Croxatto Reference Pereda and Croxatto1978; Pereda et al., Reference Pereda, Cheviakoff and Roxatto1989). We found that in vivo-produced embryos had middle-sized vesicles distributed evenly in the blastomeres and that most vesicles were covered by a single membrane. In intraspecies embryos, the vesicles were distributed unevenly in blastomere cytoplasm and some blastomeres were vacuolated, without any cytoplasm and organelles. Interspecies embryos had also vesicle aggregation at a later stage, with reduced cytoplasm and organelles. Cytoplasm vacuolation is one of the indicators of death of a cell. It seems that these vesicles differ from those found in in vivo-produced embryos and were abnormal. The increased number of these abnormal vesicles reduced the number and function of other organelles, and, consequently, the cell's metabolism might be influenced negatively. This finding might be an alternative explanation for the compromised developmental capacity and pregnancy rate of cloned embryos.
Nucleus
The nucleus is the centre for controlling heredity and metabolism and is of the great importance to organelles. The nuclei of human in vivo embryos have been found to have extensive blebbing of the nuclear envelope (Pereda and Croxatto Reference Pereda and Croxatto1978). In addition, it has been reported that, in cloned embryos, the changes in nucleolar morphology were delayed in bovine somatic nucleotransferred embryos when compared with the embryonic cloned embryos (Baran et al., Reference Baran, Vignon, LeBourhis, Renard and Flechon2002). Our study showed that the three types of embryos contained a compact nucleolus before the 8-cell stage, similar to that found in human and ovine embryos. The nucleus from the somatic donor was reticulated after nuclear transfer, indicating re-programming, which is related to RNA synthesis. It has been reported that RNA synthesis is launched at the 4-cell stage with the reticulated nucleolus after blastomeres from bovine morulae were transferred to enucleated recipient oocytes (Smith et al., Reference Smith, Soloy and Kanka1996). The proper activation of the nucleolus can avoid developmental arrest. We found that interspecies embryos at the 16-cell stage became reticulated in the nucleolus, indicating the activation of the zygote genome; the abnormal morphology, however, might impair this function.
Cellular membrane and junction
It has been reported there are distinct desmosome-like structures and junctional complex between blastomeres of in vivo-produced human embryos (Pereda & Croxatto, Reference Pereda and Croxatto1978; Pereda & Coppo, Reference Pereda and Coppo1987). In marsupials, the cell–zona adhesion of dunnart in vivo embryos was established at the zygote stage, while cell–cell adhesion was first apparent at the 16-cell stage (Kress & Selwood, Reference Kress and Selwood2004). In bovine IVP blastocysts, blastomeres had less well developed junctional complexes and less apical microvilli (Abe et al., Reference Abe, Otoi, Tachikawa, Yamashita, Satoh and Hoshi1999). In the present study, we found that the in vivo-produced goat embryos had an integral membrane, but, in the interspecies embryos, the space between the blastomeres was considerable, the touch area between blastomeres was small and some blastomeres had smooth surfaces without microvilli extrusion. This abnormality might impair the transfer of information between blastomeres.
Discussion
The interspecies and intraspecies reconstructed embryos have similar development changes in the ZP, rough ER, Gi and nucleolus when compared with in vivo-produced embryos. Mature mitochondria in reconstructed embryos, especially interspecies cloned embryos, increased more quickly than that of in vivo produced embryos and the number of abnormal mitochondria was higher than in vivo-produced embryos. Interspecies embryos have more severe lipid accumulation, broken nuclear envelopes and more nuclei, which is related to apoptosis or abnormal cleavage. Compared with in vivo-produced embryos, the reconstructed embryos have larger spaces between blastomeres.
Acknowledgements
We acknowledge the fund support from Anhui Distinguished Youth Sci-tech Project (grant number 06041081) Eleventh Five-Year Sci-tech Project (grant number 06013051A), National Education Department Project (5030001) and International Cooperation Project (Guoke WaiHan 2002-101 and 2004-117). The authors are also grateful to Dr Sun Qingyuan for his great help in manuscript preparation.