Alternative means of communication are often provided to individuals who are unable to communicate via speech or sign language. Augmentative and alternative communication (AAC) systems range from simple graphic symbol displays to technologically advanced, computer-based devices incorporating synthesized or digitized speech. For young children with severe motor speech impairments who require AAC systems while they are acquiring their native language, words and concepts are represented by graphic symbols. This situation presents unique challenges for language acquisition and may influence the nature of the linguistic skills children ultimately acquire (Smith & Grove, Reference Smith, Grove, Light, Beukelman and Reichle2003).
The most striking difference between the language-learning situation of children who require graphic symbols and that of typically developing children is the relationship between their expressive and receptive modalities. Typically, children produce utterances in the same modality as the one they encounter for language comprehension and observe being used by others; the same is true for deaf children acquiring a signed language from birth. Children needing graphic symbols, in contrast, experience a modality mismatch: they are exposed to speech for comprehension, in the auditory modality, but use graphic symbols for expression, in the visual modality. Their expressive modality is thus different from both the input they receive and from the expressive modality of language users in their environment. Children's ability to make the connection between the spoken language they hear and the graphic symbols in their AAC systems is therefore crucial to their success in acquiring language and communication skills.
The graphic symbols most widely used with young children are colored line drawings intended to represent individual words. A variety of commercially available symbol sets are found in clinical and educational settings. The notion of iconicity, that is the degree to which the symbol resembles its intended meaning, underlies the creation of most symbol sets, especially those designed for young children (Beukelman & Mirenda, Reference Beukelman and Mirenda2005). Whenever possible, symbols are chosen or created to be transparent: the meaning of the symbol can be guessed from its visual form. A symbol is considered translucent if its meaning is not immediately guessable but the link between the symbol and its referent becomes apparent once the meaning is given. opaque symbols are those for which the link between the symbol and its referent is not evident even when stated. Thus it is believed that transparent symbols are likely to be learned and used more easily by young children because their meaning does not have to be discovered independently of the concepts they are intended to represent. Transparency is not determined solely on the basis of the visual symbol alone, though. Some concepts are more ‘picturable’ than others, depending on their level of abstractness. For example concrete objects such as ‘ball’ are relatively easy to depict in a graphic symbol whereas other common concepts such as ‘cold’ present a greater level of difficulty. Abstract concepts such as ‘truth’ or grammatical markers such as ‘past tense’ are essentially impossible to render into graphic representations that are not opaque.
Graphic symbols in an AAC system for use by a particular child are typically arranged on a fixed display or on a series of displays that can be changed (either by the child, by an intervenor or by a function of an electronic device). The child selects symbols one at a time. There is no inherent set of rules for combining symbols. Intervention programs typically encourage children to follow the major word order of the spoken environmental language when constructing a sequence of graphic symbols, but a variety of factors may influence the length of utterances and the actual word order used (e.g. slow rate of selection, lack of grammatical morphemes on the display, listener interpretation strategies) (Blockberger & Sutton, Reference Blockberger, Sutton, Light, Beukelman and Reichle2003; Soto, Reference Soto, Loncke, Clibbens, Arvidson and Lloyd1999). Most current AAC devices incorporate synthesized or digitized speech that can be activated as each symbol is selected, at the end of a sequence of symbols, or both.
Graphic symbolic abilities in typically developing children
The study of graphic symbols as a means of linguistic communication is relatively recent when compared with the study of spoken or signed language acquisition. The ability of typically developing young children to comprehend and produce graphic representations has been explored primarily from two points of view within the larger literature on child development: from the perspectives of artistic development (e.g. Golomb, Reference Golomb2004) and of symbolic development (e.g. Namy, Reference Namy2005). Graphic and symbolic abilities go through several developmental stages during infancy and the preschool years. Newborns treat differently three- versus two-dimensional representations of objects (i.e. the object itself versus a picture of it; Rochat & Callaghan, Reference Rochat, Callaghan and Namy2005), but by age 1 ; 0 they recognize that the two types of representations resemble each other. In graphic production, until the age of three years children may attribute meaning to the shapes they have produced, but they do not demonstrate the intent to produce a graphic representation; meaning may be attributed once they perceive the similarities between their scribbles and shapes in the environment (Rochat & Callaghan, Reference Rochat, Callaghan and Namy2005). It is only after the age of three that children demonstrate awareness of the referential value of pictorial representations and their symbolic nature (i.e. dual representation – that the picture is the referent and is not the referent at the same time). ‘[T]he referent [object] and the representation [symbol] share meanings but do not allow for the same behaviors’ (Mineo Mollica, Reference Mineo Mollica, Light, Beukelman and Reichle2003: 209, [ ] added).
During their fourth year, children begin to understand that pictures can replace objects (e.g. DeLoache & Burns, Reference DeLoache and Burns1994). At this stage children show the intent to produce a symbolic graphic representation in their drawings (by stating ahead of time what they will draw; by producing drawings that have some perceptual similarities with the object depicted). They begin to draw representations of objects rather than simply a collection of shapes. Four-year-old children demonstrate understanding that graphic representations can be flexible: they are able to interpret and to produce a variety of different graphic representations for the same object. The final stage of development in childhood, around five years of age, involves the concept of intent to represent. Children understand that the artist, when drawing, intended to create a graphic representation and that an audience, when viewing a graphic representation, will intentionally make an interpretation of it (Callaghan, Reference Callaghan2005).
Concerning symbolic abilities, research has primarily dealt with the very early stages of development (e.g. Bates, Benigni, Bretherton, Camaioni & Volterra, Reference Bates, Benigni, Bretherton, Camaioni and Volterra1979; Namy, Reference Namy2005); once they begin to use language, children are generally considered to be capable of symbolic representation. Studies have examined symbolic behavior relative to several types of symbols: gestures (e.g. Acredolo & Goodwyn, Reference Acredolo and Goodwyn1988) and play behaviors (McCune, Reference McCune1995), pictures and other graphic representations (e.g. DeLoache, Pierroutsakos & Uttal, Reference DeLoache, Pierroutsakos and Uttal2003), and early words (e.g. Bates et al., Reference Bates, Benigni, Bretherton, Camaioni and Volterra1979). Children demonstrate symbolic behavior in gesture and speech much earlier than they use graphic representations as symbols. They begin to use words to represent objects (as well as actions and other concepts) during their second year. Even children with no spoken or signed language models begin to display symbolic communicative behavior as early as age 1 ; 4 (Goldin-Meadow & Feldman, Reference Goldin-Meadow and Feldman1977).
Graphic symbols used for communication
The literature on children's developing sense of graphic representation and its symbolic nature has been applied to some degree to the use of graphic symbols for communication within AAC systems. Studies have focused mainly on the comprehension and use of discrete graphic representations corresponding to single words, i.e. individual graphic symbols, rather than on how whole utterances are transposed into sequences of graphic symbols. For example, the transition to symbolic communication in individuals functioning at low cognitive levels, who may remain at the very early stages of graphic, symbolic and language development for an extended period, has been the subject of an extensive body of work by Romski, Sevcik and colleagues (e.g. Barton, Sevcik & Romski, Reference Barton, Sevcik and Romski2006; Sevcik & Romski, Reference Sevcik, Romski, Reichle, Beukelman and Light2002). However, constructing an utterance by selecting and sequencing graphic symbols goes beyond a 1:1 correspondence between the graphic representation and the referent: the relationships among the symbols must also be conveyed. In order to go beyond the level of single symbols to transmit an utterance that under normal circumstances would be conveyed by a spoken sentence, the intended utterance must be transposed from the spoken language-based internal representation into the graphic modality. One or more graphic symbols are selected from an array with the intent of conveying a message.
Using sequences of graphic symbols to transpose spoken language utterances is a unique application of graphic representations. Comparisons can be made with other forms of graphic representation (e.g. drawing) up to a certain point. It is likely, for example, that notions applying to interpretation of drawings can be applied to individual graphic symbols because they are both static visual representations to be considered as a whole. However, the artistic literature dealing with sequential graphic representations may be of limited application to sequences of graphic symbols to construct utterances because it is primarily concerned with depictions of temporal or causal events (e.g. a vase, a hammer and a broken vase) rather than with a sequence of symbols intended to form an utterance (Gelman, Bullock & Meck, Reference Gelman, Bullock and Meck1980). In the literature on the development of graphic representation during infancy and the preschool years, ‘production’ refers to the creation of graphic representations in drawing, and ‘comprehension’ refers to identifying the referent or interpreting another person's drawing (e.g. Rochat & Callaghan, Reference Rochat, Callaghan and Namy2005). Regarding graphic symbols for communication, however, ‘production’ means selecting symbols from an array and sequencing them to transpose the intended message, and ‘comprehension’ refers to interpreting the message conveyed by a sequence of symbols selected by another person. Thus, in contrast to spoken communication, the distinction between comprehension and production may be blurred for graphic representations: the same behavior (e.g. pointing to a picture) can be used to demonstrate both (Mineo Mollica, Reference Mineo Mollica, Light, Beukelman and Reichle2003). The comparison of the artistic literature and the AAC literature is helpful, though, in identifying some of the additional facets or steps involved in utterance production and comprehension when using graphic symbols. In production (transposition), it is necessary to select appropriate graphic representations from a limited set that correspond to elements of the intended message and then sequence them in a way to convey the intended message. In comprehension (interpretation), it is necessary to recognize the meaning of each graphic symbol and to construct an interpretation integrating the individual elements without recourse to the grammatical conventions of the spoken language of the environment.
At present we know little about how young children, who are still in the process of artistic, symbolic and language development, deal with the task of transposing utterances into graphic symbol sequences, although children who require AAC systems for communication are faced with this task. In the AAC literature, there is consensus that constructing utterances using graphic symbols is not the same as producing spoken utterances (e.g. Soto, Reference Soto, Loncke, Clibbens, Arvidson and Lloyd1999), but the nature of the connection between spoken language sentences and graphic symbol sequences is still under exploration. The study of utterances composed of sequences of graphic symbols taps into the transposition process beyond comprehension and use of individual symbols. There is some indication that the transition from single-symbol utterances to sequences of symbols is more difficult for children using AAC than is the transition from one-word utterances to two-word utterances for children using speech (e.g. Paul, Reference Paul and Paul1998). However, Wilkinson, Sevcik & Romski (Reference Wilkinson, Sevcik and Romski1993) found that the semantic–syntactic content of early symbol combinations produced by participants with moderate and severe intellectual disabilities was not qualitatively different from that of early word combinations in spoken language development, although the process took more time and perhaps more effort when using graphic symbols (Wilkinson et al., Reference Wilkinson, Sevcik and Romski1993). Bruno & Trembath (Reference Bruno and Trembath2006) found that children at a somewhat more advanced level of syntactic performance improved in production of specific types of sentences following a training program. The syntactic aspects of graphic symbol use (sequencing of selected symbols) have been less frequently studied than have individual symbols.
One common research strategy used within the field of AAC to explore aspects of communication using AAC, or specific features of the systems, is to ask participants without disabilities to perform tasks using AAC systems with specific characteristics. This strategy is particularly useful for addressing theoretical issues, such as the nature of the transposition process, because it allows examination of AAC performance under optimal conditions, i.e. when participants possess all typically developing cognitive, linguistic and motor skills. Previous studies using this strategy and designed to directly explore relationships between spoken sentences and graphic symbol sequences suggest that syntactic knowledge alone does not guarantee that graphic symbol sequences will adhere to the syntax of spoken sentences (Smith, Reference Smith, von Tetzchner and Jensen1996; Sutton, Gallagher, Morford & Shahnaz, Reference Sutton, Gallagher, Morford and Shahnaz2000). Trudeau and colleagues found that adults as well as children over the age of seven and without disabilities virtually always followed the syntax of their spoken language when producing and interpreting simple sentences, whereas preschoolers did not (Trudeau, Sutton, Dagenais, de Broeck & Morford, Reference Trudeau, Sutton, Dagenais, de Broeck and Morford2007; Trudeau et al., Reference Trudeau, Sutton, Morford, de Broeck, Dagenais, Pauzé and Vallée2006). Together, these studies demonstrate that individuals rely on language-specific grammatical knowledge in the production and comprehension of graphic symbol utterances, but that spoken language knowledge alone is insufficient to explain the development of the ability to produce and comprehend graphic symbol utterances. Further, these studies do not capture the onset of production and comprehension of graphic symbol sequences. How do young children construct sequences of graphic symbols and interpret graphic symbol utterances in the context of AAC system usage?
Rationale for the current study
The current study is part of a larger research effort exploring the development of AAC skills. The goal of this study was to examine the transposition and interpretation of graphic symbol sequences in preschool-aged children without disabilities in greater detail than was warranted in the earlier studies (Trudeau et al., Reference Trudeau, Sutton, Morford, de Broeck, Dagenais, Pauzé and Vallée2006, Reference Trudeau, Sutton, Dagenais, de Broeck and Morford2007). The study expands the current literature concerning use of graphic symbols by young children by going beyond their treatment of individual symbols, in a systematic way. We hypothesized that this group might have more difficulty producing and comprehending sequences of graphic symbols relative to older children and adults for three reasons. First, preschool-aged children (3 ; 0 to 4 ; 11) are still in the process of acquiring the syntax of their native language. Second, the literature on the development of graphic representations suggests that children at this age may not yet understand the intentional nature of reference in graphic symbols or in the configuration of multiple graphic symbols. Third, preliminary analyses of the data, at a group level, suggested important differences between this group and older children (Trudeau et al., Reference Trudeau, Sutton, Morford, de Broeck, Dagenais, Pauzé and Vallée2006, Reference Trudeau, Sutton, Dagenais, de Broeck and Morford2007). These considerations suggest that children may not adhere to the spoken model in transposition, and may not use word order in a consistent fashion in interpretation.
A better understanding of young children's transpositions of simple sentences into sequences of graphic symbols and their interpretation of graphic symbol sequences representing single propositions will help clarify the challenges faced by children acquiring language while using graphic symbol AAC systems. Further, this understanding may help identify early skills to target in intervention to improve children's ability to make the most of graphic symbols for communication when speech is not an option.
The following research questions were addressed:
(1) When three- and four-year-old children are asked to transpose spoken simple sentences into sequences of graphic symbols,
(a) How closely do the selected symbols match the words of the spoken sentence?
(b) Do they respond consistently (i.e. using the same sequence of symbols on most trials)?
(2) How do three- and four-year-old children interpret sequences of symbols representing S–V–O sentences?
(a) Do their responses reflect correct interpretation of the action and of the agent–patient relationship?
(b) Do they respond consistently (i.e. choosing the same response on most trials)?
(3) What is the relationship between participant characteristics (age, receptive language) and performance in transposition and interpretation?
In order to address these questions, the performance of three- and four-year-old children on two experimental tasks was examined. The tasks were a Transposition Task and an Interpretation Task. The stimuli were based on simple S–V–O reversible sentences, in which both of the nouns mentioned (S and O) were potential agents or patients of the action. The ordering of the words and symbols was therefore more relevant than it would be if the stimuli were non-reversible: the relationship between the nouns and the verb cannot be resolved by their semantics.
METHODOLOGY
Participants
The participants were thirty children (mean age=3 ; 11.15, SD=0 ; 6.12) who were native speakers of French with no disabilities or language delays. Integrity of receptive language skills was documented through the Échelle de vocabulaire en images Peabody (ÉVIP) (Dunn, Thériault-Whalen & Dunn, Reference Dunn, Thériault-Whalen and Dunn1993) and the Épreuve de compréhension de Carrow-Woolfolk (ÉCCW) (Groupe coopératif en orthophonie – Région Laval, Laurentides, Lanaudière (1995) ). All participants' scores were within normal limits on these language tests (ÉVIP mean percentile rank=71·90, SD=21·17; ÉCCW mean total score=72·83, SD=14·72). These participants are the same children as the youngest participant group in Trudeau et al. (Reference Trudeau, Sutton, Morford, de Broeck, Dagenais, Pauzé and Vallée2006).
General procedures
Approval from the ethics board of the relevant institutions was obtained. Participants were recruited through announcements posted in local childcare and community centers. Parents provided written informed consent, and children gave verbal assent prior to their participation. Each participant was seen by two experimenters in a quiet location for a maximum of two sessions (60 minutes each), scheduled within a few days of each other. One experimenter interacted with the participant and manipulated the materials while the second experimenter recorded responses and ensured that the session proceeded smoothly. The language tests were administered first, followed by the Transposition Task and then the Interpretation Task.
Transposition Task
The Transposition Task used in this study was one of the tasks used by Trudeau et al. (Reference Trudeau, Sutton, Dagenais, de Broeck and Morford2007). A subset appropriate for young children of the stimuli (single propositions) from one of the experimental conditions (neutral context only) was used.
Stimuli
The stimuli were single proposition spoken sentences, i.e. noun–verb–noun structures such as ‘The clown pushes the girl’ (N1–V–N2). There were eight exemplars constructed by combining four pairs of nouns (agent–patient: girl–clown, clown–girl, boy–clown, clown–boy) with two reversible actions (push, pull). Each participant received a random ordering of the eight stimulus sentences.
Materials
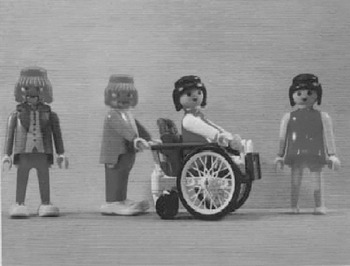
The materials were similar to those used in several earlier studies of utterance construction using graphic symbols (Sutton, Morford & Gallagher, Reference Sutton, Morford and Gallagher2004; Sutton, Gallagher, Morford & Shahnaz, Reference Sutton, Gallagher, Morford and Shahnaz2002). Photographs depicted the situations described in the spoken sentence stimuli. A 4″×6″ colour photograph of Playmobil figurines represented each stimulus sentence (see Figure 1). Each photograph included two additional figurines identical to the agent and patient but who were not involved in the action. Although not strictly necessary for the simple sentence stimuli used in this study, the additional figurines were required in order to satisfy the conditions necessary for more complex sentence stimuli (relative clause sentences, in which two possible referents are present, one of which is specified by the relative clause) used in the larger project (Trudeau et al., Reference Trudeau, Sutton, Morford, de Broeck, Dagenais, Pauzé and Vallée2006, Reference Trudeau, Sutton, Dagenais, de Broeck and Morford2007). The presence of the extra figurines in the photographs for the single proposition sentences permitted comparison across single and complex proposition sentences in the set of studies while controlling for complexity of the photographs. The arrangement of each photograph was essentially the same, from left to right: the double figurine of the agent, the agent, the means of transportation (wheelchair or wagon) used for the action, the patient (in the wheelchair or wagon) and the double of the patient. Thus the agent was always on the left of the photograph but the direction of the action changed for PUSH Footnote 1 and for PULL (i.e. pushing towards the right but pulling towards the left). These photographs have been used in previous studies of sentence comprehension and are easily understandable by young children (Sutton, Reference Sutton1997). Three- to four-year-old children understood that spoken sentences matched the core action of the photograph; they were not distracted by the presence of the double of the agent and the patient.
Example of photograph used in the Transposition Task.

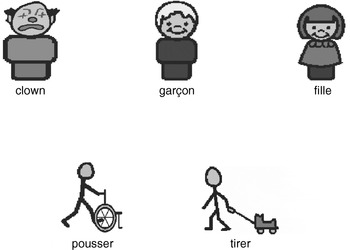
The graphic symbols used in the study were comparable to those that would actually be included in an AAC system for a young child. They were colored, stylized line drawings taken from the Picture Communication System (PCS) symbol set (Johnson, Reference Johnson1994), one of the most commonly used in AAC systems for young children, and modified using standard techniques to highlight the correspondence between the symbol and referent. The graphic symbols were therefore all highly transparent (see Figure 2). For example, the graphic symbol PUSH was created by combining a wheelchair and a stick figure so that it replicated the action of pushing the wheelchair depicted in the photograph. One graphic symbol represented each of the words needed to describe the photographs (POUSSER, TIRER, FILLE, GARÇON, CLOWN – PUSH, PULL, GIRL, BOY, CLOWN). Each was printed on a 2″×2″ card and laminated, with a small piece of Velcro attached on the back. Multiple copies of each symbol were provided in small containers so that the children would not be influenced by the availability of the symbols as they were constructing their responses.
Symbols used in the experimental tasks.

A 2′×2′ work surface covered with carpet and mounted on an easel and a helper puppet were also used during the Transposition Task.
Training and familiarization
Training was provided to ensure that participants were comfortable with the materials, the symbols, the tasks and the instructions. Training materials were the same as the materials used in the experimental tasks, but the specific combinations of figurines were different (i.e. they involved a boy and a girl pushing and pulling each other, rather than a boy and a clown or a girl and a clown pushing and pulling each other). Thus the same nouns and verbs were used in training and in the experimental task but in different configurations. The task was explained in this way: ‘We are going to tell some stories to our friend Rainbow (the fish puppet). He doesn't have any ears so he can't hear the words. You'll have to tell him your stories with these little pictures (symbols) that are here in front of you. You can stick them on the board so Rainbow can see them. To start, I'll show you a photo. You'll look at it, and listen carefully! I'll tell you the story with my words and then you make the same story with the pictures for Rainbow. You can choose what pictures to take and where to put them on the board.’
The examiner then showed the participant each of the symbols that he or she would be using to ‘make the story’, and named them one at a time. She asked the participant to point to each symbol when named and then to name each symbol. If any difficulties with identification of the symbols were observed, these steps would be repeated, but all participants responded correctly at this single-word phase, confirming the transparency of the graphic symbols chosen.
Four familiarization trials followed. Participants practiced constructing sequences of symbols corresponding to a photograph following the examiner's model. The examiner presented a photograph and spoke the corresponding sentence stimulus, which the participant was asked to repeat orally. Although strict control of pitch and stress in the presentation of the sentence stimuli was not warranted (for example by presenting the stimuli from a controlled recording), the experimenter was instructed to use a relatively neutral declarative intonation when presenting the stimuli so that the three words in the sentence would receive similar prominence. The examiner then placed the corresponding sequence of symbols on the work surface. The model given on each familiarization trial consisted of the three symbols representing the two nouns and the verb of the spoken sentence, in their order of mention in the spoken sentence, placed in a left to right linear arrangement below the photograph on the work surface. The examiner's symbol sequence was removed from the work surface and the participant was asked to ‘tell the same story’ using the symbol cards. General encouragement was provided, but the participant was not required to produce a particular, specific sequence of symbols in order to pass the familiarization trial as long as he or she was attending to the examiner and participating in the task. When the participant indicated that his or her ‘story’ was complete, the next trial was presented. There was no time limit for the familiarization phase, and the participant was allowed to ask any questions that he or she wished. None of the participants had difficulty with the task and completed the familiarization phase in four trials.
Experimental task
On each trial of the experimental task itself, the examiner positioned the photograph corresponding to the sentence stimulus in the center of the carpet-covered board on the easel. She then spoke the sentence and asked the participant to repeat it verbally, to establish it as the target. The participant was then asked to ‘tell the same story’ for the puppet Rainbow, using the symbol cards. The participant selected the symbol cards that he or she wanted to use. There were no restrictions made on how the participant selected and placed the symbols. For example, he or she could take one symbol at a time and place it in the desired location, or pick up all of the chosen symbols at once and then place them. Once the participant had completed his or her ‘story’, the examiner recorded the symbols selected as well as their order and placement on the board.
Data recording, coding and scoring
Each symbol of the child's response was coded according to the grammatical category of the corresponding spoken word and its position in the stimulus sentence: N1=the first noun mentioned; V=the verb mentioned; and N2=the second noun mentioned. For example, the sequence recorded as FILLE POUSSE GARÇON in response to the sentence ‘La fille pousse le garçon’ would be coded N1 V N2. However if the same sequence of symbols was used in response to the sentence ‘Le garçon pousse la fille’, it would be coded N2 V N1 because the symbol representing the second noun mentioned in the spoken sentence (la fille) was first in the sequence of graphic symbols. Symbols used in the response that were not part of the sentence stimulus were coded N- (for the noun not mentioned) or V- (for the verb not mentioned).
Responses were then assigned two scores, one for the selection of symbols and one for how the symbols were sequenced. The symbol selection score included three dimensions. A response was given a score of 1 for correctness if it contained only symbols representing words included in the stimulus sentence (target symbols) and 0 if one or more erroneous symbols, not mentioned in the spoken stimulus sentence, were also present (i.e. N- or V-). A response was given an additional score of 1 for completeness if it contained all three of the target symbols (N1, N2, V) and 0 if one or more of the target symbols was missing from the response. A response was then scored as 1 for control if there were no repetitions of the symbols corresponding to the words of the spoken stimulus sentence, and 0 if one or more of them was repeated. Thus the selection score for each response could range from 0 to 3.
The score for symbol sequencing evaluated the consistency of a participant's responses across the eight trials, whether or not the symbol sequence corresponded to the expected spoken sequence. The consistency score was the highest number of trials on which the participant used a given sequence type (e.g. N1–V–N2, N1–N1–V–V, N2–N1–V, etc.), ranging from 8 (if the participant used the same sequence type on all trials) to 1 (if the participant used a different sequence type on each trial).
Interpretation Task
The Interpretation Task is the same as that used by Trudeau et al. (Reference Trudeau, Sutton, Morford, de Broeck, Dagenais, Pauzé and Vallée2006). However, only one condition was analyzed in the present study, specifically interpretation of three-symbol sequences, because of its parallel relationship with the Transposition Task. (Sequences of four and five symbols were included in the larger study.) The Interpretation Task always followed the Transposition Task to insure that graphic symbol sequences presented on the Interpretation Task would not influence transposition performance.
Stimuli
The stimuli were sequences of three symbols constructed using the same symbols as for the Transposition Task. Three types of sequences were included: one corresponding to the expected target for the Transposition Task, i.e. the canonical S–V–O order of a spoken sentence, N1–V–N2, and two other possible orderings of the same three symbols, N1–N2–V and V–N1–N2, that were used as fillers. Eight exemplars of each sequence (the target canonical order and the two filler sequences) were constructed by combining four pairs of noun symbols (GIRL–CLOWN; BOY–CLOWN; CLOWN–GIRL; CLOWN–BOY) with the two action symbols (PUSH, PULL). There were thus a total of twenty-four stimulus items.
The stimuli were organized into four blocks of twelve. Four of the target sequence (N1–V–N2) and four items of each of the filler sequences were randomly assigned to each of two blocks. The items within each block were randomized. Each participant received one block of stimuli chosen at random with the constraint that the blocks were equally distributed across the group of participants. Thus each participant received a set of twelve stimuli containing four randomly selected target sequence items and four of each of the filler sequences presented in random order.
Materials
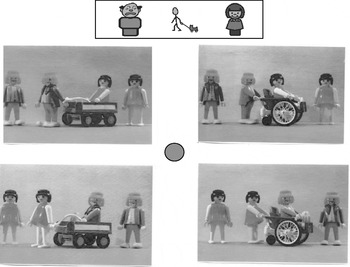
Photographs, described above for the Transposition Task, were arranged in arrays of four. A different array was constructed for each stimulus sequence using systematic combinations of the depiction of the action symbol (correct or incorrect) and the depiction of the agent and patient of the action (the first or the second noun symbol as agent: N1=agent or N2=agent). Thus the four options for a particular graphic symbol sequence were: (1) correct action+N1=agent; (2) correct action+N2=agent; (3) incorrect action+N1=agent; and (4) incorrect action+N2=agent.
PowerLaboratory software (Chute, Reference Chute1996) running on an iMac computer was used to present the stimuli and photographs, and to record responses. The software was configured so that four photographs appeared at once on the screen in a square arrangement. The stimulus was presented one symbol at a time at the top of the screen (see Figure 3). Each symbol was accompanied by speech output (provided by the iMac – the default setting of the synthetic speech) as it appeared on the screen. Speech output was included because this is the typical situation when using graphic symbols – most AAC devices include speech output. There was a 1 s delay following the presentation of each symbol, to provide a presentation that would resemble more closely the slow rate of message construction that is typical of graphic symbol communication. Each participant's responses were recorded by the software and saved in a uniquely identified file.
Example of a trial on the Interpretation Task.

Procedures
Participants received a familiarization session in order to ensure that they were comfortable with the materials and the instructions. First they were shown the symbols for the Interpretation Task and asked to name them. Then the experimental set-up was presented. An array of four photographs appeared on the computer screen and the participant was asked to touch one photograph. All participants were successful in selecting one photograph from the array. Then four practice trials were presented. On each practice trial, a sequence of three symbols appeared, one at a time at 1-s intervals on the computer screen above the four photographs. Each symbol was accompanied by speech output. The participant was asked to choose (by touching) the photograph that he or she thought went with the symbols. The trial was considered complete when the participant selected one photograph – a specific choice of photograph was not required. All participants passed all four familiarization trials without additional training. The materials used in the familiarization phase were similar to the ones in the actual experimental task, although the specific combinations of symbols were different (i.e. they involved a boy and a girl pushing or pulling each other, rather than a boy and a clown or a girl and a clown pushing and pulling each other).
On each of the experimental trials, a green dot appeared at the center of the screen. When the experimenter activated the trial, the array of four photographs appeared on the screen for 5 s. Then the symbol sequence appeared on the screen above the photographs, one at a time at 1-s intervals and accompanied by speech output. The participant touched the photograph matching the symbol sequence, and the computer recorded the response.
Data recording, coding and scoring
The frequency with which the participant chose each of the four response options for the target sequence, N1–V–N2, was calculated. Individual participants' response patterns were then classified as consistent if the participant chose the photograph depicting the same relationship of the nouns to the verb (i.e. N1=agent or N2=agent) on at least three of the four trials, or as inconsistent if any one response type was chosen on less than three trials. Further, among the participants who did respond in a consistent fashion, whether they chose the photograph depicting N1 or N2 as agent was noted.
Analyses
Score distributions were examined for each task in order to describe group and individual patterns. Data patterns were then compared across the two tasks and non-parametric comparisons were made of participant characteristics for subgroups of participants based on their score distributions.
RESULTS
Results are presented for each task separately and then compared across tasks.
Transposition Task
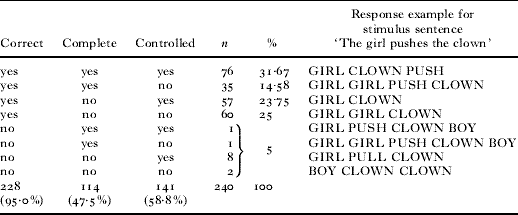
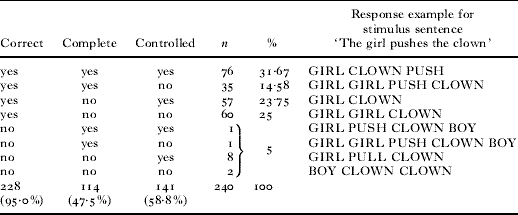
The first analysis concerned symbol selection in participants' responses. Table 1 shows the distribution of responses across selection characteristics (correctness, completeness, control). The large majority of responses (228/240, 95%) were scored as correct. Approximately half of responses (114/240, 47·5%) were scored as complete. Among the 137 omissions in the 126 incomplete responses (mean 1·07 omissions per incomplete response), 78% were V, 15% were N2 and 7% were N1. Over half of responses (141/240, 58·75%) were scored as controlled. Among the 143 repeated symbols within the 99 responses that included a repetition (mean 1·45 repetitions per response) 53% were of N2, 46% of N1 and only 1% of V.
Number (n) and percent (%) of responses meeting (yes) and not meeting (no) correct, complete and controlled criteria, and an example of a response of each type on the Transposition Task
The second analysis examined the sequences of the symbols produced. Over 40 different symbol sequences were observed across the group as a whole, including more than 20 specific combinations that occurred only once in the entire data set (i.e. on only one trial by one participant). This is particularly striking considering that the spoken sentence model was the same on each trial (i.e. N1–V–N2=S–V–O) and was demonstrated as the model symbol sequence during training. Even among the responses that contained all and only the three symbols corresponding to the words of the spoken sentence stimuli (n=76), a wide variety of sequence types was observed. The six logically possible orderings of the target symbols N1, V and N2 were all present in the data (n=76): N1–N2–V=41%, N1–V–N2=29%, V–N1–N2=9%, V–N2–N1=8%, N2–N1–V=8%, and N2–V–N1=5%.
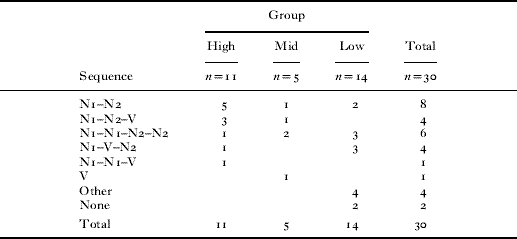
Consistency of response sequence differed across the participants. Participants were assigned to three groups on the basis of consistency scores: a score of 6/8 (75% of trials) or more was considered High (11 participants); scores of 4 or 5 were considered Mid-range (5 participants); and scores of 3 or less were considered Low (14 participants) (see Table 2). Although participants in the High group (n=11) all responded consistently, they did not respond in the same way: a total of five different symbol sequences were used, and only two of these met all three criteria in the symbol selection analysis above (N1–V–N2 and N1–N2–V) (see Table 2).
Symbol sequences contributing to consistency scores and number of participants using each most frequently in the High (consistency scores 6, 7, 8), Mid (consistency scores 4, 5) and Low (consistency scores 1, 2, 3) groups on the Transposition Task
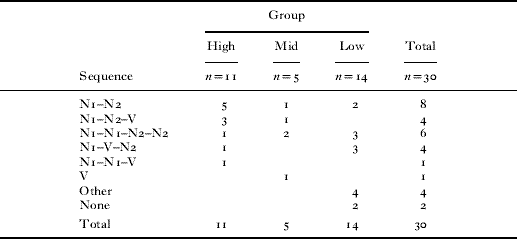
Consistency of responding on the Transposition Task was only weakly related to the receptive vocabulary and grammatical comprehension assessment tasks. Non-parametric comparisons (Kruskal–Wallis χ2(2, N=30) revealed no significant differences among the High, Mid and Low groups, but differences in scores on the grammatical subtest (GM) of the Carrow approached significance (Kruskal–Wallis χ2(2, N=30)=5·66, p=0·059). The scores of the High and Low groups were compared (Mann–Whitney U (1, N=25)=37·00) and this difference also approached significance (p=0·028, p level set at 0·017 to adjust for multiple comparisons).
In summary, participants showed a broad range of performance on the Transposition Task even though they were able to correctly identify the individual symbols in training and were shown the same symbol sequence as a model. While almost all participants selected the correct symbols, there was variability in the completeness and the control of symbol selection. Further, the majority of the participants did not place the symbols they selected in a consistent sequence. Only one participant consistently placed the symbols in a sequence that parallels the word order of the children's spoken language (N1–V–N2).
Interpretation Task
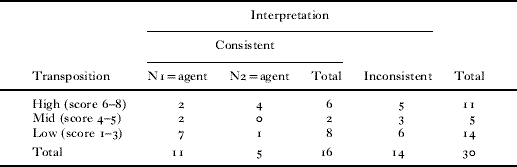
The target response for the N1–V–N2 sequence of symbols, that is, the photograph in which the first noun mentioned is depicted as agent and the verb mentioned is depicted as the action, was chosen most frequently (51·7%) (see Table 3). The action represented by the verb symbol was correctly identified in the large majority of responses (83·3%). Participants who chose the same response on 75% (3/4) or more of trials were considered to respond in a consistent fashion. Of the 16 participants who responded consistently, 11 (69%) chose the photograph depicting the correct action and N1 as agent (i.e. the target response) (see Table 4). However 5 (31%) participants consistently chose the photograph depicting N2 as agent. The remaining 14 participants did not choose any one response consistently.
Percent of responses (N=240) with N1 or N2 as agent and number of participants (n=30) consistently choosing each response (at least three trials of four) on the Interpretation Task

a 16·7% of responses across all participants included the incorrect depiction of the verb symbol.
b 14 participants did not respond consistently.
Number of participants (n=30) by consistency level on the Transposition Task and on the Interpretation Task
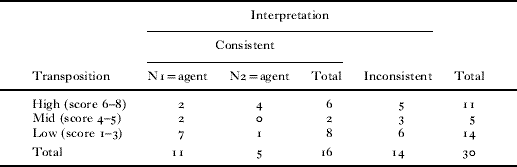
The participants were grouped based on their consistency scores: consistent N1=agent on 75% of trials (n=11); consistent N2=agent on 75% of trials (n=5); inconsistent (n=14). Non-parametric comparisons (Kruskal–Wallis χ2(2, N=30)) of age and language comprehension scores revealed no significant differences among the groups on any measure (p=0·481 or greater). The same result was obtained when the two groups that responded consistently were collapsed (either N1 or N2 as agent, N=16) relative to the group that responded inconsistently (N=14) (p=0·234 or greater).
Comparison of performance on the Transposition and Interpretation Tasks
Approximately one-third of participants responded in a consistent fashion on the Transposition Task and approximately one-half were consistent on the Interpretation Task. However, performance on one task did not necessarily predict performance on the other. Consistent and inconsistent responders in interpretation were equally represented at each level of consistency in transposition (see Table 4). Further, among the consistent responders in interpretation, those who favored N1 as agent (the predicted interpretation) were distributed across all levels of consistency in transposition. Of the five participants who preferred N2 as agent in interpretation, in transposition four responded consistently and one did not.
DISCUSSION
The results of this study suggest that three- to four-year-old children do not transfer their spoken language skills to a graphic representational system, but nonetheless demonstrate emerging abilities to engage in the use of graphic symbols. Transposing simple S–V–O spoken sentences into graphic symbols was not a straightforward task, even though the participants were able to repeat the sentences orally. Many measures were taken to make the tasks accessible to preschool-aged children, including: (1) the use of manipulable symbols (i.e. printed on cards and laminated) (Callaghan & Rankin, Reference Callaghan and Rankin2002; Gelman et al., Reference Gelman, Bullock and Meck1980; Fallon, Light & Achenbach, Reference Fallon, Light and Achenbach2003); (2) sentence repetition, to ensure that the intended structure was targeted; (3) visual supports to reduce memory load; (4) easy access to all symbols required to perform the tasks, to eliminate the need to compensate for limited vocabulary (Soto, Reference Soto, Loncke, Clibbens, Arvidson and Lloyd1999); and (5) ensuring that all information pertinent to the tasks (meanings of symbols and sentences) was present in the immediate context, to reduce decontextualization demands (Mineo Mollica, Reference Mineo Mollica, Light, Beukelman and Reichle2003). The findings suggest that selecting three specific symbols to correspond to elements of a spoken sentence required skills that had not yet been fully mastered by the participants, but they were not simply randomly selecting symbol cards. Some participants clearly had formed an idea of how S–V–O spoken sentences should be transposed into graphic symbols, whether or not their pattern resembled that of older children and adults (Trudeau et al., Reference Trudeau, Sutton, Dagenais, de Broeck and Morford2007). The variety of symbol sequence types suggests that they did not simply map the graphic symbols one-to-one onto a spoken language representation. Responding in a consistent fashion may draw on spoken language competence, but requires additional competencies as well.
Repetition of the noun symbols (N1, N2) suggests that the participants may have relied more heavily on elements of the photograph, which contained two exemplars of each figurine, rather than strictly following the spoken and symbol models presented during training, which contained only one mention of each noun. The photograph is a visual depiction, just as the graphic symbols are. Repetition of the noun symbols – the figurines – rather than the verb symbol – the action – suggests that it may have been easier for the participants to conform to characteristics of the photograph than to adhere strictly to the spoken sentence. However, the observation that the verb symbol was omitted far more frequently than either of the noun symbols is difficult to link directly with characteristics of the photographs and cannot be ascribed to greater familiarity with the noun symbols than with the verb symbols, since they were present during the training with equal frequency. Developmental changes in children's drawings of objects, another use of the graphic modality, have been attributed to changes in attention to different aspects of the objects to be drawn (Karmiloff-Smith, Reference Karmiloff-Smith1990). Applied to the Transposition Task, if some children were attempting to construct a graphic representation (i.e. ‘drawing’) of the photograph rather than strictly following the spoken sentence, they may have omitted the verb element because it was less salient in the photograph, or because the presence of agents and patients on the verb symbol conflicted with their use of separate graphic symbols to represent the agent and the patient.
On the Interpretation Task, the most frequent response of the participants was the same as the response chosen by older children and adults (Trudeau et al., Reference Trudeau, Sutton, Morford, de Broeck, Dagenais, Pauzé and Vallée2006), and therefore can be considered to be the target outcome of development, at least for native speakers of French. However, some participants responded consistently but differently from each other, suggesting that a sequence of graphic symbols does not have a particular inherent interpretation and may therefore be open to misunderstanding, at least for preschool-aged children. Sensitivity to sequential ordering of symbols appears to be distinct from mapping symbols onto spoken words.
Contrary to expectation, performance on the two types of graphic representational tasks, transposition and interpretation, was not related. This finding contrasts with research suggesting that experience with one form of representation may facilitate use of another form (Stephenson & Linfoot, Reference Stephenson and Linfoot1996), for example, comprehension of spoken language and comprehension of graphic symbols (e.g. Sevcik, Reference Sevcik2006; Sevcik & Romski, Reference Sevcik, Romski, Reichle, Beukelman and Light2002) or symbolic skills in play and graphic symbolic functioning (Callaghan & Rankin, Reference Callaghan and Rankin2002). The tasks used in the present study required treatment of graphic representations beyond the level of single symbols, in contrast to the majority of studies of children's comprehension and use of graphic representations (Callaghan, Reference Callaghan2005; Golomb, Reference Golomb2004). The task demands may have been too high to uncover common underlying abilities required of both tasks. Further, it is possible that the two types of graphic representation used in the study, the photographs and the symbols, may have introduced a certain level of confusion that hindered the children's ability to make the link between the spoken sentence and the graphic symbol sequence. These complex tasks would need to be unpacked into their component parts in order to identify the order in which children master these subcomponents and how abilities in transposition and interpretation are related.
The use of strategies when a skill has not yet been mastered, a recurring theme in child development, has been observed in studies of language comprehension (e.g. Clancy, Lee & Zoh, Reference Clancy, Lee and Zoh1986) and in literature on graphic representational development (e.g. Picard & Vintner, Reference Picard and Vintner2005). It is not possible to determine from the results of this study whether a specific developmental progression of strategies exists for transposition of spoken sentences into graphic symbols because only one participant actually produced the target sequence of symbols consistently. Instability is often a marker of incipient learning (Siegler, Reference Siegler1994). Some children who were changing strategies across the tasks may have been engaged in learning how spoken words relate to graphic symbols, consistent with cognitive development literature demonstrating a high rate of variability in the paths that children take towards attainment of higher levels of functioning (e.g. Fischer & Rose, Reference Fischer, Rose, Thatcher, Lyon, Rumsey and Krasnegor1996). If so, grouping children for analysis on the basis of the consistency of their responses may have mixed children who were more advanced with children who were less advanced. Further research will be required in order to explore patterns of variability and learning in graphic symbol utterance interpretation.
The results are consistent with other findings suggesting that young children do not approach graphic symbols and spoken language in the same way (e.g. Fallon et al., Reference Fallon, Light and Achenbach2003), and may even contribute to a possible explanation for the differences observed. If children are uncertain as to which symbols to include in their utterances, for example, it is not surprising that they also experience difficulty in making the transition from one- to two-symbol utterances (Paul, Reference Paul and Paul1998) and that their graphic symbol sequences become more atypical in structure with increasing length (Soto, Reference Soto, Loncke, Clibbens, Arvidson and Lloyd1999). Children needing graphic symbols for communication may require specific competence and skills in the graphic modality in addition to skills that support language development in typically developing children (symbolic representation and linguistic skills, world knowledge, and social and pragmatic skills). Although primarily a modality issue, there may be deeper implications for language organization itself because the set of contrasts within the spoken language differ from what can be expressed in an AAC system. Such typological effects are also seen within spoken languages; word order is typically more flexible in spoken languages with rich morphology because distinctions expressed through syntactic devices in other languages can be encoded with morphological contrasts. Similarly, distinctions that cannot be encoded in graphic symbols may have an impact on the wider language system because of the need to find ways to express relevant contrasts within the means available.
The comparison of the performance of these preschool-aged participants with the highly consistent and uniform performance of older groups of participants (Trudeau et al., Reference Trudeau, Sutton, Dagenais, de Broeck and Morford2007) suggests that major changes take place between the ages of four and seven years in skills that support transposition and interpretation of graphic symbol utterances. The possibility that these skills may be metalinguistic in nature has been raised in the AAC literature (e.g. Smith, Reference Smith, von Tetzchner and Jensen1996; Trudeau et al., Reference Trudeau, Sutton, Dagenais, de Broeck and Morford2007; von Balkom & Welle Donker-Gimbrère, Reference von Balkom, Welle Donker-Gimbrère, von Tetzchner and Jensen1996), but not explored in depth. Metalinguistic skills allow the individual to attend to and analyze the components of the language (phonology, lexicon, grammar, discourse, etc.) and to exert a certain degree of conscious control of these components (Karmiloff-Smith, Grant, Sims, Jones & Cuckle, Reference Karmiloff-Smith, Grant, Sims, Jones and Cuckle1996). In order for children to employ graphic symbols as a substitute for spoken linguistic communication, they must grasp dual representation not only of graphic symbols themselves (the symbol is an object and a representation) (Golomb, Reference Golomb2004; Mineo Mollica, Reference Mineo Mollica, Light, Beukelman and Reichle2003), but also of spoken words (the phonetic form is an arbitrary symbol standing for the referent). Mastering the complexity of the levels of representation involved in relating multiple spoken and graphic symbols was beyond the abilities of most of the young children who participated in this study.
The findings of the study have implications for clinical intervention with children needing AAC systems. Sequencing of symbols was more difficult than was choosing the appropriate symbols, suggesting that selecting the correct symbols may be an earlier intervention target than specific symbol orderings. Communication partners need to be flexible in their interpretations of graphic symbol sequences, at least when produced by young children, because orderings may be variable. If greater attention is attributed to visual stimuli, such as the photographs used in the study, than to the spoken sentence, this calls into question the use for assessment and intervention of static visual stimuli such as photographs and drawings as a way of eliciting utterances, because it could detract from the child's attention to the language structures. The frequent omission of the verb symbol may reflect a phenomenon occurring at the early stages in the acquisition of graphic symbols for communication similar to the focus on nouns that is frequently observed in the early stages of ‘breaking the code’ in both first- and second-language acquisition (e.g. Gentner, Reference Gentner and Kuczaj1982; but see Lust, Reference Lust2006, for a discussion). However, verbs are necessary for the production of more complete and complex structures (e.g. Tomasello & Merriman, Reference Tomasello and Merriman1995) and therefore may require specific attention in AAC intervention in order to facilitate the development and use of more advanced language.
These findings with preschool-aged children without disabilities should not be interpreted to mean that graphic symbol AAC systems should be withheld from young children who need them. Children who have received AAC systems may develop the needed skills through experience, practice and intervention that the participants of this study did not have. They may even be at an advantage metalinguistically because of their exposure to alternate forms of communication, somewhat analogous to children raised in a bilingual context (Genesee, Paradis & Crago, Reference Genesee, Paradis and Crago2004).
Future directions
Whether individuals using AAC systems, functioning at similar language levels to the participants of this study, approach the tasks of transposition and interpretation in the same fashion is a question for future studies. Further research is needed to explore systematically whether the sources of difficulty in transposition are within a particular modality itself (e.g. the graphic modality) or rather the need to cross modalities (e.g. from speech to symbols, or from symbols to speech). In addition, research with older children, between the ages of four – when transposition is still difficult, as found in this study – and seven years – when transposition of simple sentences appears to be mastered (Trudeau et al., Reference Trudeau, Sutton, Dagenais, de Broeck and Morford2007) – will help clarify the emergence of these skills and determine whether correct performance is more likely to emerge from variable responding or from consistent responding that is not aligned with the spoken language. The relationship between transposition and interpretation also merits further exploration with older children because it speaks to issues related to comprehension and production in language and in graphic representation.
Reversible sentences were used as stimuli for a particular methodological reason, but this may have given rise to an additional difficulty that exceeded the level that preschool-aged participants can comfortably manage within the graphic symbol modality. Future studies may require inclusion of a variety of sentence types including non-reversible sentences and intransitive verbs in order to provide a more fine-grained examination of progression towards mastery of utterances composed of graphic symbols.
Future research should also address directly the hypothesis that metalinguistic skills may play a role in utterance construction and interpretation when graphic symbols are used. In addition to the increasing understanding of metalinguistic knowledge in general, such studies would serve to identify key elements for intervention to improve expressive language skills of children requiring AAC systems for communication.