I. INTRODUCTION
As the display industry pushes toward larger-, faster-, and higher-resolution displays, the performance demands on the thin film transistor (TFT) backplane are rapidly increasing. New technologies such as thin flexible substrates for lightweight or curved design, active matrix organic light-emitting diodes for color and brightness, and fully transparent displays for windows and heads-up display applications have even more stringent backplane requirements. The currently dominant materials, amorphous and polycrystalline silicon, suffer from lack of transparency, marginal electronic performance, and poor threshold voltage stability (amorphous silicon) and require vacuum deposition fabrication, which may lead to uniformity issues over large areas (poly-Si).
Recently, transparent amorphous oxide semiconductors (TAOS), namely ZnO-based materials, have drawn significant interest for these applications. In n-type zinc oxide alloys, the metal s orbitals form the conduction band. Due to the s orbital’s spherical symmetry, good electron conduction and high mobility can be achieved even for amorphous films.Reference Nomura, Ohta, Takagi, Kamiya, Hirano and Hosono1 These materials, particularly amorphous indium gallium zinc oxide (IGZO), have already demonstrated their capability for next generation displays.Reference Kwon, Son, Jung, Kim, Ryu, Park, Kim, Lee, Kim, Kim, Park, Lee and Kim2–Reference Ito, Kon, Miyazaki, Ikeda, Ishizaki, Matsubara, Ugajin and Sekine5 However, the price of indium is rapidly increasing due to its widespread use for indium tin oxide (ITO) transparent conductors, driving the need for other high performance TAOS alloys. Zinc tin oxide (ZTO) is one promising alternative. ZTO can be deposited in vacuum, typically by Radio Frequency (RF) magnetron sputtering or pulsed laser deposition.Reference Hong, Chiang and Wager6–Reference Görrn, Hölzer, Riedl, Kowalsky, Wang, Weimann, Hinze and Kipp8 However, solution processes are very attractive for further lowering the cost for large area deposition since they do not require a high vacuum system and less target material is wasted. Liquid ink processes, such as spin coating and inkjet printing, have been used for ZTO deposition using metal chlorides or metal acetates or a combination of these precursors to demonstrate material and device feasibility.Reference Chang, Lee, Herman and Chang9–Reference Avis and Jang17
The charge transport mechanisms of these materials and the structure and origin of subconduction band-tail states are still being investigated. Knowing the band structure is important to enable successful device simulation and device stability studies.Reference Shin, Hwang, Cheong, Park, Cho, Ryu, Yoon, Byun, Yang, Chu and Cho18–Reference Jeon, Kim, Lee, Kim, Kim, Park, Kim, Song, Park, Chung, Lee, Ahn, Park, Park and Kim23 For both single-crystal and amorphous IGZO, percolation conduction over potential barriers in the vicinity of the conduction band edge has been proposed.Reference Nomura, Kamiya, Ohta, Ueda, Hirano and Hosono24–Reference Lee, Ghaffarzadeh, Nathan, Robertson, Jeon, Kim, Song and Chung27 There have been limited studies of charge carrier transport in ZTOReference Lee, Cobb and Dodabalapur28 and few studies of solution-processed metal oxides of any type.Reference Kim, Cho, Moon, Kim, Kim, Kim and Yun22, Reference Lee, Cobb and Dodabalapur28 It is not yet established whether the transport mechanism and donor levels are similar to those of vacuum-deposited amorphous IGZO. Furthermore, it is well known for vacuum-deposited IGZO and ZTO that process conditions and chemical composition have significant effects on the room temperature performance of TFTs,Reference Jeong, Jeong and Moon10, Reference Kim, Han and Park29–Reference Hoffman31 but the source of these variations, i.e., changes in donor or defect state energy levels, is not well understood. Here, we use cryogenic measurements of solution-processed ZTO TFTs to study the influence of ternary alloy composition and fabrication process variables on charge transport and band-tail states. Our results show that the carrier transport mechanism in ZTO is similar to that of IGZO—percolation conduction—and that the location of donor-like states and the shape of conduction band-tail states can be engineered by varying annealing temperature of the solution process and varying stoichiometric ratio of the material to obtain high-quality films.
II. EXPERIMENTAL
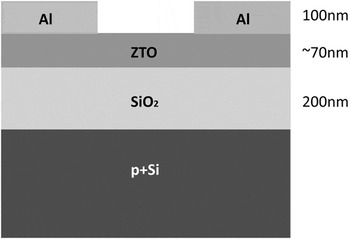
Bottom gate top contact ZTO TFTs are fabricated. Heavily doped p-type Si wafer is used as the gate electrode, with a 200-nm thermally grown SiO2 layer as the gate dielectric. Using a process similar to that in Ref. Reference Jeong, Jeong and Moon10, the active layer is deposited by spin coating a metal acetate precursor solution and subsequent annealing. The solution is prepared by dissolving zinc acetate dihydrate and tin (II) acetate in 2-methoxyethanol, with a total metal precursor concentration of 0.5 M and various zinc to tin ratios, stirring the mixture at room temperature for 12 h, and finally filtering the mixture through 0.22-μm syringe filter before spin coating. Here, the Zn:Sn ratio refers to the atomic metal ratio in the liquid ink. The solution is spin-coated at a speed of 3000 rpm for 30 s. The samples with zinc to tin ratio of 7:3 are annealed at different temperatures varying from 480 to 300 °C in air with a controlled relative humidity of 20% for 1 h, while samples with other zinc to tin ratios are all annealed at 480 °C. This temperature is high enough to ensure complete decomposition of the molecular precursorsReference Jeong, Jeong and Moon10 while also being low enough to avoid crystallization of the ZTO film.Reference Chiang, Wager, Hoffman, Jeong and Keszler32 We find that low relative humidity of the anneal ambient is critical to achieve good device performance. Multiple layers are spin-coated onto the samples to increase the active layer thickness. After each spin-coating step, the sample is annealed at the given anneal temperature in air at 20% relative humidity for 1 min to begin the drying process. Upon spinning the final layer, the sample is annealed under the same conditions for 1 h. Source/drain electrodes of 100 nm Al are then deposited by thermal evaporation through a shadow mask. The channel width/length of the transistor is 3000 μm/200 μm. The active layer is patterned by wet etch using dilute hydrochloric acid (1:100). The device structure is shown in Fig. 1.
Cross-sectional structure of ZTO TFT.

Film morphology is investigated using scanning electron microscopy (SEM), transmission electron microscopy (TEM), selected area electron diffraction (SAED), and atomic force microscopy (AFM). The nominal TFT electrical performance is tested in ambient air and light using an HP4155A semiconductor parameter analyzer (Agilent Technologies, Inc., Santa Clara, CA). Low-temperature current–voltage TFT measurements are conducted using a Lakeshore FWP6 vacuum probe station (Lake Shore Cryogenics, Inc., Westerville, OH) cooled by continuous flow of liquid nitrogen. The substrate temperature is varied from 77 to 300 K using a Lakeshore 340 temperature controller (Lake Shore Cryogenics, Inc., Westerville, OH).
III. RESULTS AND DISCUSSION
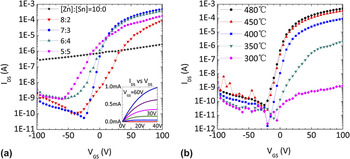
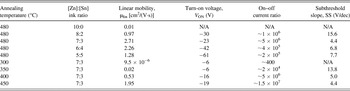
The room temperature transfer curves of drain current versus gate voltage for different Zn to Sn ratios and different annealing temperatures are shown in Fig. 2, and the extracted transistor parameters are listed in Table I. The best performance is seen for ink Zn:Sn ratios of 7:3 and anneal temperature of 480 °C. Samples with Zn content greater or lesser than the optimal 70% value exhibit lower mobility and reduced on/off current ratios. When only zinc precursor is used, the resulting film is conductive, exhibiting very weak field effect. This may be due to poor control over intrinsic carrier concentration,Reference Nomura, Ohta, Takagi, Kamiya, Hirano and Hosono1, Reference Nomura, Ohta, Ueda, Kamiya, Hirano and Hosono33 perhaps due to the formation of nanocrystallites, which others have previously observedReference Jeong, Jeong and Moon10, Reference Banger, Yamashita, Mori, Peterson, Leedham, Rickard and Sirringhaus34 and which can be seen in SEM of our ZnO films [Fig. S1(a) of Supporting Information]. Lower Zn:Sn ratios show larger subthreshold slopes and lower mobility. Other work on solution-processed ZTO made from acetates has similarly found that the optimal Zn:Sn ratio is 7:3 with mobility of 1.1 cm2/V s with a maximum anneal temperature of 500 °C.Reference Jeong, Jeong and Moon10, Reference Kim, Jeong, Song, Park, Cao and Moon13 The higher mobility of our optimal devices, 2.7 cm2/V s, may be due to the low humidity anneal ambient we utilize.
(a) Transfer curves of ZTO TFT with different solution precursor [Zn]:[Sn] ratios, annealed at 480 °C. Inset, an output curve of a ZTO TFT with precursor ratio [Zn]:[Sn] = 7:3, annealed at 480 °C, with V GS = 60, 50, 40, 30, 20, 10, and 0 V. (b) Transfer curves of ZTO TFT with precursor [Zn]:[Sn] = 7:3, annealed at different temperatures. All transfer curves were taken at V DS = 5 V.

Electrical parameters of ZTO TFTs fabricated at different annealing temperatures or from different zinc to tin ink ratio.

The device performance also depends on anneal temperature as shown in Fig. 2(b). The higher the anneal temperature, the greater the mobility. Devices annealed at 450 °C or greater show mobility of ∼2 cm2/V s or more. Transistors prepared at 350 °C or less are characterized by low on/off current ratios, likely due to incomplete reaction of the precursors.Reference Jeong, Jeong and Moon10 An output curve for the optimum device is shown in the Fig. 2(a) inset. Clear linear and saturation regions are observed.
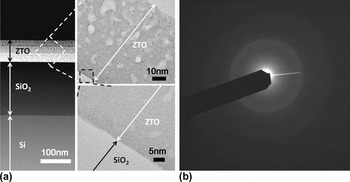
The cross-sectional view of the optimal ZTO solution-processed film obtained by TEM is shown in Fig. 3(a), and a top-down SEM image is shown in Fig. S1(b) of Supporting Information. The total film thickness for three layers is about 72 nm. The films are nonporous and amorphous, with very fine texturing on the order of ∼5 nm. The surface of ZTO is characterized by AFM and shown in Fig. S2 of Supporting Information. The film is very smooth, with rms surface roughness of 1.5 nm. The observed texturing may be due to solvent evaporation dynamics during film formation. SAED was also performed on the TEM samples, and the diffraction pattern is shown in Fig. 3(b). With only the amorphous ring visible and no obvious diffraction spots, the diffraction results confirm that the ZTO film is amorphous after high-temperature annealing.Reference Banger, Yamashita, Mori, Peterson, Leedham, Rickard and Sirringhaus34
(a) Cross-sectional TEM views of a three-layer ZTO film. The lower right image shows the amorphous and nonporous ZTO film at its interface with SiO2. (b) SAED of the ZTO layer, indicating amorphous structure.

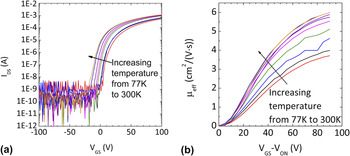
Figure 4(a) shows the changing transistor transfer curves for temperatures ranging from 300 to 77 K for a transistor with W/L = 3000 μm/200 μm, on a sample prepared with zinc to tin ink ratio of 7:3 and annealed at 480 °C. As temperature increases, the threshold voltage shifts to more negative values. This effect has been previously been observed experimentally and confirmed by simulation for ZTO and GIZO by other groups.Reference Godo, Kawae, Yoshitomi, Sasaki, Ito, Ohara, Kishida, Takahashi, Miyanaga and Yamazaki21, Reference Lee, Cobb and Dodabalapur28, Reference Chen, Abe, Kumomi and Kanicki35–Reference Kaneko, Inoue, Saito, Furutake, Sunamura, Kawahara, Hane and Hayashi37 Others have hypothesized that the threshold shift with temperature is due to thermal excitation of electrons from localized traps so that the electrons can contribute to the free carrier concentration.Reference Lee, Cobb and Dodabalapur28, Reference Chen, Abe, Kumomi and Kanicki35, Reference Ji, Kim, Jung, Park, Mo, Jeong, Kwon, Ryu, Lee, Choi and Jeong36 For our optimal device, the threshold voltage shift only occurs for 160–300 K; for lower temperatures, the turn-on voltage does not significantly change, indicating that for certain localized trap states, the trapped electrons require thermal energy of more than ∼15 meV (i.e., k BT at 160 K) to escape the trap. The effective mobility, calculated from transconductance, increases as gate voltage increases and as temperature increases, as shown in Fig. 4(b). The effective mobility gradually plateaus for high V GS–V ON values.
(a) Measured transfer curves at various temperatures for a transistor with W/L = 3000 μm/200 μm on a sample with zinc to tin ink ratio of 7:3 and annealed at 480 °C. (b) Effective mobility at various temperatures. For both (a) and (b), curves are shown for 77, 100, 140, 180, 220, 240, 260, 280, and 300 K.

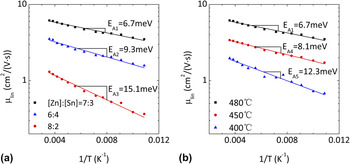
To gain deeper understanding of the band-tail structure, we examine the temperature dependence of linear mobility as a function of stoichiometry and anneal temperature. As shown in Fig. 5, for all samples, mobility increases as temperature increases according to the Arrhenius equation

(a) Thermal activation energy of mobility versus zinc to tin ratio, for TFTs annealed at 480 °C. (b) Thermal activation energy of mobility versus anneal temperatures, for TFTs with a Zn:Sn precursor metal ratio of 7:3.

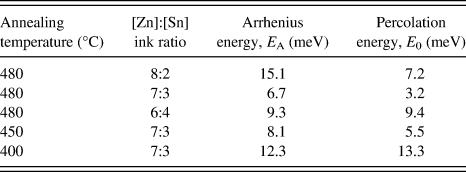
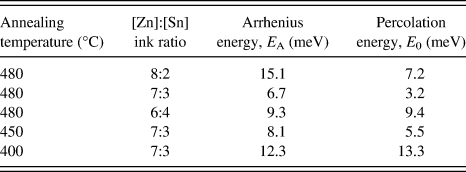
where μ0 is band transport mobility, E A is the activation energy, kB is the Boltzmann constant, and T is temperature. The mobility increase is caused by thermally exciting more electrons from the band-tail states to above the mobility edge. The activation energy, E A, the slope of the semilog plot of mobility versus temperature, corresponds to the location of the donor-like states below the mobility edge.Reference Kaneko, Inoue, Saito, Furutake, Sunamura, Kawahara, Hane and Hayashi37 By fitting the curve from 160 to 280 K, the values of E A are calculated and listed in Table II and the fits are shown in Fig. 5. All samples have shallow donor-like states that are close to the mobility edge, with activation energy smaller than 20 meV, i.e., less than k BT at room temperature. The plot shows that with higher annealing temperature and for zinc to tin ratio near 7:3, the donor-like state is closer to the conduction band edge. This may be due to a reduced amount of disorder or improved bonding in these films,Reference Nomura, Kamiya, Ohta, Ueda, Hirano and Hosono24, Reference Takagi, Nomura, Ohta, Yanagia, Kamiya, Hirano and Hosono25 and the very low E A value of ∼7 meV explains the reasonably high room temperature mobility measured.
Arrhenius energy and percolation energy of ZTO TFTs fabricated at different annealing temperatures or from different zinc to tin ink ratio.
To first order, the band-tail states can be extracted from low-temperature measurement following a technique adapted from Ref. Reference Nomura, Kamiya, Ohta, Ueda, Hirano and Hosono24. Sheet charge carrier concentration, N, is calculated as
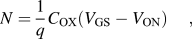
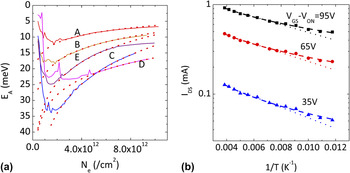
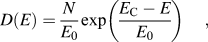
where q is the elementary charge, V GS is the voltage applied between gate and source, and V ON is the turn-on voltage of the transistor. By plotting the carrier concentration and thermal activation energy of drain current for each V GS−V ON value, the band-tail states can be approximated [Fig. 6(a)]. The curves show exponential decay, which indicates percolation conduction below the mobility edge. The percolation energy is estimated by an exponential decayReference Nomura, Kamiya, Ohta, Ueda, Hirano and Hosono24
(a) Band-tail states extracted from measured data (solid lines) and percolation energy fits (dotted lines) for various TFTs: A, B, and C have ink ratio of [Zn]:[Sn] = 7:3, annealed at 480, 450, and 400 °C, respectively. D, E were annealed at 480 °C with [Zn]:[Sn] = 8:2 and [Zn]:[Sn] = 6:4, respectively. (b) Comparison of exp(T−1) (dotted) and exp(T−1/4) (dashed) fit lines to measured drain current versus temperature for various V GS−V ON values, for a ZTO TFT fabricated with 7:3 Zn:Sn metal ink ratio and annealed at 480 °C.

where D(E) is the density of states, N is the carrier concentration, E C−E is the difference between the conduction band energy level and the charge carrier energy, here equal to E A, and E 0 is defined as the percolation energy, which characterizes the band-tail shape. The percolation energy is also dependent on process and stoichiometric composition of the film. The optimal samples with maximum annealing temperature and 7:3 zinc to tin ratio exhibit the steepest band tail with a percolation energy of only 3.2 meV. Even for a sample annealed at 400 °C, the percolation energy is ∼13 meV, much less than that measured for crystalline IGZO (32 meV in Ref. Reference Nomura, Kamiya, Ohta, Ueda, Hirano and Hosono24). The locations of the donor-like state and percolation energies of different samples are listed in Table II, and the fits are shown in Fig. 6(a).
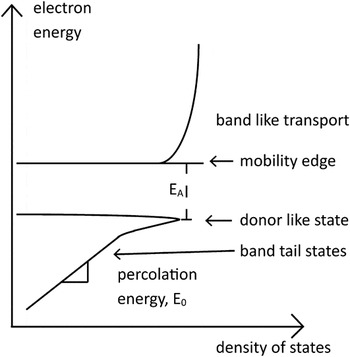
The band structure indicated by these results is shown in Fig. 7. Well below the conduction band, there are band-tail states with a density that increases exponentially with electron energy. These states are filled as bands bend under the application of a gate electric field and as temperature increases. As the electron energy approaches the conduction band, the density of states expands to hold a large concentration of carriers at a specific energy level. As we have shown, this energy level, equal to E A and equivalent to a pinned Fermi level, is determined by film stoichiometry and anneal temperature, and probably also by other variables not explored here. The electron energy cannot rise continuously above this level but must be thermally activated across this small (E A = 7–20 meV) gap into mobile, band-like states above the mobility edge. The plateau of the activation energy at high charge carrier concentrations can also be seen in Fig. 6(a).
Schematic of the band diagram of solution-processed ZTO.

The model just described fits the measured data for temperature from 160 K and higher. For lower temperatures, more complex behavior exists. Figure 6(b) illustrates this. Measured drain current is plotted as a function of temperature and is fit using the Arrhenius model [Eq. (1)] and an exponential T−0.25 model. The Arrhenius equation fits well in the medium to room temperature range (dotted lines), while the exponential T−0.25 model fits well across the entire temperature range (dashed lines). The latter model can be indicative of a multiple trap and release model, which was previously observed for solution-processed ZTO,Reference Lee, Cobb and Dodabalapur28 or a Gaussian distribution of percolation states, as observed in single-crystal IGZO.Reference Nomura, Kamiya, Ohta, Ueda, Hirano and Hosono24 This may indicate that multiple charge transport mechanisms are possible in these materials, and the dominant mechanism may depend on the temperature and charge carrier concentration, with other states frozen out such that they do not play a role in that regime.
IV. CONCLUSIONS
In conclusion, solution-processed ZTO TFTs are fabricated with different annealing temperature and different stoichiometric composition. Low-temperature current–voltage measurements are done on the transistors. The donor-like states, and band-tail states inside the band gap are characterized by a thermal activation energy E A, characterized by an exponential percolation energy, E 0, show process and composition dependency. High annealing temperature of 480 °C and optimal film stoichiometry (Zn:Sn ratio in ink of 7:3) brings the donor-like state level closer to the mobility edge (E A = 7 meV) and makes the band-tail states steeper (E 0 = 3.2 meV). The sharpness of the band-tail states correlates directly with the relatively large room temperature electron mobility of 2.7 cm2/V s. The film also has a large density of states near E A such that its Fermi energy is pinned inside the band gap. These charge transport mechanisms observed and the band structure parameters are comparable to or better than those achieved for vacuum-deposited amorphous metal oxide semiconductors, showing the potential of solution-processed methods to form high-quality inorganic amorphous semiconductor films. The high subthreshold slope and large turn-on voltage of the transistors compared to vacuum-deposited devices may be due to the multilayer structure, which might introduce undesired interface trap states. This can be addressed through process improvements. More work is also needed to explain the physical origin of the observed band-tail structure in these materials.
ACKNOWLEDGMENTS
This work was supported by National Science Foundation 2010 BRIGE Grant #1032538 and by the University of Michigan’s College of Engineering and Electrical Engineering and Computer Science Department internal funding. Portions of this work were performed in the University of Michigan’s Lurie Nanofabrication Facility, a site of the National Nanotechnology Infrastructure Network (NNIN), which is funded by the National Science Foundation. The authors thank K. Najafi for providing access to testing equipment, R. Gordenker for test lab assistance, and P. Herrera-Fierro for cleanroom support.