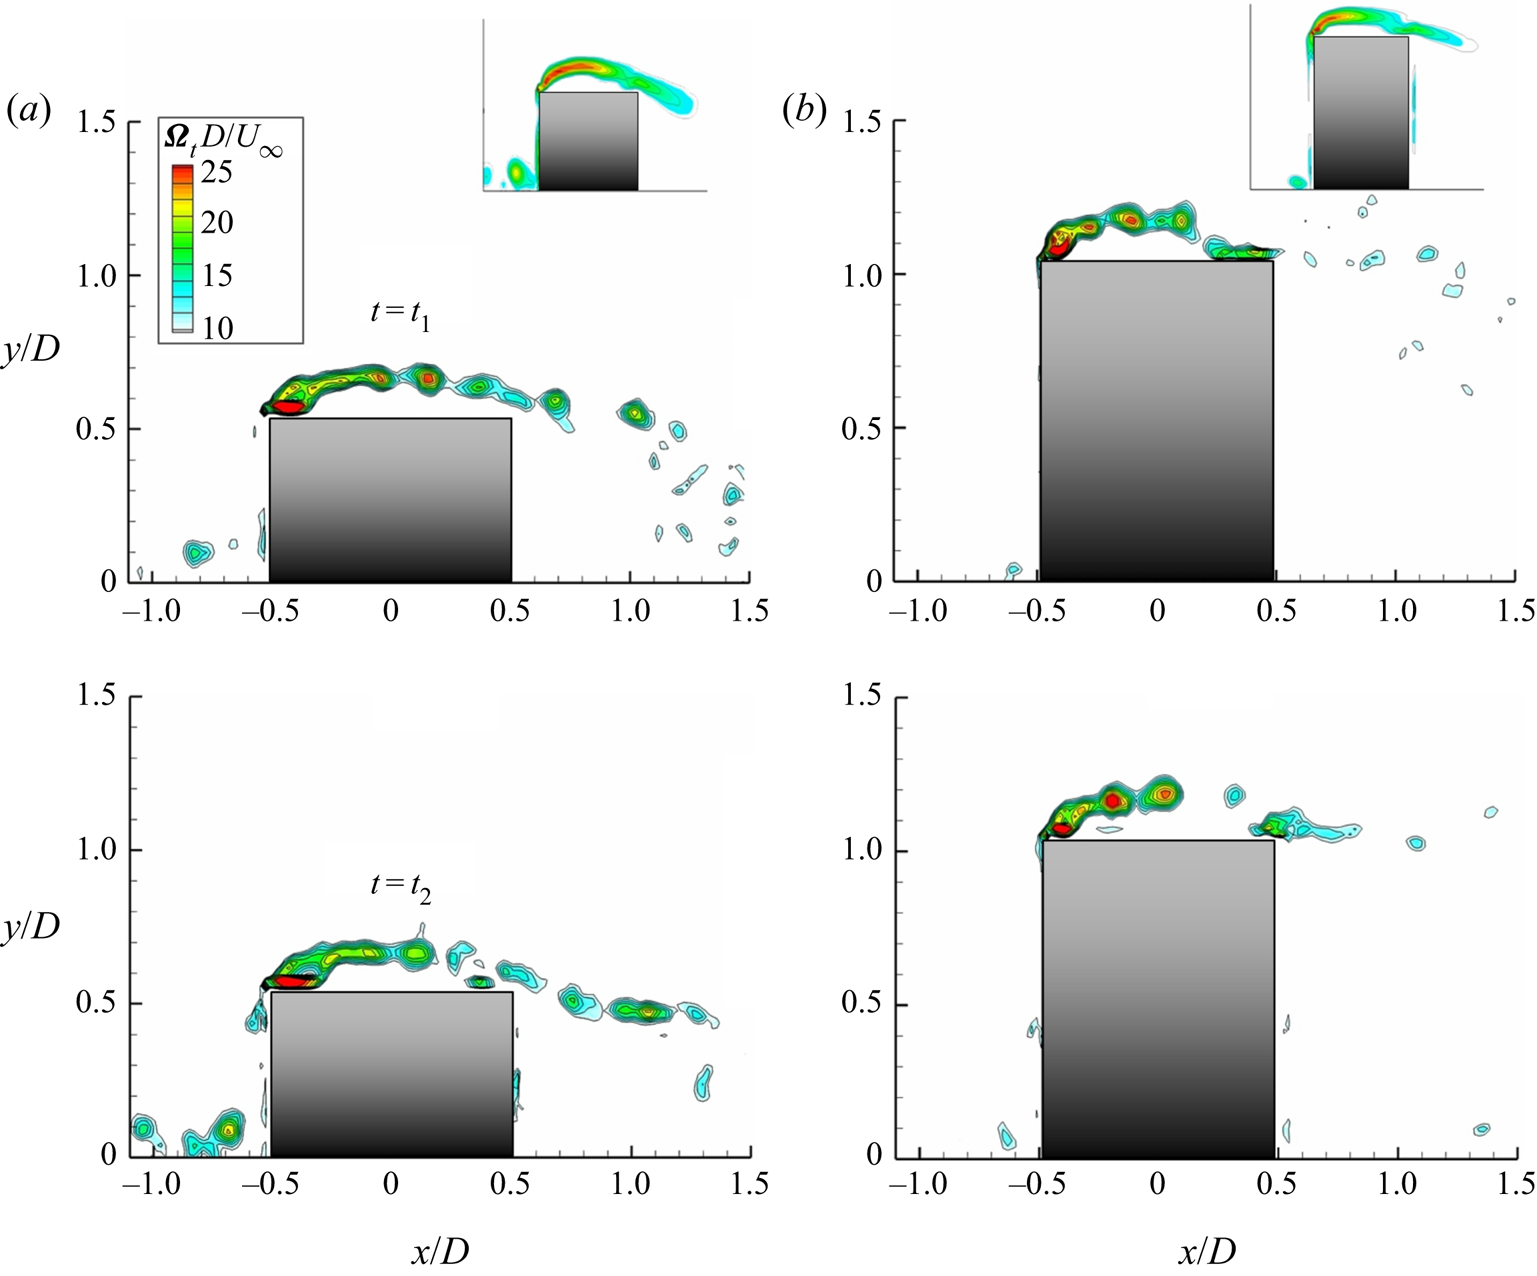
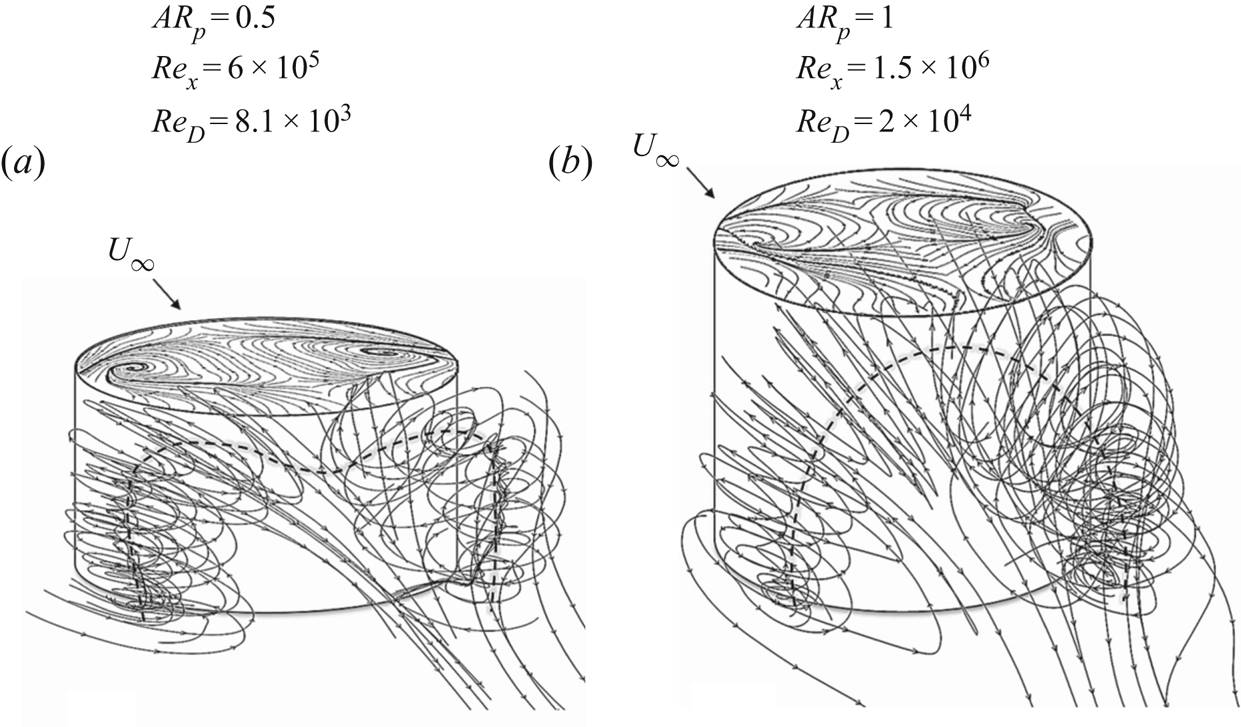
1. Introduction
The fundamental flow physics associated with a low aspect ratio cylindrical pin is investigated experimentally in the present work. The fluid interactions between finite-span, wall-mounted cylindrical bluff bodies and boundary layers are ubiquitous in nature and engineering applications. Examples of these wide-ranging applications include control surfaces on aircraft and underwater vehicles, heat exchangers, buildings, cooling towers and off-shore structures, among many others. Despite the geometric simplicity, the flow field surrounding a low aspect ratio, cantilevered cylindrical body is incredibly complex and highly three-dimensional. Although a historically popular topic of research, there is a lack of parametric studies, which quantify the characteristic vortical flow features. The existence of these robust vortical structures has been identified (e.g. Pattenden, Turnock & Zhang Reference Pattenden, Turnock and Zhang2005; Sumner Reference Sumner2013); however, a systematic quantification of the vortex dynamics under the influence of certain geometric conditions, as the cylindrical pin is immersed in both laminar and turbulent boundary layer conditions, is lacking. Achieving an improved knowledge of these types of flows will ultimately contribute to the development and optimization of effective flow control techniques involving low aspect ratio, cantilevered cylinders (i.e. cylindrical pins).
Unlike the flow field associated with a two-dimensional (2-D) cylinder, a cantilevered, finite-span cylinder is largely influenced by the presence of a spanwise velocity component, initiated by the downwash entrained over the free end of the cylinder. These strong end effects have resultant near wake behaviours analogous with a virtual splitter plate (i.e. Roshko Reference Roshko1993; Afgan et al. Reference Afgan, Moulinec, Prosser and Laurence2007). The interaction of higher momentum outer flow with the ground plane results in a symmetric recirculation and subsequent shedding mode; thus, imposing a wider wake and increased momentum deficit in the mean, relative to a 2-D cylinder. The degree of interaction between the downwash flow and the near wake is perhaps the principal element responsible for the general wake characteristics and subsequent vortical interactions, for a low aspect ratio, finite-span cylinder. This degree of interaction is predominantly dependent upon the aspect ratio,  $AR_{p}$ (the pin's height-to-diameter ratio) as shown by several researchers, (e.g. Sakamoto & Arie Reference Sakamoto and Arie1983; Wang & Zhou Reference Wang and Zhou2009; DeMauro et al. Reference DeMauro, Dell'Orso, Zaremski, Leong and Amitay2015). As stated by Kawamura et al. (Reference Kawamura, Hiwada, Hibino, Mabuchi and Kumada1984), for an aspect ratio less than a critical value,
 $AR_{cr}$, the vortex shedding mode transitions from the alternating von Kármán type to the symmetric arch-type shedding. Although this behaviour is universally recognized, the minimum aspect ratio required for the existence of quasi-two-dimensional von Kármán shedding has been shown to vary widely in the range
 $1 \leq AR_{cr} \leq 7$, see e.g. Uematsu, Yamada & Ishii (Reference Uematsu, Yamada and Ishii1990), Okamoto & Sunabashiri (Reference Okamoto and Sunabashiri1992), Fox & West (Reference Fox and West1993), Sumner, Heseltine & Dansereau (Reference Sumner, Heseltine and Dansereau2004), Frederich, Wassen & Thiele (Reference Frederich, Wassen and Thiele2008), Sumner & Heseltine (Reference Sumner and Heseltine2008) and Palau-Salvador et al. (Reference Palau-Salvador, Stoesser, Fröhlich, Kappler and Rodi2010). Below the critical aspect ratio, the documented Strouhal frequency is reduced,
 $St \approx 0.16$, and is ostensibly absent from the power spectra (e.g. Sakamoto & Arie Reference Sakamoto and Arie1983). Note that in the present work, the vortex shedding frequency,
 $f_{s}$, was identified from hotwire spectral analysis, yielding a Strouhal number of
 $St \approx 0.14$. In general, for a cylindrical pin below a critical aspect ratio, a unique mean wake structure exists and is sensitive to the relative thickness of the incoming boundary layer. It is this sub-critical range that forms the basis of the present study.
As stated, another notable parameter of competing importance is the relative submergence of the cylindrical pin within the local boundary layer. A major focus is to derive the flow field sensitivity to these parameters through a systematic survey and advance the understanding of the mechanisms which dictate the onset and development of the constituent vortical features. As such, a predominant challenge of this work was to experimentally vary the boundary layer thickness while keeping the cylinder Reynolds number constant, so as to isolate the effects of each parameter. Thus, the effects of the aforementioned parameters are studied concurrently. Another notable challenge was to address and quantify the three-dimensionalities associated with the finite-span, low aspect ratio cylindrical pin. As shown by Roshko (Reference Roshko1993), this three-dimensionality can be classified by intrinsic and extrinsic effects, which refer to the flow behaviours resulting from the naturally occurring instabilities and the end effects, which are characteristic traits of low aspect ratio cylinders.
A robust analysis of these three-dimensional flow characteristics has been reviewed in Pattenden et al. (Reference Pattenden, Turnock and Zhang2005) and Sumner (Reference Sumner2013). It was shown that the mean wake flow can be described by three constituent features: the horseshoe vortex, tip vortices and the arch vortex. The horseshoe vortex forms as a result of the three-dimensional boundary layer separation in the region of adverse pressure gradient upstream of the cylinder. This separated boundary layer rolls into a vortex and is swept around the base of the cylinder, developing into a system of streamwise oriented vortices downstream, as has been well documented by Baker (Reference Baker1979, Reference Baker1980). The tip vortices are issued from the pin's free end as a result of the high shear region impacted by an upwash flow around the cylinder sides and downwash over the top, as suggested by Etzold & Fiedler (Reference Etzold and Fiedler1976), Park & Lee (Reference Park and Lee2000, Reference Park and Lee2002, Reference Park and Lee2004) and Rostamy et al. (Reference Rostamy, Sumner, Bergstrom and Bugg2012). However, note that the mechanisms of formation are not broadly agreed upon. Okamoto & Yagita (Reference Okamoto and Yagita1973) and Kawamura et al. (Reference Kawamura, Hiwada, Hibino, Mabuchi and Kumada1984) showed that the tip vortices originate at the location of sidewall boundary layer separation just below the free end. Whereas, Etzold & Fiedler (Reference Etzold and Fiedler1976) and Park & Lee (Reference Park and Lee2000) reported their inception at the separation along the circumferential leading edge. The work presented in this study will address the mechanisms of their formation under the specified conditions, which appear to coincide more closely to that of Roh & Park (Reference Roh and Park2003) and Hain, Kähler & Michaelis (Reference Hain, Kähler and Michaelis2008) who reported that the tip vortices originate from two foci on the upper surface of the free end. The arch vortex is formed in the recirculation region and consists of the spanwise vortices shed from the pin sides, connected near the pin's free end by the strong spanwise flow over the top due to the downwash. However, it should be noted that the shape of the arch vortex in the near wake is not explicitly defined and is still a topic of discussion, as there are limited studies conducted on the complex nature of this structure using three-dimensional measurement techniques. The quantification of the arch vortex over a prescribed parameter space is conducted in the present study using stereoscopic particle image velocimetry (SPIV) techniques and will address the mechanisms responsible for changes in the wake vortex dynamics in further detail.
In conjunction with the inherent mean flow features, vorticity generated within the wake results in the formation of secondary structures, such as the trailing vortex pair. As has been documented by previous researchers, the trailing vortices have not been explicitly defined, but have been identified as the lower frequency component near the cylinder's free end (e.g. Lee & Wang Reference Lee and Wang1987; Kitagawa et al. Reference Kitagawa, Fujino, Kimura and Mizuno2002; Park & Lee Reference Park and Lee2002). Downstream of the pin, the separating tip vortices merge with the recirculation region and subsequently descend towards the ground from the impingement of the downwash flow. Consequently, these secondary interactions form the large-scale, counter-rotating streamwise trailing vortices, as shown in Pattenden et al. (Reference Pattenden, Turnock and Zhang2005). The present work will examine the nature and sensitivity of the aforementioned vortical structures over a parameter space of  $AR_{p} \leq 1$ and
 $h/\delta \leq 1$, as a function of Reynolds number.
As mentioned, there is an inextricable link between the three basic cylinder flow regimes (i.e. the developing boundary layer around the cylinder sidewalls, the separating shear layers and the wake). Although much attention has been placed on the wake flow characteristics, an understanding of the flow field around the pin, and over the free end, is essential to address the nature by which the constituent wake flow structures are formed. Some common features associated with the free end flow include the separation from the circumferential leading edge, and a separation bubble comprised of a mushroom-type vortex over the free end surface. As recently as 2013, there had been a lack of extensive studies regarding the role and structure of the free end flow over a finite-span, low aspect ratio cylinder, and likewise, the influence of these local behaviours in the near wake. The present study aims to address some of these deficiencies and expand the envelope of existent literature on low aspect ratio bluff body flows with particular attention to the parameters of aspect ratio, relative submergence within the boundary layer, and Reynolds number.
2. Experimental set-up and procedures
Experiments were conducted in the Rensselaer Polytechnic Institute's open-circuit, blow-down subsonic wind tunnel at the Center for Flow Physics and Control. The tunnel has a 100 hp blower with a test section cross-sectional area of  $0.8\ \textrm {m}\times 0.8\ \textrm {m}$, and a length of 5 m. The tunnel's area contraction ratio between the settling chamber and the test section is 9 : 1 with a length-to-diameter ratio of 1.5, attaining a maximum test section speed of approximately
 $50\ \textrm {m}\ \textrm {s}^{-1}$ and a free-stream turbulence intensity of less than 0.2 %. All sides of the test section are made from transparent acrylic to allow optical access for the SPIV measurements performed in this study.
A customized test module was inserted into a flat plate to host the low aspect ratio cylindrical pin, such that its vertical height could be manually adjusted. The flat plate had a total length of  $L = 1.2$ m, a span of
 $b = 0.61$ m and a thickness of 19.05 mm with a 4 : 1 elliptical leading edge. This model was also equipped with a 0.17 m adjustable sharp trailing edge flap, which served to manually adjust the location of the stagnation point at the plate's leading edge and was fixed at a deflection angle of
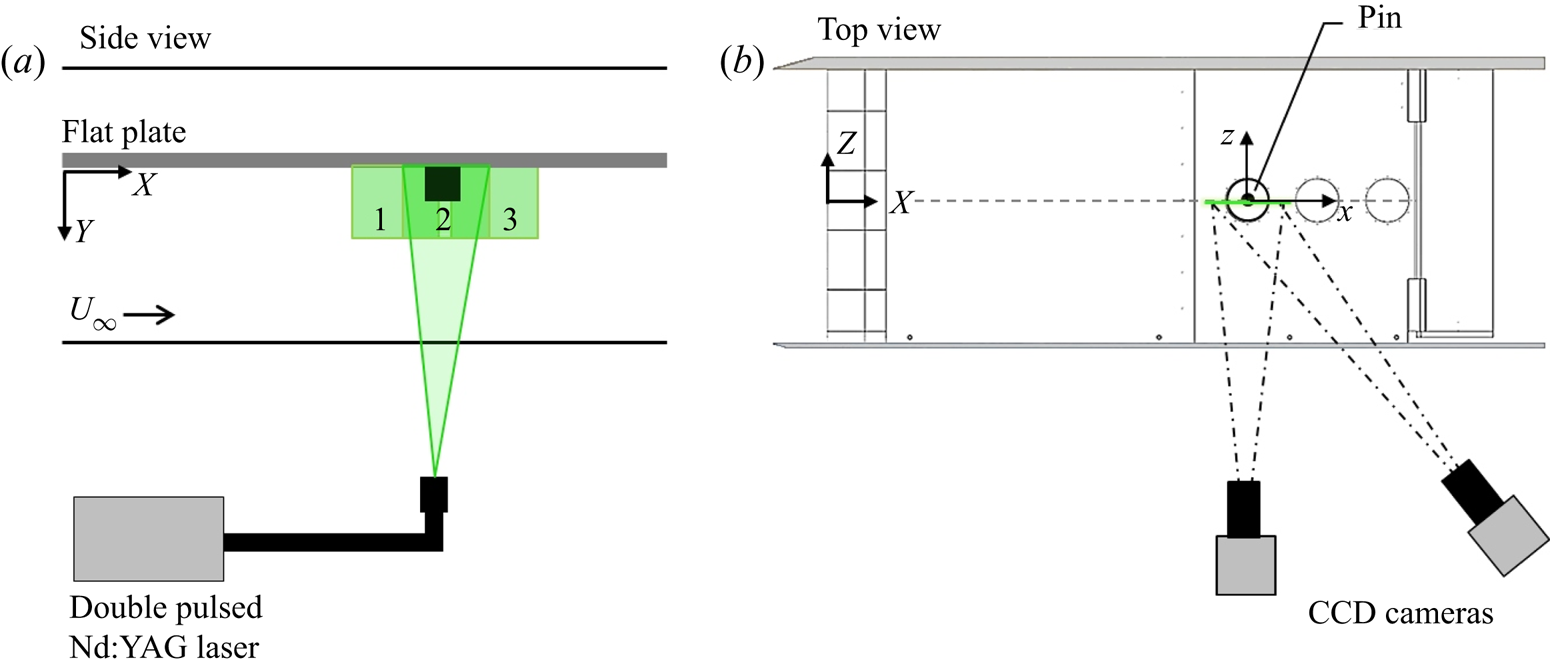
 $4^{\circ }$. Consequently, this ensured the ability to maintain a zero-pressure gradient over the entire length of the plate and adjust when conditions were necessary. The plate was mounted mid-height of the test section, fixed between two end walls, which were offset from the tunnel test section walls in order to prevent any 3-D contamination from tunnel wall effects (figure 1). Note that the surface of interest is faced towards the tunnel floor for convenient laser sheet access. The global coordinate system originates at the flat plate leading edge stagnation point, where X, Y and Z axes refer to the streamwise, wall-normal and spanwise directions, respectively. Correspondingly, a local coordinate system was used in the vicinity of the pin, (x, y, z), which originates at the pin's centre span and is typically non-dimensionalized by the pin's diameter, D.
Experimental set-up for the SPIV measurements (not drawn to scale). (a) Side view of the test section, and (b) top view of static pin module centred on the flat plate. The laser emits a sheet parallel to the free stream from below the tunnel floor and cameras are oriented parallel to the test section side windows.

The modular design of the flat plate facilitated convenient assembly and incorporation of different test cases at various streamwise locations, as shown by the three circular inserts along the model. The outboard side wall hosts an acrylic window for optical access. The location of the pin remained fixed at  $x = 0.9$ m (
 $x/L = 0.63$), and two dummy plug inserts were placed flush to the surface in the two holes farther downstream. Experiments were performed over a range of free-stream velocities, corresponding to
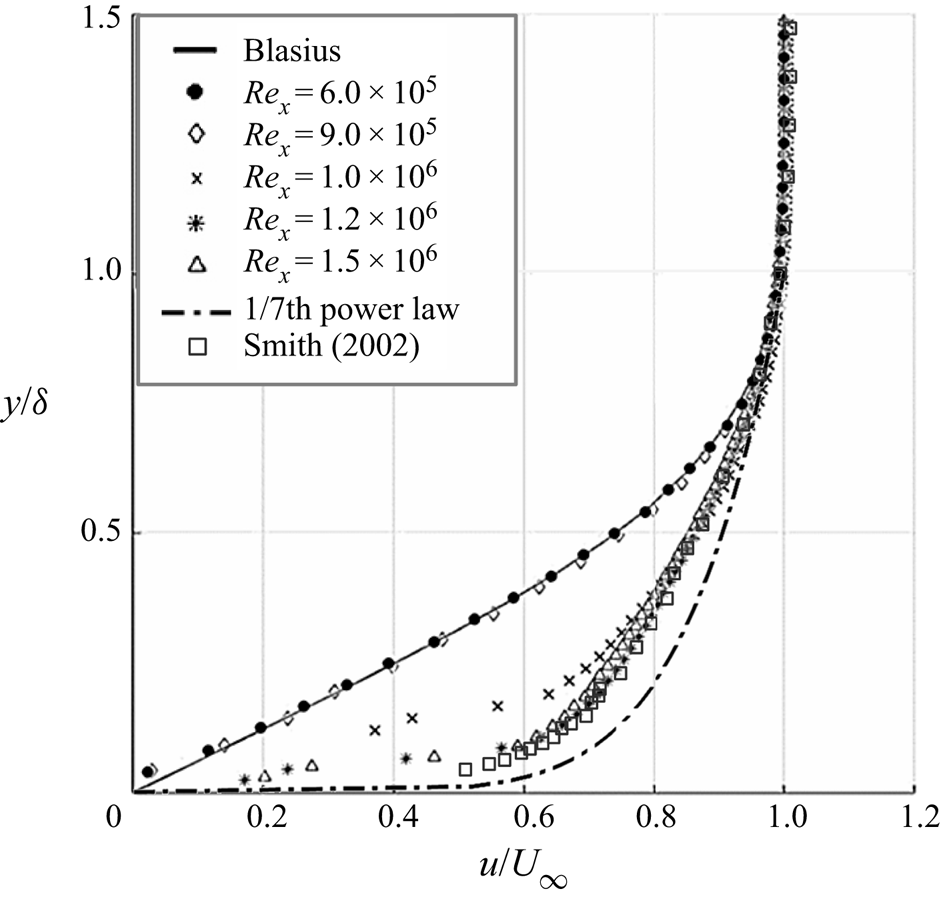
 $6.0 \times 10^{5} \leq Re_{x} \leq 1.5 \times 10^{6}$, which yielded either laminar, transitional or turbulent boundary layer flow conditions, depending on the set Reynolds number and use of a leading edge trip. Measurements of the boundary layer profiles at the location of the pin (when the pin was not present) are provided in figure 2. The boundary layer was measured using a 2-D PIV set-up a priori and then validated with the SPIV set-up at the specified location along the flat plate where all experiments were conducted. The mean velocity profiles include comparisons with the Blasius solution, 1/7th power law, as well as a cross-validation with hot-wire measurements reported by Smith (Reference Smith2002) for a turbulent boundary layer over a flat plate. Free stream velocity, U, is varied from 10 m s-1 to 25 m s-1 to distinguish the laminar, transitional and turbulent boundary layer conditions at a fixed location along the flat plate. The variation of the mean velocity profile over the measurement domain is less than 2 % of
 $U_{\infty }$, which is considered negligible for the present study. Note that the diameter of the pin is fixed throughout the experiments, i.e.
 $D = 12$ mm, corresponding to a range of diameter-based Reynolds numbers in the range
 $8.1 \times 10^{3} \leq Re_{D} \leq 2.0 \times 10^{4}$. As stated, the experiments provided a means to explore the flow sensitivity to the aspect ratio, relative submergence of the pin and state of the incoming boundary layer. This was accomplished by adjusting the pin's vertical height, h, and the free-stream velocity,
 $U_{\infty }$.
Mean streamwise velocity profiles measured at the location of the pin (when the pin is not present) over a range of Reynolds numbers, where the laminar profile (closed black circles) is compared to the Blasius solution (solid black line) and the turbulent profiles (open symbols) are compared with the 1/7th power law (dash-dot line). The open square symbols represent data collected by Smith (Reference Smith2002) to cross-validate with hot-wire measurements collected in a turbulent boundary layer over a flat plate.

2.1. Surface flow visualizations
Surface oil flow visualizations were conducted initially to attain a qualitative evaluation of the dominant flow features and measurement domain of interest. This technique facilitated the identification of separation lines along the surface, indicative of the presence of vortical features surrounding the pin. The oil used in the experiment was a mixture of silicone oil ( $\nu = 20$ cst, where
 $\nu$ is the kinematic viscosity of silicone oil used in the mixture for oil flow visualizations) and petroleum fluorescent tracer (200 : 1). Images were collected in increments of
 ${\rm \Delta} t = 1$ min until a steady state in the oil was achieved. Images of the oil flow (collected once the oil reached steady state) reveal the sensitivity of the vortical flow features to the changing parameters of aspect ratio and relative submergence of the pin within the local boundary layer thickness. Details of the qualitative results are discussed in § 3.1.1 for laminar inflow conditions.
2.2. Stereoscopic particle image velocimetry
Complementary to the qualitative surface flow results, SPIV measurements were employed to quantify the surrounding three-dimensional flow field. The flow was seeded with  $1\ \mathrm {\mu }\textrm {m}$ water-based fog particles, generated by a commercial fog machine (Martin Magnum 850), which was injected into the tunnel upstream of the fan and the flow conditioning section to allow for uniformly distributed seeding at the location of the measurement region of interest. A measure of the flow tracer fidelity was estimated using the Stokes number, which is of the order of
 $10^{-6}$. A particle Stokes number of this order is acceptable for tracing accuracy and sufficient response time to turbulent velocity fluctuations.
Data were acquired in streamwise-oriented (x–y) planes across multiple spanwise locations in increments of  ${\rm \Delta} z =1$ mm, to preserve spatial resolution. All data planes were reconstructed into three-dimensional flow volumes to characterize the relative scale and behaviours of the vortical flow features during post-processing. The SPIV system used is based on a LaVision System, comprised of a double-pulsed 120 mJ Nd:YAG lasers, two
 $1624\times 1236$ pixel resolution thermo-electrically cooled 12-bit Imager CCD cameras and a programmable timing unit. A
 $-50$ mm cylindrical lens, attached to the laser head, was used to create a laser light sheet and was combined with a focal lens to focus the sheet at the centre of the interrogation plane with a sheet waist of
 ${\approx } 1$ mm. Each camera utilized a 200 mm focal length lens equipped with a
 $532\ \textrm {nm}\pm 10\ \textrm {nm}$ band-pass filter with an angular displacement of
 $37^\circ$ between them to accurately resolve all three velocity components.
The cameras and laser were mounted onto their respective three-axis traverse systems, which allowed for translation in all directions (with an accuracy of  $5\ \mathrm {\mu }\textrm {m}$). The measurement domain was determined based on the oil flow visualizations, in the range
 $-30 \leq x \leq 30$ mm, (or
 $-2.5 \leq x/D \leq 2.5$), where
 $x = 0$ is located at the centre of the pin. Note that three separate streamwise data planes were collected over this range and stitched together to achieve higher spatial resolution. The collection of flow field data over smaller measurement areas (with high spatial resolution) was crucial in order to resolve the different vortical scales in the flow. The flow around the pin is also characterized by vortex–surface interactions due to the entrained downwash and proximity to the wall; thus experiencing complex unsteady, three-dimensional behaviours. In order to reconstruct the mean flow, each set of data was comprised of 1000 image pairs, which proved sufficient for statistical convergence. At each streamwise plane, the three velocity components (
 $u$,
 $v$ and
 $w$) were computed using the stereoscopic cross-correlation of successive pairs of images.
The data were acquired and processed using DaVis 8.4 software, at a sampling rate of 14.7 Hz. This acquisition rate was used based on the maximum repetition rate of the laser and sampling rate of the CCD cameras. Moreover, it was purposefully chosen based on its irrelevance to any known frequencies in the flow field. The processing settings used for all cases initially employed a time-series subtraction filter to remove the background averaged from all images, followed by a nonlinear min–max filter for intensity normalization. Images were processed using an advanced multi-pass method with initial and final correlation pass parameters of  $48 \times 48$ pixels and
 $24 \times 24$ pixels with
 $50\,\%$ overlap between interrogation domains. Next, a nonlinear filter for vector post-processing was employed to remove any vector outliers greater than twice the standard deviation (
 ${>}2\sigma$, where
 $\sigma$ refers to the standard deviation of the data sample of measured velocity vectors) of its surrounding neighbours, and iteratively replaced vectors less than three times the standard deviation, (
 ${<}3\sigma$), while a single smoothing pass filter of
 $3 \times 3$ was used. The final operation calculated the vector field statistics to obtain the time-average velocity and root-mean-square fields. A masking function was applied to the flat plate and cylindrical pin surfaces prior to the vector calculations.
The time delay, dt, between successive laser pulses was varied in the range  $4.6\text {--}11.6\ \mathrm {\mu }\textrm {s}$ depending on the tested free-stream velocities, i.e.
 $10 \leq U_{\infty } \leq 25\ \textrm {m}\ \textrm {s}^{-1}$, resulting in a maximum particle displacement of 6 pixels. The pixel scale factor was
 $50.3\ \textrm {pix}\ \textrm {mm}^{-1}$, providing a vector resolution of
 $4.2\ \textrm {vectors}\ \textrm {mm}^{-1}$. The corresponding maximum uncertainty of the in-plane velocity measurements was found to be 1.6 % of
 $U_{\infty }$ based on the standard bias error associated with the cameras’ CCD sensors. The average magnitude of the out-of-plane velocity fluctuations reach a maximum of 3 % and 5 % of
 $U_{\infty }$ for laminar and turbulent cross-flow conditions, respectively. Note that uncertainty quantification for PIV measurements has received significant attention recently (e.g. Christensen & Scarano Reference Christensen and Scarano2015). Standard laboratory PIV systems typically overestimate the fluctuation intensity for unsteady shear flows. Following the derivations in Sciacchitano & Wieneke (Reference Sciacchitano and Wieneke2016), a good estimate for the uncertainty in the Reynolds stress and turbulent kinetic energy (TKE) fields are represented in (2.1)–(2.3). The uncertainty of each Reynolds stress,
 $\zeta _{\overline {u_{i}^{2}u_{i}^{2}}}$, can be expressed as follows:
 \begin{equation} \zeta_{\overline{u_{i}^{\prime}{u_{i}^{\prime}}}}= \overline{u_{i}^{\prime}u_{i}^{\prime}}\sqrt{\frac{2}{N}}, \end{equation}
where N is the number of independent samples. The turbulent kinetic energy is defined as half of the sum of the Reynolds stresses, and based on the error propagation formula, the uncertainty in TKE is defined as follows:
 \begin{equation} \zeta_{TKE}=\frac{1}{2}\sqrt{(\zeta_{\overline{{u'}{u'}}})^{2}+ (\zeta_{\overline{{v'}{v'}}})^{2}+(\zeta_{\overline{{w'}{w'}}})^{2}}. \end{equation}
Assuming that  $N\gg 1$ and the instantaneous measurement uncertainty is negligible with respect to the magnitude of velocity fluctuations, the result of (2.2) can be used and the expression for
 $\zeta _{TKE}$ is reduced to
 \begin{equation} \zeta_{TKE}=\frac{1}{2N}\sqrt{(\overline{u'})^{2}+(\overline{v'})^{2}+(\overline{w'})^{2}}. \end{equation}
Based on these derivations, the uncertainty of TKE for the laminar and turbulent cross-flow cases is less than  $6\,\%$ and
 $10\,\%$ of their TKE value, respectively.
3. Results and discussion
The flow physics and vortical structures associated with the interaction of a cantilevered, finite-span pin with a flow over a flat plate are strongly dependent on the aspect ratio, state of the incoming boundary layer and the height of the cylinder relative to the local boundary layer thickness (Sumner Reference Sumner2013). Recent developments in experimental studies have provided helpful insight into the physical understanding of the near wake flow patterns, although the level of interplay between the dynamics in the flow over the pin's free end and the near wake is not as readily understood. This assertion led the campaign for the parametric experiments conducted and discussed in the proceeding.
A detailed parametric study is discussed to investigate the sensitivity of the flow field to the pin's aspect ratio and relative submergence as the pin encounters a laminar or turbulent cross-flow over a flat plate (i.e.  $Re_{x} = 6 \times 10^{5}$ and
 $Re_{x} = 1.5 \times 10^{6}$, respectively). The measurement domain of interest focused on the development and interaction of dominant vortical flow features associated with the approaching flow (i.e. upstream of the pin), the flow field over the pin's free end and in the near wake of the pin, represented in the SPIV measurement planes labelled 1, 2 and 3, respectively (figure 1a).
The wake is characterized by complex vortical structures, including the horseshoe vortex system, 3-D separation over the top, tip and trailing vortices, as well as an arch vortex, most notably present for a cylinder below the sub-critical aspect ratio. The study was conducted for a cylindrical pin with a fixed diameter,  $D = 12$ mm, where the pin's height and the free-stream velocity were varied to examine the flow sensitivity to the pin's aspect ratio and relative submergence when both are
 $O(1)$. For the laminar boundary layer conditions, aspect ratio and relative submergence were tested for
 $0.25 \leq AR_{p} \leq 0.75$ and
 $0.5 \leq h/\delta \leq 1.5$, respectively. In addition, the corresponding experiments conducted in the presence of a turbulent boundary layer were tested for
 $0.5 \leq AR_{p} \leq 1$ and
 $0.5 \leq h/\delta \leq 1$. Details of the parametric test matrix are provided in table 1.
Table of the main test parameters under investigation in the present study.

3.1. Interactions with a laminar boundary layer
3.1.1. Surface flow visualizations
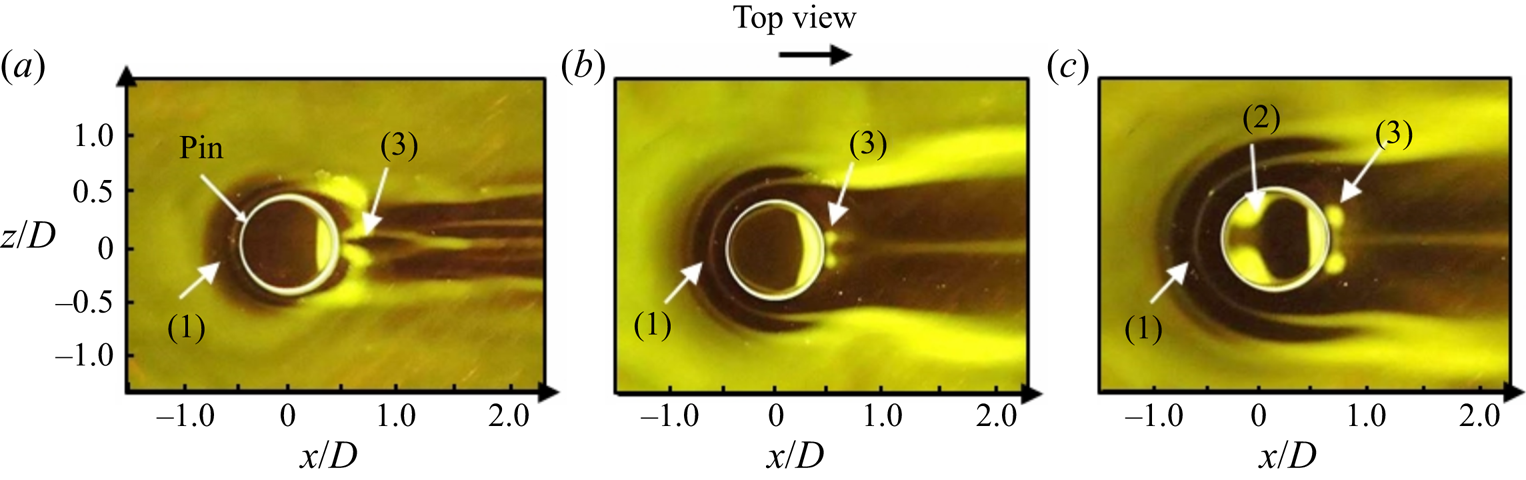
As stated, initial surface flow visualizations were conducted over the low aspect ratio pin immersed in a laminar cross-flow to identify the separation lines, and thus, the presence of vortical flow features near the surface. Figure 3 reveals the steady-state images associated with each tested pin, where figure 3(a) shows the case where  $AR_{p} = 0.25$ and
 $h/\delta = 0.5$, figure 3(b) represents the case where
 $AR_{p} = 0.5, h/\delta = 1$ and figure 3(c) corresponds to the case where
 $AR_{p} = 0.75, h/\delta = 1.5$. Note that these images reveal a top view perspective and the flat plate was placed in the upright position for the purposes of this study. The dark and light areas are associated with regions of high and low shear stress, respectively.
Top view images of steady-state surface oil flow visualizations for varied geometric conditions, (a)  $AR_{p} = 0.25$,
 $h/\delta = 0.5$, (b)
 $AR_{p} = 0.5$,
 $h/\delta = 1$ and (c)
 $AR_{p} = 0.75$,
 $h/\delta = 1.5$. The numerical annotations included in each image represent the following: (1) high shear stress region associated with the roll-up of the horseshoe vortex system upstream of the pin, (2) cellular mushroom-type vortex over the pin's free end and (3) accumulated pockets of oil in the wake due to the recirculating arch vortex. In all cases,
 $Re_{D} = 8.1 \times 10^{3}$ and
 $Re_{\delta } = 4.05 \times 10^{3}$.

Three primary vortical flow features are discussed herein. The first feature is represented by the separation lines upstream of the pin, known as the horseshoe vortex (HV). These result from the spanwise vorticity,  $\Omega _z$, associated with the approaching laminar boundary layer, which is caused to separate under the local adverse pressure gradient. Subsequently, the boundary layer rolls up and around the base of the pin to form a system of counter-rotating, streamwise-oriented vortices. The second vortical flow feature is a resultant of the characteristic three-dimensional separation over the pin's free end, denoted by the outlined circumferential edge (in white). The three-dimensional separation bubble imposes a cellular ‘mushroom-type’ or ‘tornado-like’ vortex (Roh & Park Reference Roh and Park2003), which will be discussed in further detail in § 3.1.2. The variation in separation behaviours as a function of
 $AR_{p}$ and
 $h/\delta$ is predominantly dictated by the variation in the shear strength of the incoming flow over the pin. As the pin becomes less submerged within the boundary layer, (i.e.
 $h/\delta$ and
 $AR_{p}$ both increase), the free end is exposed to higher momentum flow, producing a larger magnitude of shear over the top, with a more defined mean reattachment line, as observed in figure 3(c). The third vortical feature of interest is observed in the pin's near wake, where the pattern of accumulated oil is suggestive of the presence of the base ‘legs’ of the arch vortex.
Based on the observations from figure 3, it is understood that as the height of the pin is increased (as is  $AR_{p}$), the location of boundary layer separation moves upstream due to the increased local adverse pressure gradient (i.e. increased blockage). Moreover, in accordance with previous work by Sumner (Reference Sumner2013), the size of the separation bubble and location of reattachment are pushed towards the circumferential trailing edge as the pin's height aspect ratio increases. Under the present test conditions, the effects of aspect ratio and relative submergence are varied concurrently, both contributing to the nature of the three-dimensional separation over the pin's free end.
For figure 3(a), the pin is deeply submerged within the laminar boundary layer; thus, the separation bubble is small and the reattachment point occurs very close to the circumferential leading edge. This can be inferred from the lack of oil present over the majority of the free end surface, representative of the high shear associated with attached flow.
Although similar behaviour is observed in figure 3(b), it is believed that the oil does not track exactly with the flow, and therefore does not accurately depict the mean flow details for the case of  $h/\delta =1$ (
 $AR_{p}=0.25$) due to relatively weak shear. This claim is offered based on the SPIV results, discussed in § 3.1.2, which demonstrate a three-dimensional vortex over the pin's free end. However, this vortical flow feature is likely too weak to be revealed by the oil mixture used in these experiments.
In contrast, figure 3(c) reveals a distinctive cellular vortex pattern over the pin's free end as the height is increased to  $h/\delta = 1.5$. This is a result of increased shear and separation angle as the outer flow encounters the tip of the pin, demonstrating more distinctive separation lines over the free end. The cellular separation lines delineate the mushroom-type vortex, which has been observed in previous studies of finite-span cylinders (Roh & Park Reference Roh and Park2003). Note that in all cases shown here, there is a thin layer of accumulated oil along the circumferential trailing edge of the pin as a result of the surface tension between the oil and the pin's top surface. In the near wake, there are two pockets of accumulated oil near the pin's base, accompanied by a separation line along the centre, revealing a symmetric wake structure. As will be discussed in § 3.1.2, the regions of accumulated oil are associated with the ‘legs’ of the mean arch vortex, which pulls fluid from the outer flow in towards the centre wake. The relative size of the arch vortex scales with
 $AR_{p}$ (and
 $h/\delta$), as shown by the increased accumulation of oil and spanwise spread. The arch vortex induces a large spanwise flow and downwash velocity in the near wake. Accordingly, the higher momentum flow in the centre induces the formation of two counter-rotating trailing vortices, resulting in a separation line along the symmetry plane.
An inextricable link exists between the flow behaviour over the pin's free end and in the near wake. The relationship between these vortical flow features is defined in terms of the nature of the 3-D separation bubble, the width of the wake and the structure of the recirculation region (i.e. symmetric arch vortex). Although this observation is initially qualitative, these surface flow patterns allowed for an initial assessment of the sensitivity of the vortex dynamics to the geometric parameters under investigation. The assertion regarding the interplay of vortex dynamics between the pin's free end flow and the near wake is quantitatively supported from SPIV measurements discussed herein.
3.1.2. Three-dimensional flow field measurements using SPIV
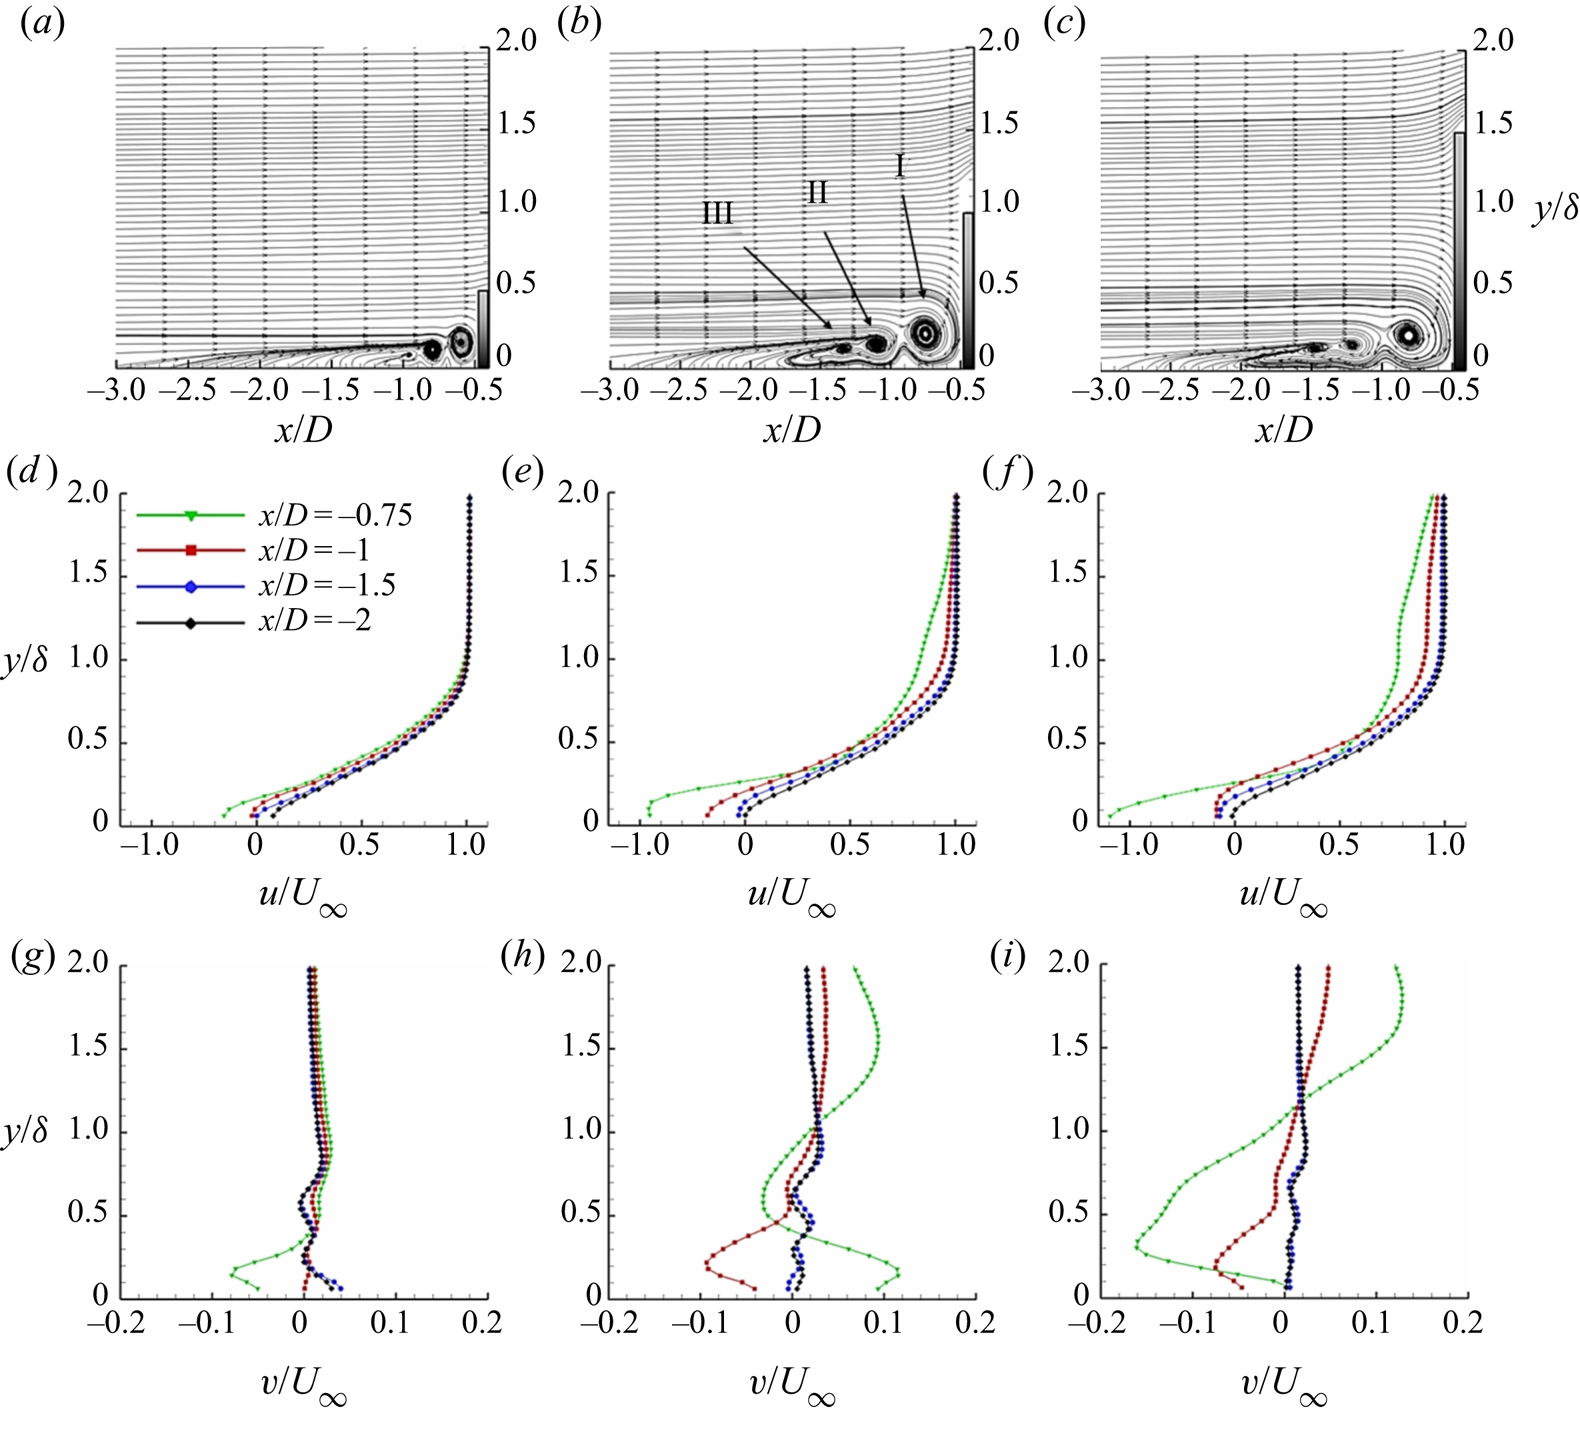
In order to properly resolve the size and scale of the constituent vortical flow features, the region of interest was sub-divided into three planes: (i) upstream of the pin, to capture the approaching flow, (ii) over the pin's free end and (iii) the near wake region. Initially, the vortex dynamics is discussed for laminar boundary layer conditions (i.e.  $Re_{x} = 6 \times 10^{5}, \delta = 6$ mm). The upstream flow is quantified along the symmetry plane and shown in figure 4 for each case as a function of the
 $AR_{p}$ and
 $h/\delta$. Here, streamlines of the mean flow are presented for each case in figures 4(a)–4(c), respectively. Corresponding time-averaged streamwise (figures 4d–4f) and wall-normal (figures 4g–4i) velocity profiles are provided at several streamwise locations to further characterize the formation, size, and locations of influence of the HV system. It is noted that, for all cases, the pin's aspect ratio is considered very small, i.e.
 $AR_{p} < 1$, with a constant diameter-based Reynolds number. There are several important dimensionless parameters that characterize the class of the HV system, including the streamwise distance from the centre of the pin to the primary vortex core,
 $x_{v}/D$, the distance to the point of upstream boundary layer separation,
 $x_{s}/D$, and in some cases the regular oscillatory behaviour,
 $St$. Some of these parameters are referred to herein as a means to evaluate the physical mechanisms associated with the characteristic changes to the HV system.
Time-averaged streamlines along the centreline plane upstream of the pin for: (a)  $AR_{p} = 0.25$,
 $h/\delta = 0.5$, (b)
 $AR_{p} = 0.5$,
 $h/\delta = 1$ and (c)
 $AR_{p} = 0.75$,
 $h/\delta = 1.5$. Note that a small portion of the windward side of the pin is included in each plot. The corresponding time-averaged streamwise and wall-normal velocity profiles for several streamwise positions are provided in (d–f) and (g–i), respectively.
 $Re_{D} = 8.1 \times 10^{3}$.

As can be observed from the time-averaged streamlines (figures 4a–4c), the area of influence of the formation of the system of vortices extends farther upstream and away from the wall as the pin's relative height is increased. This is a direct consequence of the increased local adverse pressure gradient (i.e. increased blockage), which coincides with the point of boundary layer separation being pushed upstream. This earlier onset of boundary layer separation induces spatial growth of the HV system by diffusion. Although the inception and spatial extent of the HV system vary from case to case, the classification of the vortical flow regime is dependent upon  $Re_{D}$ and
 $D/\delta$, which both remain fixed here. As was proposed by Baker (Reference Baker1979), the need for the velocity gradients to be continuous implies the presence of mirrored vortices, which are counter-rotational to the three dominant clockwise rotating vortices observed in the streamline plots. Under this assumption, the HV systems presently studied are categorized as a ‘regime 5’ vortex flow with a total of six vortices. Note that due to limited spatial resolution of the SPIV measurements near the wall, the mirrored, counter-rotating vortices, which are much smaller (i.e.
 ${<}1$ mm) are not captured. It is understood that for finite-span cylinders, the number of vortices comprised in the laminar HV system will increase as a function of
 $Re_{D}$ and
 $D/\delta$, and experiences unsteady behaviours beyond a critical threshold. As mentioned, both parameters are fixed in these experiments and thus, the HV system consists of the same number of vortices.
The corresponding streamwise velocity profiles are provided in figures 4(d)–4(f) at several streamwise locations to distinguish the origins and development of the vortical system in the range  $-2 \leq x/D \leq -0.75$. Note that the front face of the pin is located at
 $x/D = -0.5$. For the shortest pin,
 $h/\delta = 0.5$ (
 $AR_{p} = 0.25$, figure 4d), the velocity profiles farthest upstream,
 $x/D = -2$ (diamonds), reveal a small influence of the presence of the pin. As distance from the pin is reduced, the adverse pressure gradient overcomes the inertial forces, inducing boundary layer separation, defined at
 $x_{s}/D \approx -1.5$. At locations closer to the pin, i.e.
 $x/D \geq -1$, the profiles reveal reverse flow near the wall due to the presence of the HV (see figure 4a). The mean position of the primary HV (noted as I) is located at
 $x_{v}/D \approx -0.6$,
 $y/D \approx 0.1$. The mean secondary and tertiary vortices (i.e. II and III, respectively) are fed from the vorticity of the primary vortex and remain closer to the wall. This is due to the induced velocity, which entrains the fluid downward. The time-averaged positions of the secondary and tertiary vortices are located at
 $x_{v}/D \approx -0.8$,
 $y/D \approx 0.08$ and
 $x_{v}/D \approx -0.96$,
 $y/D \approx 0.07$, respectively.
As the relative height of the pin is increased,  $h/\delta = 1$ (
 $AR_{p} = 0.5$, figure 4e), there is an upstream shift in the location of boundary layer separation and the position of the mean primary HV core, as anticipated. Boundary layer separation occurs approximately 25 %–30 % further upstream, i.e.
 $x_{s}/D \approx -1.95$, and the position of the primary HV core is shifted to
 $x_{v}/D \approx -0.75$,
 $y/D \approx 0.13$, respectively. Accordingly, the positions of the secondary and tertiary vortices are shifted to
 $x_{v}/D \approx -1.1$,
 $y/D \approx 0.1$ and
 $x_{v}/D \approx -1.34$,
 $y/D \approx 0.088$, respectively. These positions are lifted from the surface by approximately 25 %–30 %, relative to the case for
 $h/\delta = 0.5$. This is clearly observed by the increased momentum deficit, which is present up to a wall-normal distance of
 $y/\delta \approx 1.75$.
As expected, when the pin's height is further increased to  $h/\delta = 1.5$ (
 $AR_{p} = 0.75$, figure 4f), the momentum deficit is increased, influencing the flow farther upstream. At the most upstream position shown, the boundary layer has already separated, and was determined to be
 $x_{s}/D \approx -2.13$ (i.e. 9 % farther upstream than the previous case). Consequently, the average positions of each of the vortex cores are located farther upstream, where the primary vortex core is located at
 $x_{v}/D \approx -0.81$,
 $y/D \approx 0.14$. The secondary and tertiary vortices are located at
 $x_{v}/D \approx -1.2$,
 $y/D \approx 0.1$ and
 $x_{v}/D \approx -1.5$,
 $y/D \approx 0.094$, respectively. As stated, the system of vortices is uniformly shifted farther upstream from the pin as a function of the pin's increasing height (i.e. both
 $AR_{p}$ and
 $h/\delta$ increase), synonymous with an increased local adverse pressure gradient, which promotes earlier boundary layer separation and onset of the HV system.
The corresponding time-averaged, wall-normal velocity profiles are shown in figures 4(g)–4(i). In a similar fashion, as the distance from the pin is reduced, the influence from the vortical structures becomes more prominent. Likewise, this trend is also observed as a function of increased  $h/\delta$ (and
 $AR_{p}$). For the smallest pin (figure 4g), the location measured nearest to the body is in between the primary and secondary vortices, thus revealing downwash associated with a portion of the secondary vortex as it encounters the wall. Farther from the pin, the mean profiles reveal reduced impact from the HV system. As the pin's height is increased, the influence of the HV is felt farther upstream, demonstrated by the increased magnitude of the undulations in the profiles, specifically for
 $x/D \geq -1$ (figure 4i). Moreover, at
 $x/D = -0.75$ (inverted triangles), the locations of inflection in
 $v/U_{\infty }$ demonstrate the spatial growth of the vortices as that point moves farther from the wall with increased pin height (i.e. increased
 $h/\delta$ and
 $AR_{p}$).
The three-dimensional flow field characteristics inherent to this configuration are explored in further details at the SPIV window 2 location (see figure 1). Here, the field of view captures the mean flow features over the pin's free end and the near wake. Within this region, a pair of counter-rotating streamwise vortices develop near the free end as a result of the interaction between upward-directed separated flow around the sides of the cylinder and the downward-directed flow over the top. This behaviour induces counter-rotating vortices, which roll over the top edges, forming the tip vortices (e.g. Kawamura et al. Reference Kawamura, Hiwada, Hibino, Mabuchi and Kumada1984). As the tip vortices extend in the streamwise direction, they induce a downwash along the wake centreline and evolve into the trailing vortex pair. These secondary interactions are thought to be the mechanism by which the trailing vortex pair is formed and evolve into a quasi-steady, counter-rotating pair near the wall along the outside of the pin's wake. The tip vortices are thought to be relatively short-lived structures with an extension length near  $x/D \leq 2$ (e.g. Zhu et al. Reference Zhu, Wang, Wang and Wang2017), which extends to the end of the measurement domain in the present work. Although there is some discrepancy on the exact definition of the tip and trailing vortical flow features, the authors believe these distinctive features to be mutually inclusive for wall-mounted short aspect ratio cylinders. Each of these features and the mechanisms of their formation and evolution are discussed herein.
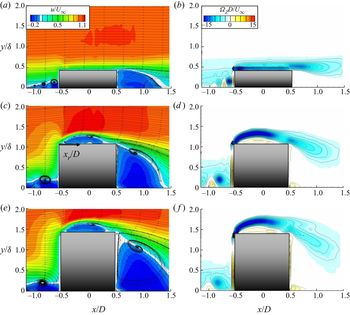
The mean flow fields of streamwise velocity and corresponding spanwise vorticity,  $\Omega _{z}D/U_{\infty }$, are presented along the pin's symmetry plane in figure 5 to emphasize the characteristics of the separation bubble, wake recirculation and separating shear layer. As observed in figures 5(a) and 5(d), the effect from the presence of the pin on the outer free-stream flow is very small due to its full submergence within the boundary layer. Accordingly, a very small separation bubble is formed over the free end. Due to the nature of the interaction between the incoming cross-flow with the pin's sharp leading edge, the flow must experience a small separation bubble near the leading edge; however, it is not captured with the current measurement resolution. However, the small separation may be inferred from the contours of spanwise vorticity. Figure 5(d) reveals the largest magnitude of negative spanwise vorticity near the leading edge, suggesting high shear and the presence of a small separation bubble, which reattaches near
 $x_{r} = 0.16D$. Note that
 $x_{r}$ originates at the pin's circumferential leading edge and refers to the reattachment point over the top, as defined by the location at which the streamwise velocity changes sign. The concentration of spanwise vorticity near the top surface of the pin further suggests that the flow remains attached for the majority of the surface. As such, the flow experiences a very shallow angle of separation from the pin's trailing edge, and reattaches in the wake near
 $x/D = 1.34$.
(a–c) Colour contours of time-averaged streamwise velocity,  $u/U_{\infty }$, along the centreline plane, superimposed with in-plane streamlines, and (d–f) corresponding contours of spanwise vorticity,
 $\Omega _{z}D/U_{\infty }$. Each row represents a given geometric test case, such that (a,d)
 $AR_{p} = 0.25$,
 $h/\delta = 0.5$; (b,e)
 $AR_{p} = 0.5$,
 $h/\delta = 1$; (c,f)
 $AR_{p} = 0.75$,
 $h/\delta = 1.5$.
 $Re_{D} = 8.1 \times 10^{3}$.

As the pin's relative height is increased, the separation bubble grows significantly. In the case for  $h/\delta =1$ (figures 5b and 5e), a recirculation zone extends from the leading edge to
 $x_{r} = 0.81D$. Whereas, for
 $h/\delta = 1.5$ (figures 5c and 5f), the mean separation bubble reattaches near
 $x_{r} = 0.87D$. The increased size of the separation bubble and steeper angle of flow separation from the trailing edge of the pin are a result of increased exposure of the pin to higher momentum flow. As the height of the pin extends beyond the local boundary layer thickness, the magnitude of upward-directed flow, tangential to the pin's front face and around the sides, increases. These behaviours will be further corroborated in figure 7.
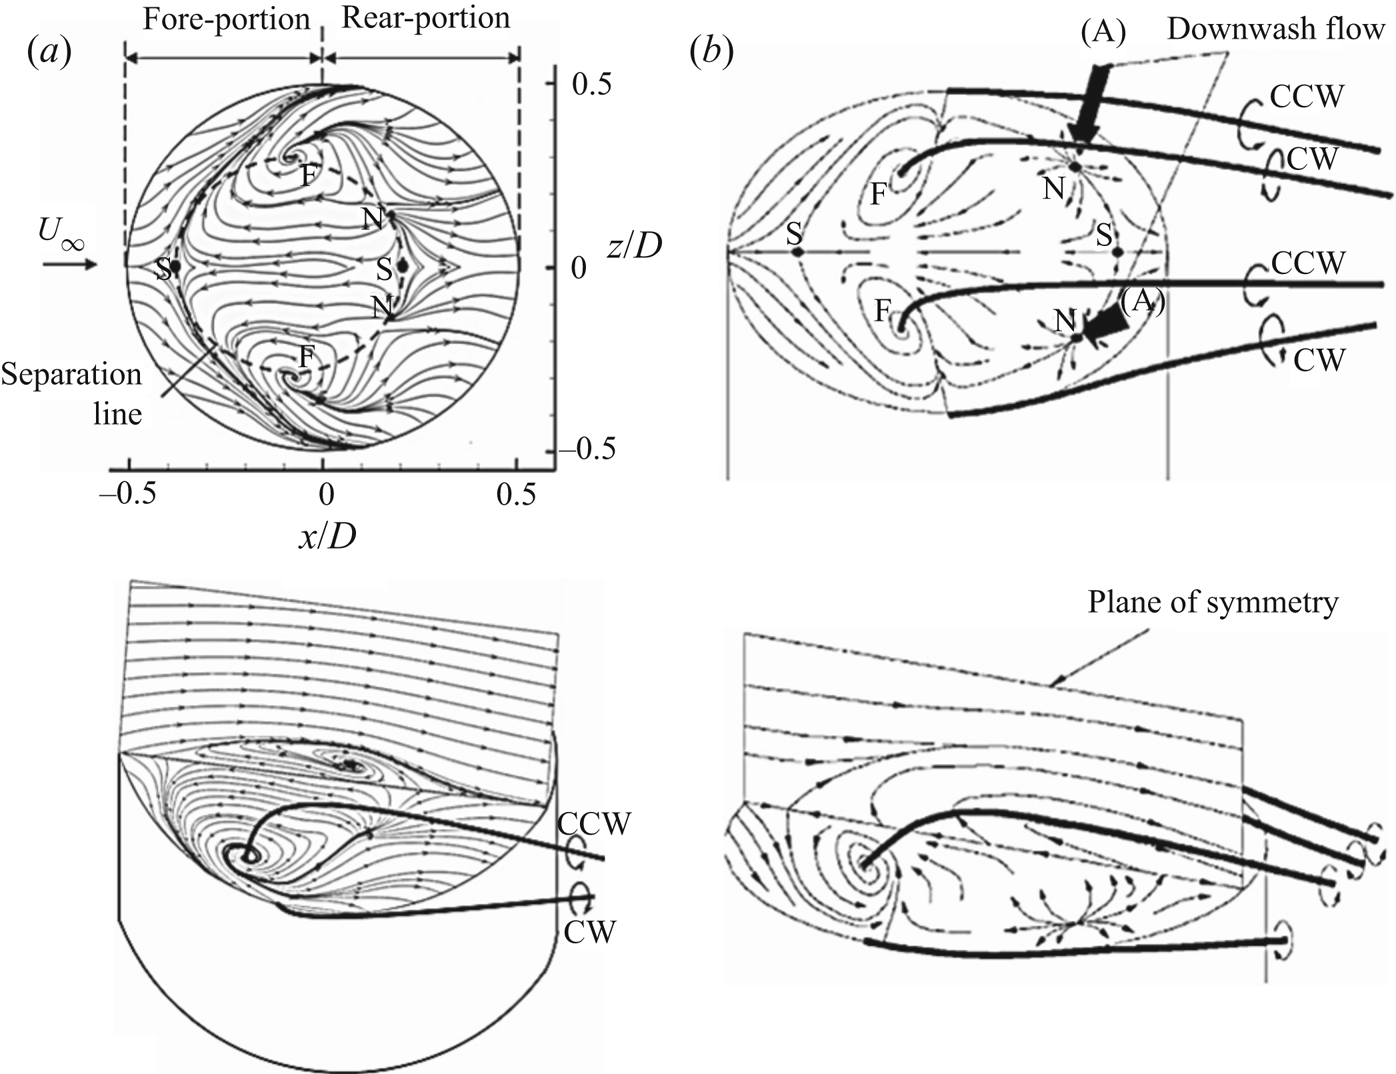
The three-dimensional flow over the free end surface has been shown to be an integral element in the determination of near wake behaviour for a finite-span pin. A general overview of the local flow characteristics over the free end (using quantitative measurements from the present study) is presented in figure 6(a) and compared with qualitative work by Roh & Park (Reference Roh and Park2001, Reference Roh and Park2003) in figure 6(b). The referenced work conducted flow visualizations over a finite-span cylinder with an aspect ratio of 1.25 for a similar Reynolds number. The top image in figure 6(a) represents an orthogonal view of the streamlines measured just above the free surface, at  ${\rm \Delta} y = 0.01D$, for the case of
 $AR_{p} = 0.5$ (and
 $h/\delta = 1$). It is important to note that the influence of the local boundary layer was considered negligible in the referenced work (figure 6b), i.e.
 $h/\delta \approx 20$, and thus, some differences may be attributed to the coupled nature of
 $AR_{p}$ and
 $h/\delta$, which are both
 $O(1)$ in the present study.
Local flow field surface topology shown for (a) measured time-averaged streamlines above the free end surface for the present case of  $AR_{p} = 0.5$,
 $(h/\delta = 1)$ and
 $Re_{D} = 8.1 \times 10^{3}$, compared with (b) qualitative experimental results from Roh & Park (Reference Roh and Park2001, Reference Roh and Park2003) where
 $AR_{p} = 1.25, (h/\delta \approx 20)$ and
 $Re_{D} = 5.92 \times 10^{3}$ and
 $1.48 \times 10^{5}$. The label (A) indicates the location of the nodes. F: focus point; S: saddle point; N: node; CW: clockwise rotation; CCW: counterclockwise rotation.

The free end flow is topologically characterized by the presence of two foci, F, in the fore half-portion associated with the cellular mushroom-type vortex (also referred to as ‘eye-like spots’ in Roh & Park (Reference Roh and Park2001, Reference Roh and Park2003)) and two nodes, N, in the rear half from which the two tip vortices originate and subsequently enter the wake. The dashed line along the inner circumference is representative of the separation line, from which two saddle points exist (S) along the symmetry plane, one at the point of separation and the other at reattachment, respectively. A corresponding isometric view of the data collected in the present study is also provided in the bottom of figure 6(a), which includes the vertical symmetry plane above the pin to compare the experimental results to the referenced articles (figure 6b).
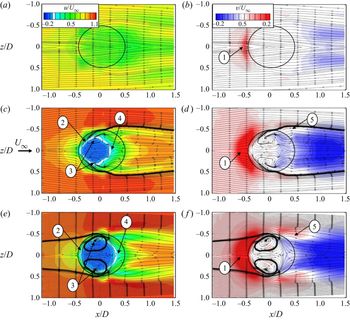
The discussion of the three-dimensional flow physics associated with the free surface is further elaborated with a comparison between each tested pin in figure 7. The flow fields are presented at a horizontal (x–z) plane, offset from the surface by  ${\rm \Delta} y = 0.01D$ (or
 $0.02\delta$) for each case. Here, the mean streamwise and wall-normal velocity fields are compared. As stated previously, for
 $h/\delta =0.5$ (
 $AR_{p} = 0.25$, figures 7a and 7d), the resolution in the measurements is insufficient to capture a distinctive separation near the free surface. Since the pin is fully submerged in the boundary layer, it experiences more downward directed flow due to the associated spanwise vorticity, such that any upwash flow deflected over the top of the pin is of relatively low magnitude, as shown just upstream of the pin's leading edge (figure 7b). Although not observed here, this results in a very small separation bubble. The location of the separation bubble may be speculated from the slight acceleration (seen from the colour contours) just downstream of the leading edge, followed by a decelerated streamwise velocity over the majority of the surface. Consequently, the first 10 % of the pin's span,
 $-0.5 \leq x/D \leq -0.4$, corresponds to a very small magnitude of upwash. This region of slight upwash is indicative of the upward deflected flow over the small-scale laminar separation bubble. Furthermore, the presence of the tip vortices may be inferred from the behaviour along the outside edges of the pin (
 $|z/D| = 0.5$) near the centre span. Here, there is streamline convergence, suggesting an acceleration of the flow as it rolls over the top edges of the pin. Moreover, there are streak patterns of acceleration, coupled with a small region of decelerated flow, which extend longitudinally along the outer edges of the wake. This behaviour is suggestive of the presence of streamwise tip vortices. Consequently, two concentrations of downwash are observed in the wake, figure 7(d), providing further evidence of the induced downwash resulting from the tip vortices. The combined downwash in the mean flow, and mutual inductance of downwash from the tip vortices cause the tip vortices to impinge onto the wall in the near wake. The secondary vorticity generated near the wall ultimately leads to the formation of the trailing vortex pair farther downstream.
Top view of time-averaged (a–c) streamwise,  $u/U_{\infty }$, and (d–f) wall-normal velocity,
 $v/U_{\infty }$, at a vertical position of
 ${\rm \Delta} y/D = 0.01$ above the free end surface. Each row represents a given geometric case, such that (a,d)
 $AR_{p} = 0.25$,
 $h/\delta = 0.5$; (b,e)
 $AR_{p} = 0.5$,
 $h/\delta = 1$; (c,f)
 $AR_{p} = 0.75$,
 $h/\delta = 1.5$. For all cases,
 $Re_{x} = 6 \times 10^{5}$ and
 $Re_{D} = 8.1 \times 10^{3}$. The numerical annotations represent several flow features: (1) concentration of upwash flow as incoming flow interacts with the front face of the pin and is directed upward and over the top, (2) separation line associated with the free end separation bubble, (3) cellular mushroom-type vortex foci, (4) reattachment point over the pin's free end and (5) region of opposing signs of wall-normal velocity associated with the roll-up of the tip vortices which extend into the wake.

As the pin's height is increased, the separated flow over the top of the pin becomes more prominent, as outlined by the white separation line in figures 7(b) and 7(c). For this coupled change in  $h/\delta$ and
 $AR_{p}$, the free end is characterized by a cellular mushroom-type vortex having symmetric counter-rotating foci with rotational sense in towards the centre of the separation bubble. The foci are located just upstream of the pin's centreline at
 $x/D \approx -0.08$ and
 $|z/D| \approx 0.3$ and
 $0.34$ for
 $h/\delta =1$ and
 $1.5$, respectively. The locations of the foci are very similar, but the size and strength of the mushroom vortex scales relative to the increased pin height. Thus, as the pin height increases to
 $h/\delta =1.5$ (
 $AR_{p}=0.75)$, the magnitude and extent of reverse flow is increased, accompanied by stronger shear in the separating vortex sheet over the bubble.
As mentioned previously, the presence of two additional vortical flow features may be inferred from these measurements: the streamwise tip and trailing vortex pairs. This is most clearly observed for the cases where  $h/\delta =1$ and 1.5, (figures 7b and 7c, respectively), by the regions of streamwise velocity deficit in the wake, which emanate from the sides near
 $|z/D| \approx 0.5$. In accordance with this, the wall-normal velocity fields reveal an upwash along the outside edges of the rear portion, accompanied by strong downwash in the central wake. Note that the downwash shown over the top of the pin in the aft portion represents the reattachment and subsequent generation of the tip vortices at
 $x/D \approx 0.14$ and
 $0.18$ (figures 7e and 7f, respectively). As the tip vortices extend into the wake and merge with the recirculation region (i.e. arch vortex), the combined actions of these vortical structures induce a stronger downwash flow in the centre wake, entraining higher momentum outer flow towards the wall. The competing spanwise and axial vorticity components associated with the arch and tip vortices initiate the secondary interactions, which lead to the development of the trailing vortex pair. Further description of the formation of these vortical features is discussed in figure 9.
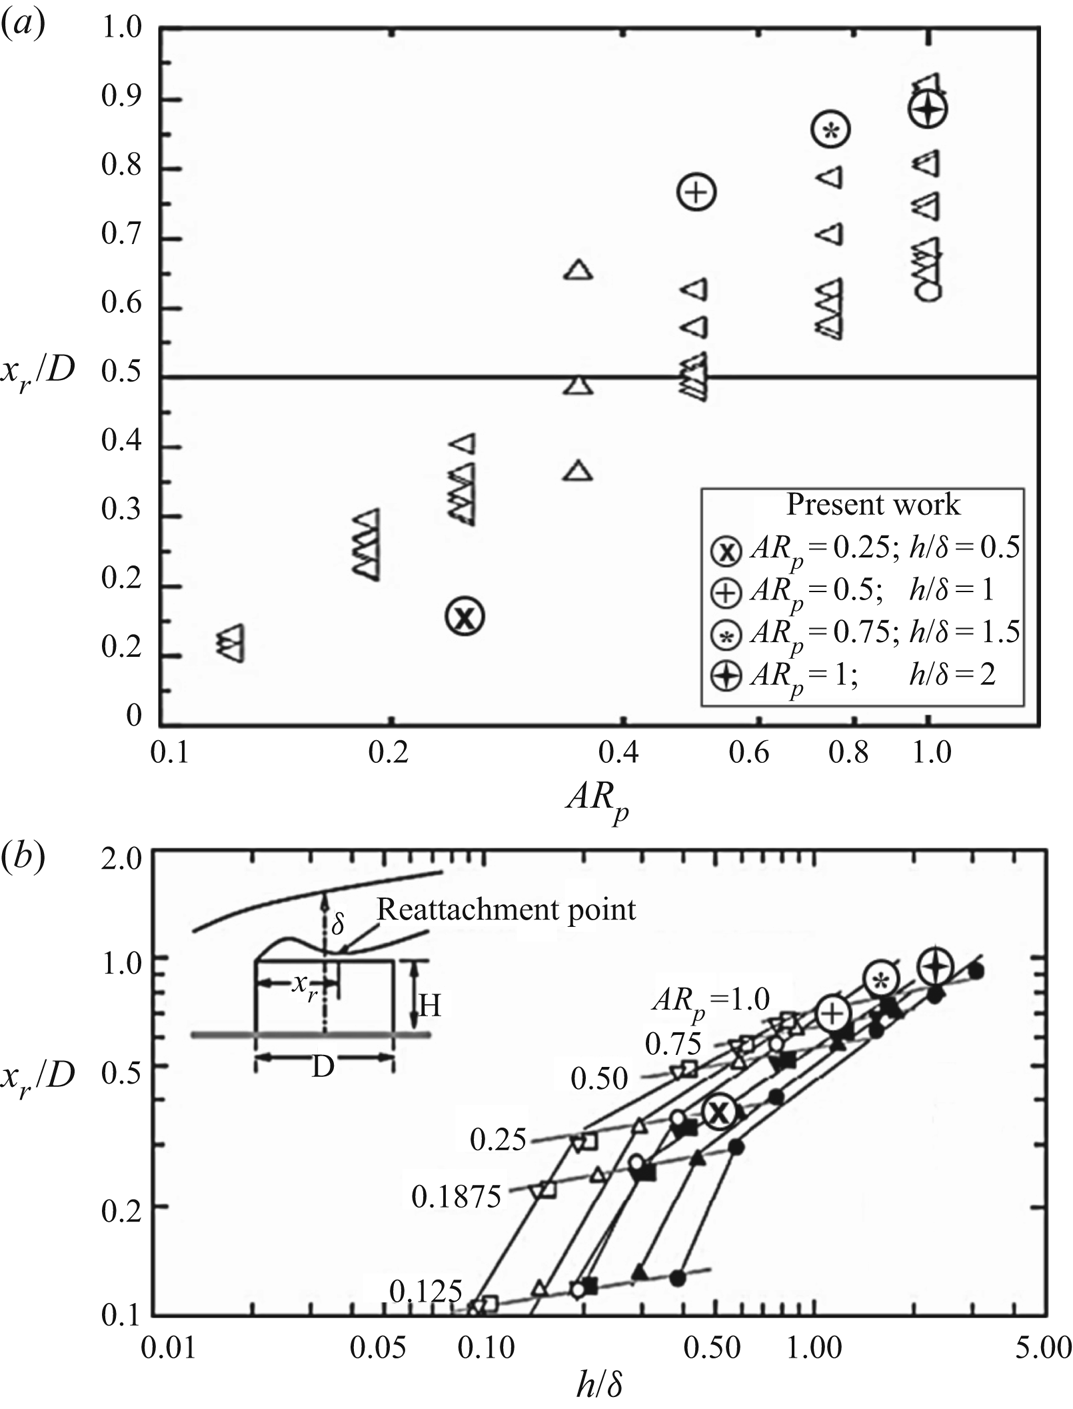
Based on the inter-dependent nature of the vortical features over the pin's free end and those in the wake, the characteristics of the separation bubble are explored as a function of the concurrent changes in aspect ratio and relative submergence within the boundary layer. Figures 8(a) and 8(b) present the locations of reattachment for each case, plotted against a broad spectrum of related work as a function of  $AR_{p}$ and
 $h/\delta$, respectively. The comparison provided in figure 8(a) reveals variations in reattachment as a function of aspect ratio from the review by Sumner (Reference Sumner2013), where the data from the present study have been superimposed and are shown by the circled symbols. Likewise, figure 8(b) demonstrates the variation in reattachment location as a function of
 $h/\delta$ from the work of Tsutsui & Kawahara (Reference Tsutsui and Kawahara2006). This parametric study was conducted in laminar conditions for aspect ratios of
 $AR_{p} = 0.25$, 0.5, 0.75 and 1, which corresponded to
 $h/\delta = 0.5$, 1, 1.5 and 2, respectively.
(a) Locations of the reattachment saddle point on the centreline of the free end surface for finite-span cylinders as reviewed by Sumner (Reference Sumner2013), compared with data from the present work (circled symbols). All data presented here were collected within a range of  $10^{3} \leq Re_{D} \leq 10^{5}$. (b) Variation in the reattachment location as reviewed by Tsutsui & Kawahara (Reference Tsutsui and Kawahara2006) for turbulent boundary layer conditions, i.e.
 $1.1 \times 10^{4} \leq Re_{D} \leq 1.1 \times 10^{5}$, compared with data from the present work in laminar boundary layer conditions, i.e.
 $Re_{D} = 8.1 \times 10^{3}$.

From figure 8(a), a discerning relationship between the aspect ratio and location of reattachment can be identified. As the aspect ratio is increased, the reattachment point moves downstream. The data from the present study follow a similar trend to previous researchers, although it is important to note that the parameters of  $Re_{D}$ and
 $h/\delta$ are not matched. In particular, the reattachment point for the
 $AR_{p} = 0.25$ (
 $h/\delta =0.5$) is presumably much closer to the circumferential leading edge than has been proposed in previous work. This is likely because in the present case the pin is fully submerged within the boundary layer, resulting in a much smaller region of separated flow and subsequently, an earlier reattachment. The reattachment point identified from the present study occurs slightly farther downstream than those found in previous work. It is important to note that most of the data provided by previous research were collected for low aspect ratio cylinders as they interacted with a tripped or fully turbulent boundary layer flow, and thus, the reattachment point is expected to occur earlier, relative to laminar flow conditions.
To examine the effect of the pin's relative submergence on the reattachment behaviour, the present data were compared with the qualitative oil flow visualization work from Tsutsui & Kawahara (Reference Tsutsui and Kawahara2006) in figure 8(b). They explored the variation in flow reattachment for a similar range of parameters, i.e.  $AR_{p} \leq 1$ and
 $h/\delta \approx O(1)$, although the study was conducted with a turbulent boundary layer. The quantitative data from the present work are designated by circled symbols (figure 8b) and superimposed onto the qualitative results from Tsutsui & Kawahara (Reference Tsutsui and Kawahara2006). Note that the variation in the reattachment locations is a function of the Reynolds number, as that is the only variable between the compared data sets. Similar to the trend shown in figure 8(a), the locations of flow reattachment are in good agreement with that shown from the literature, although they are uniformly shifted slightly farther downstream as a result of the difference in boundary layer regime. Based on the similarities between the data sets, it may be speculated that the weighted contribution from the pin's aspect ratio may be greater than the effect of Reynolds number, and effectively, the parameter of
 $h/\delta$. This claim will be examined in § 3.2 to explore the effect of
 $Re_{x}$ and
 $h/\delta$ for a fixed
 $AR_{p}$.
The detailed free end flow physics prompts an examination into the wake flow features, thereby shifting focus to SPIV window location 3. As mentioned, the flow features over the top of the pin have direct implications on the characteristic behaviour and vortical interactions associated with the wake. A prominent mushroom-type vortex, or recirculation bubble, was observed over the top of the pin, specifically for the cases of  $h/\delta = 1$ and 1.5 (figures 7b and 7c, respectively). As stated, the two foci of the mushroom vortex were demonstrated with their respective sense of surface-normal rotation. Although the flow field here is described in a time-averaged sense, the dynamics between the mushroom-vortex feature and the wake has been documented such that the wall-normal vortices lift off from the free surface through mutual induction and influence of the outer shear layer. As the mushroom vortex lifts away from the surface, the influences of the mean flow and strong spanwise vorticity component cause the axis of the vortex foci to bend into the wake. As a result, a prominent cross-stream vortex is established in the mean recirculation region, herein defined as the arch vortex. Consistent with literature, the symmetric shedding mode (or arch-type shedding) is expected for this range of sub-critical aspect ratio, i.e.
 $AR_{p} \leq 1$ (Pattenden et al. Reference Pattenden, Turnock and Zhang2005).
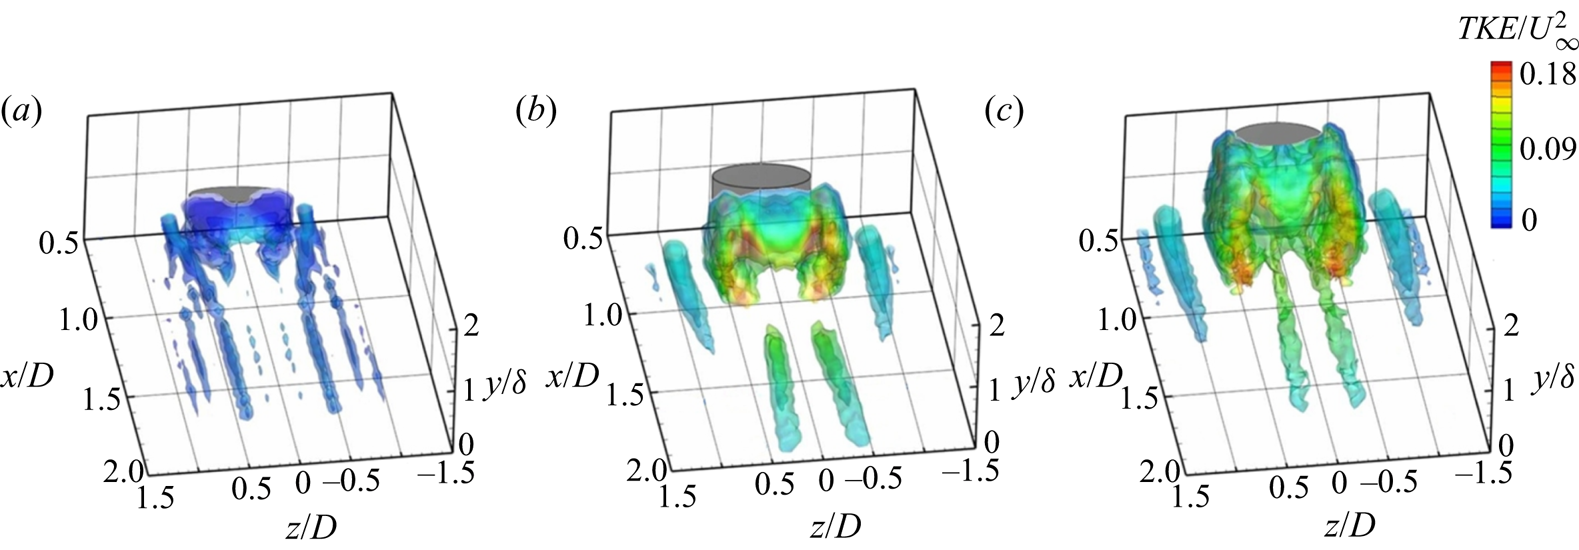
The relative size and strength of the vortical features in the wake are described in figure 9 via iso-surfaces of the  $Q$-criterion (
 $Q = 0.25$, 0.5 and 1.5, where
 $Q$ refers to value(s) calculated using the
 $Q$-criterion vortex identification method, which identifies regions of the flow where the vorticity magnitude is greater than the magnitude of rate-of-strain), which are coloured by the dimensionless turbulent kinetic energy,
 ${\rm TKE}/U_{\infty }^{2}$. This representation of the flow helps to convey the unsteadiness associated with these flow features. Characteristic to this type of flow is the M-shaped arch vortex, also reported in Zhu et al. (Reference Zhu, Wang, Wang and Wang2017). For the shortest pin (figure 9a), the fluctuations about the mean are very small, due to the pin's full submergence within the laminar boundary layer and thus, generates a very small recirculation region. As the pin's height is increased, the unsteadiness in the wake grows. The intensity of the fluctuations is largest at the downstream edge of the arch-vortex structure, suggestive of the location at which the arch vortex sheds away from the pin periodically. The
 $Q$-criterion also reveals the quasi-steady horseshoe vortices along the base of each pin. Additionally, the trailing vortex pair is observed in the central wake region, generated by the combination of induced downwash and secondary vorticity associated with the tip and arch vortices. The largest magnitude of turbulent fluctuations is located within the vortex formation region in the proximity of the oscillating reattachment point in the wake. Correspondingly, the relative magnitude and distribution of the kinetic energy associated with the turbulent fluctuations also increase as the pin's wake becomes more extensive.
Time-averaged iso-surfaces of  $Q$-criterion (
 $Q = 0.25$, 0.5, and 1.5) coloured by
 $TKE/U_{\infty }^{2}$ for: (a)
 $AR_{p} = 0.25$,
 $h/\delta = 0.5$; (b)
 $AR_{p} = 0.5$,
 $h/\delta = 1$; and (c)
 $AR_{p} = 0.75$,
 $h/\delta = 1.5$. Here,
 $Re_{x} = 6 \times 10^{5}$ (
 $Re_{D} = 8.1 \times 10^{3}$).

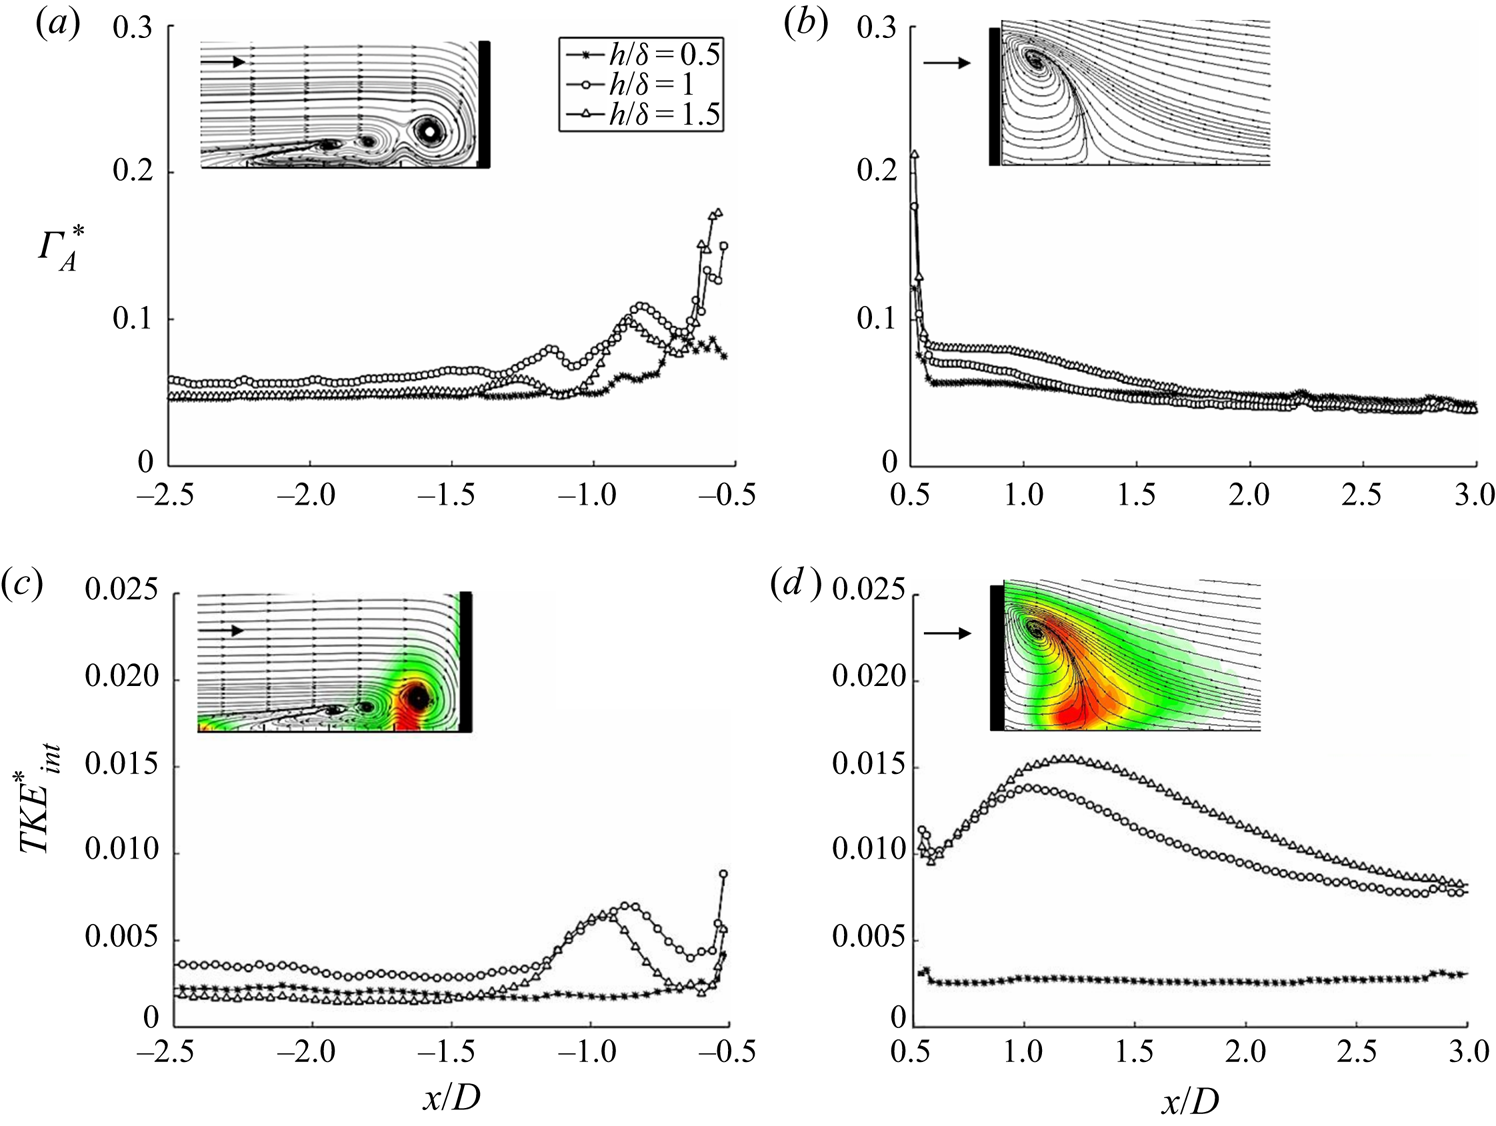
Some of the physical mechanisms responsible for the generation and evolution of these vortical flows are described more quantitatively in figure 10, which presents the downstream evolution of the dimensionless circulation per unit area,  $\Gamma ^*_A$, and the dimensionless integrated TKE,
 $TKE^*_{int}$, computed upstream and in the wake for each case. Note that each quantity has been non-dimensionalized by the pin's diameter, D, and the free-stream velocity,
 $U_{\infty }$. A sample flow field along the centreline for the case of
 $h/\delta =1$ (
 $AR_{p} = 0.5$) is included inset for each plot.
(a and b) Dimensionless circulation per unit area,  $\Gamma ^*_A$, compared with (c and d) integrated dimensionless fluctuating energy content,
 $TKE^*_{int}$, upstream of the pin, (
 ${x/D} \leq -0.5$), and in the wake, (
 $x/D \geq 0.5$), respectively. Here, the incoming boundary layer is laminar (
 $Re_{x} = 6 \times 10^{5}$ and
 $Re_{D} = 8.1 \times 10^{3}$). Representative mean flow fields along the centreline are shown insets for the case of
 $h/\delta = 1, (AR_{p} = 0.5)$.

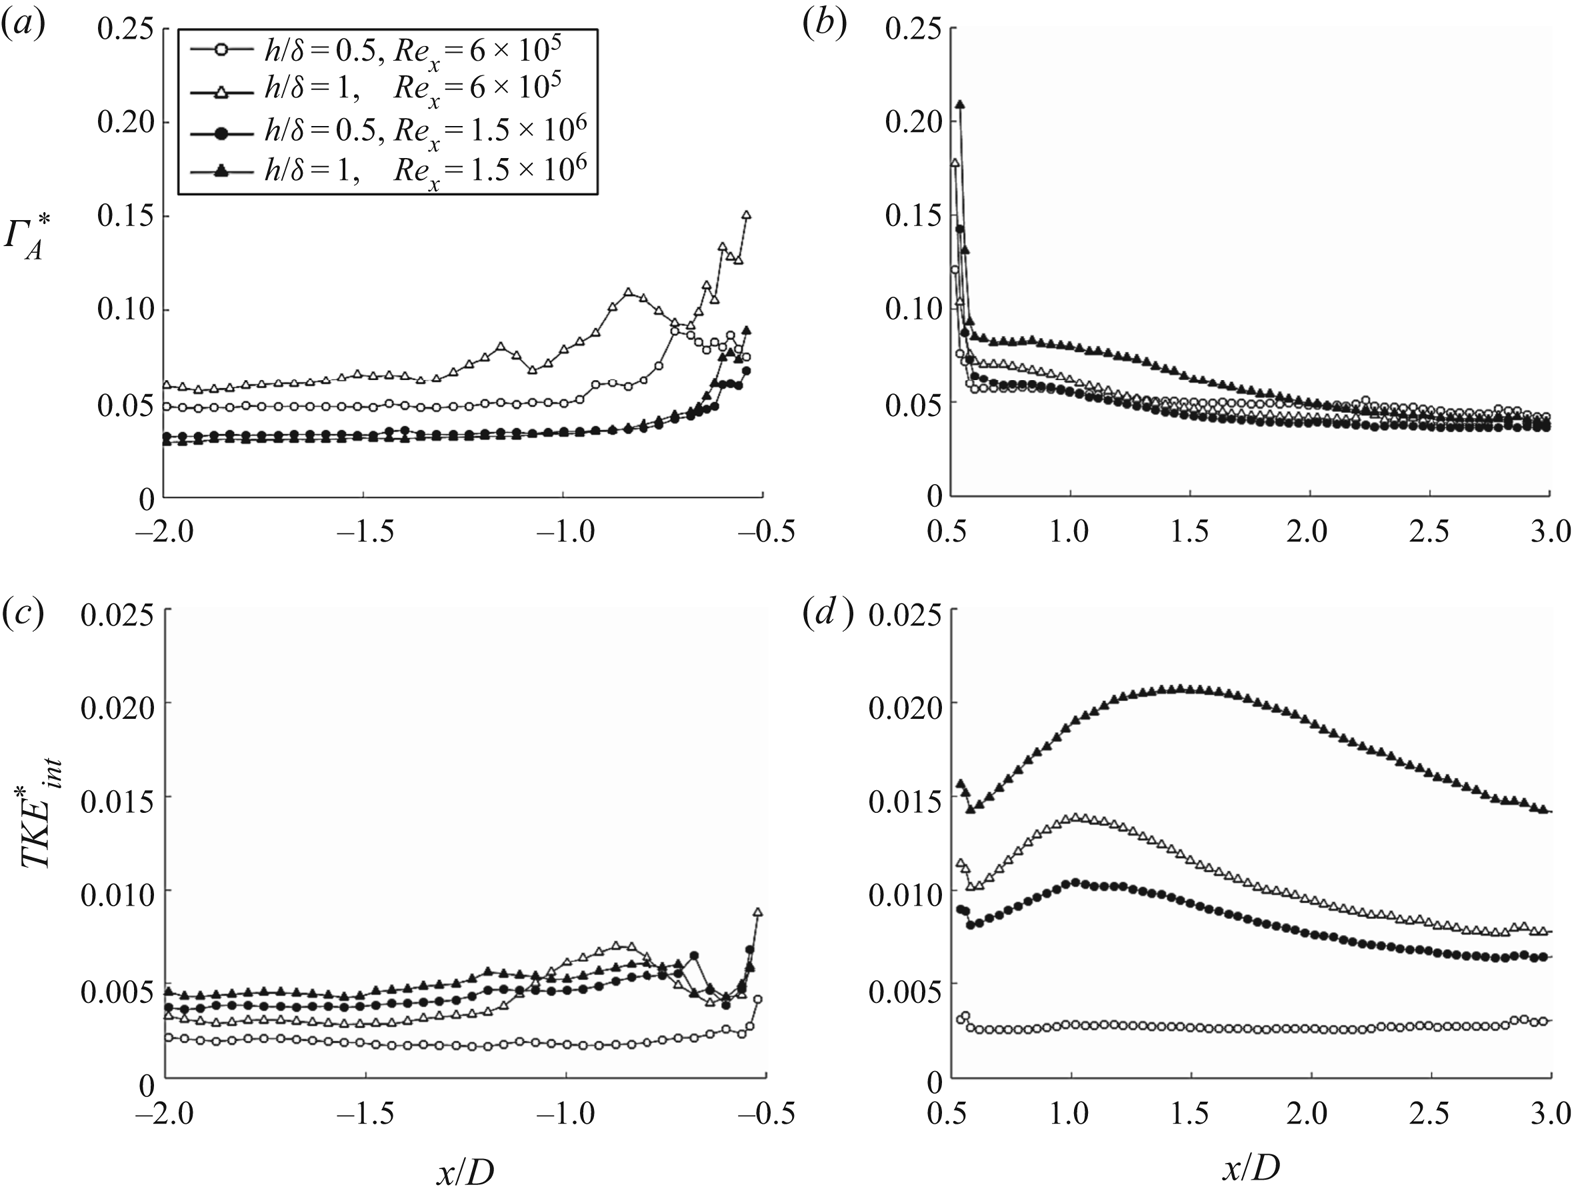
The circulation generated (per unit area) associated with each of these cases is demonstrated in figures 10(a) and 10(b). As expected, the magnitude of circulation in the approaching flow grows as a function of increased blockage by the pin (i.e. increased  $h/\delta$ and
 $AR_{p}$). Accordingly, the undulations in the circulation profiles directly correspond to the locations of the horseshoe vortices, which are pushed further upstream as a function of the pin's increasing height. However, the peak in circulation exists nearest the pin's trailing edge, near
 $x/D \approx 0.5$ (figure 10b), reaching a value greater than the maximum value upstream of the pin. This is evidence of the additional accumulated circulation that has been generated around the pin sides and over the free end. Subsequently, there is a steep drop in circulation, which levels to a fairly constant value in the region of the arch vortex (i.e.
 $x/D \leq 1$). Moreover, beyond
 $x/D = 2$, the circulation reaches an asymptotic value due to flow reattachment.
The evolution of  $TKE^*_{int}$ is plotted in figures 10(c) and 10(d) with sample contours of
 $TKE/U_{\infty }^{2}$ included in the insets to distinguish regions of greatest unsteadiness. Upstream of the pin, the profiles reveal maximum unsteadiness in the region between the primary and secondary HV, for cases of
 $h/\delta = 1$ and 1.5, respectively. This behaviour is due to the momentum transfer, or ‘feeding’, of vorticity and fluctuations between the energy in the larger scales. In contrast, the total fluctuating energy present in the surrounding flow for the pin where
 $h/\delta = 0.5$ reveals a nearly constant value throughout the measurement domain. This indicates that the pin's deep submergence within the incoming boundary layer offers a minimal impact on the mean flow, acting more closely to that of a roughness element. Whereas, the unsteadiness associated with the HV and recirculation region grows significantly as the pin's height approaches the local boundary layer thickness. The turbulent fluctuations extend much farther downstream for the cases of
 $h/\delta = 1$ and 1.5, demonstrated by the difference in the magnitude at the final measurement location of
 $x/D = 3$.
3.2. Effect of Reynolds number
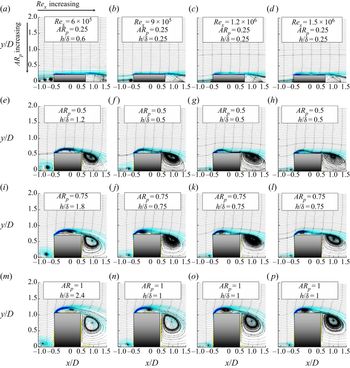
An investigation ensued to examine the effect of the Reynolds number on the flow field and the associated vortical structures. Figure 11 presents the mean spanwise vorticity fields along the symmetry plane as a function of  $Re_{x}$ and
 $AR_{p}$. Note that, for the present data set, the change in Reynolds number imposes a coupled change in the
 $h/\delta$ parameter. The discussion focuses on the nature of flow separation over the pin's free end and the subsequent variation of the near wake recirculation region. The Reynolds number was varied over
 $6.0 \times 10^{5} \leq Re_{x} \leq 1.5 \times 10^{6}$, which falls within the transitional flow regime. As such, the characteristics of the incoming boundary layer experience abrupt changes, triggering changes to the resultant flow features and reattachment length over the pin's free end.
Streamwise planes of time-averaged spanwise vorticity,  $\Omega _{z}D/U_{\infty }$, along the centreline, superimposed with in-plane streamlines, for four Reynolds numbers and (a–d)
 $AR_{p} = 0.25$; (e–h)
 $AR_{p} = 0.5$; (i–l)
 $AR_{p} = 0.75$; and (m–p)
 $AR_{p} = 1$. Note that the local boundary layer thickness,
 $\delta$, was measured beforehand (when no pin was present) for the presented range of Reynolds numbers, i.e.
 $6.0 \times 10^{5} \leq Re_{D} \leq 1.5 \times 10^{6}$.

Two correlations can be explored in parallel from figure 11: the effect of variable aspect ratio for a fixed  $Re_{x}$, and vice versa. As the pin's aspect ratio is increased (shown by each column), the size of the separation bubble is also increased. The enlarged separation bubble also creates a curved virtual shape modification to the pin's top, which effectively accelerates the flow on the outer portion of the mean shear layer. This accelerated flow is entrained into the near wake as downwash, resulting in an increasingly oblique separation angle off of the trailing edge. This is also observed by the downward deflection of the shear layer and core of the mean recirculation vortex as the pin's aspect ratio is increased. Several studies have been conducted which attempt to document the free end flow behaviours over a cantilevered low aspect ratio cylinder as a function of the Reynolds number. Some works attribute the dynamics of the tip flow entirely to a low frequency instability of the order of
 $f_{s}/4$ (e.g. Morton et al. Reference Morton, Martinuzzi, Kindree, Shahroodi and Saeedi2018), which appears to be strongly expressed for a cylinder exposed to a laminar flow. Whereas, it was observed that changing the state of the incoming boundary layer resulted in the suppression of this low frequency phenomenon. Other works describe that the tip vortices result from the projection of the arch-vortex structure in the cross-stream plane (e.g. Tanaka & Murata Reference Tanaka and Murata1999; Wang, Zhou & Mi Reference Wang, Zhou and Mi2012). Work by Baker (Reference Baker1991) also proposed that the free end flow instability could be strongly affected by the size of the horseshoe vortex. He stated that the change in size of the HV system would result in a deflection of the oncoming flow at the upstream junction. As such, it can be speculated that for small aspect ratio cylinders, the flow deflection can impose changes to the flow over the free end. The referenced works have demonstrated significant sensitivity to several factors including Reynolds number, oncoming flow turbulence intensity, aspect ratio and the boundary layer thickness. Each of these factors are of principal importance to the present study and are examined concurrently in figure 11.
The effects of Reynolds number on the resultant flow field for a given aspect ratio are presented by each row in figure 11. As Reynolds number is increased, the characteristics of the HV system upstream of the pin are altered. The increased momentum and steeper velocity gradient near the wall result in a single smaller primary vortex contained closer to the pin's base as  $Re_{x}$ is increased. Consequently, the increased momentum and turbulence intensity in the approaching flow causes an earlier reattachment point over the pin's top. This earlier reattachment has direct implications on the near wake, as is observed by each row of data. As the streamwise velocity component is increased over the top of the pin, the mean separation angle off of the trailing edge becomes shallower. Simultaneously, the increased momentum causes the flow along the sides to accelerate, thereby also reducing the width of the wake. Accordingly, the recirculation region becomes stretched longitudinally (i.e. arch-vortex stretching) under the influence of the increased spanwise vorticity component associated with the mean separating shear layer. This accelerated mean flow and shallow separation angle effectively alter the location of the cross-sectional core of the arch vortex and likewise, its characteristic three-dimensional shape. This will be described further in figure 16.
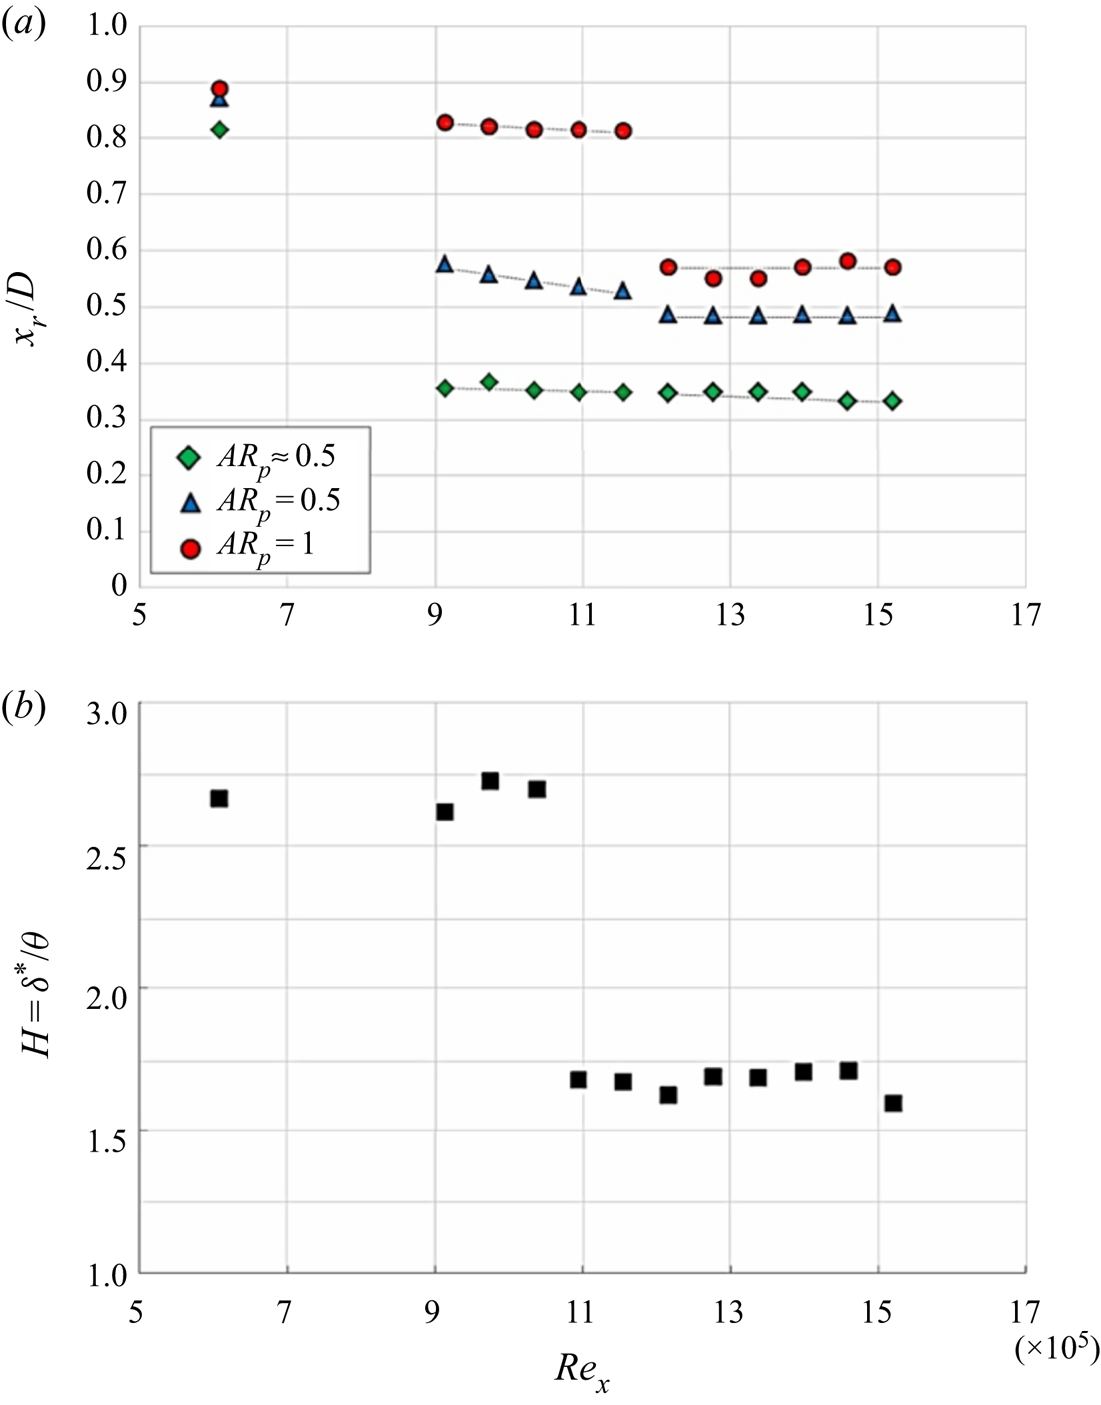
The variation in the reattachment length over the pin's free end is discussed in figure 12 within the context of the incoming boundary layer shape factor, H, as free-stream velocity (and  $Re_{x}$) is increased. In order to resolve the point of reattachment to a higher accuracy, this discussion shifts focus to a range of aspect ratios between
 $0.5 < AR_{p} \leq 1$. As discussed previously, as
 $AR_{p}$ increases, the separation bubble over the top becomes larger and produces a more distinctive point of reattachment. In contrast, the smaller aspect ratio pins (i.e.
 $AR_{p} \leq 0.5$) are associated with a significantly smaller separated region near the leading edge, and thus, the exact locations of reattachment are less clear. Figure 12(a) represents the variation in the reattachment length along the centreline of the pin's free end, as a function of Reynolds number and aspect ratio, i.e.
 $x_{r}/D \sim f(Re_{x}, AR_{p})$. For the laminar boundary layer condition, i.e.
 $Re_{x} = 6 \times 10^{5}$, the reattachment location is similar for all three aspect ratios. This is attributed to the fact that the pin's tip is exposed to similar free-stream conditions for all aspect ratios. The local thickness of the laminar boundary layer is less than, or equal to the height of each pin, and therefore experiences a similar shear strength of the separating vortex sheet (and separation bubble) over the top. Although the reattachment lengths are similar at the lowest Reynolds number, there is a visible trend in the reduction of reattachment length as aspect ratio is decreased. As the Reynolds number is increased over the range of
 $9 \times 10^{5} \leq Re_{x} \leq 1.5 \times 10^{6}$, the boundary layer reveals characteristics of transitional behaviour, demonstrated by the abrupt drop in the shape factor (and also validated by the boundary layer profiles shown in figure 2). As can be seen, the variation in reattachment length is largest within the transitional boundary layer regime. Although it is noted that for each specified aspect ratio, the reattachment length remains fairly constant over this short range of Reynolds numbers.
(a) Normalized reattachment location along the centreline of the pin's free end, as a function of Reynolds number and the pin's aspect ratio for  $AR_{p} \approx 0.5$ (diamond symbols),
 $AR_{p} = 0.75$ (delta symbols) and
 $AR_{p} = 1$ (circle symbols). (b) Calculated boundary layer shape factor, H, at the location of the pin (when no pin is present) as a function of Reynolds number.

For  $Re_{x} \geq 1.2 \times 10^{6}$, the differences in reattachment length with respect to aspect ratio are reduced and demonstrate a Reynolds number independence. This is attributed to the pin's exposure to similar velocity gradients and turbulence intensity, as it is fully submerged in the thicker turbulent boundary layer. Note that the smallest aspect ratio,
 $AR_{p} \approx 0.5$, reveals consistent reattachment length for
 $Re_{x} \geq 9 \times 10^{5}$. This is due to its deep submergence within the boundary layer over the entire range. A detailed parametric study of the flow field interactions is discussed in the proceeding section as the pin is immersed in a turbulent boundary layer.
3.3. Interactions with a turbulent cross-flow
The characteristic differences in the flow field as a function of the state of the boundary layer are discussed herein. The flow physics is examined parametrically, such that the  $AR_{p}$ and
 $h/\delta$ are matched, and thus decoupled from the influences of
 $Re_{x}$. Figure 13 presents the streamwise development of the normalized total circulation per unit area (
 $\Gamma ^*_{A}$) compared to the total fluctuating energy (
 $TKE^*_{int}$) for a range of
 $Re_{x}$, where the open and closed symbols represent laminar and turbulent boundary layers, respectively. The effect of the pin's relative height on the magnitude of circulation upstream of the pin is greater under laminar inflow conditions. This is attributed to the overall larger size of the HV system, which influences the flow farther upstream than for the turbulent counterparts. As distance from the pin is reduced, circulation reaches maxima in locations associated with the core(s) of the HV system. The relative size of the horseshoe vortices are transparently larger under laminar conditions, irrespective of the pin's relative submergence in the boundary layer. This can be explained by the variation in the shear strength of the oncoming flow near the wall. For the laminar inflow, a significant portion of the fluid is travelling at a reduced velocity with a fairly constant gradient throughout the boundary layer. As this flow encounters the pin and rolls up into a system of horseshoe vortices, the upstream flow is deflected upwards and away from the wall due to the virtual blockage imposed by the HV system. This results in the spatial growth of these vortices as the height of the pin (i.e. blockage) is increased. Whereas, the turbulent inflow is associated with much higher gradients near the wall accompanied by a rapid increase in the velocity away from the wall. As a result, the inflow velocity is more uniform throughout the entire boundary layer. The steeper gradients confined closer to the wall produce a smaller horseshoe vortex with minimal impacts to the fluid farther from the wall. The reduced size of the HV at
 $Re_{x} = 1.5 \times 10^{6}$ were also shown in figure 11.
(a,b) Evolution of the dimensionless circulation per unit area,  $\Gamma ^*_A$, compared with (c,d) integrated fluctuating energy content,
 $TKE^*_{int}$, upstream of the pin, (
 ${x/D} \leq -0.5$), and in the wake, (
 $x/D \geq 0.5$), respectively, for laminar (open symbols) and turbulent (closed symbols) boundary layer conditions.

In the wake (figure 13b), it follows that the tallest pin,  $h/\delta = 1$, immersed in a turbulent boundary layer generates the largest magnitude of circulation, as anticipated. For
 $h/\delta = 0.5$, the laminar and turbulent profiles nearly collapse onto each other, suggesting the pin's full submergence within a turbulent wake, such that the generated circulation is fairly insensitive to the upstream flow conditions. Next, the total turbulent kinetic energy is shown in figures 13(c) and 13(d). As expected, the magnitude of unsteadiness contained in the approaching flow is greater for turbulent conditions. Moreover, the downstream evolution of the total TKE is similar between each tested
 $h/\delta$. In contrast, there is a significant difference in the fluctuations under laminar conditions. This behaviour is due to the initial lower level of turbulence intensity in the mean flow, as well as more dramatic changes to the scale of the HV system. In the wake, the peak fluctuations for each test case follow a similar trend. The exception is the smallest pin which is fully submerged in the incoming laminar boundary layer (open squares), and acts more closely to that of a roughness element which does not contribute a significant amount of unsteadiness. For all cases presented, there is a proportional increase (by at least 100 %) between the pin's relative height and the level of peak fluctuations, for laminar and turbulent conditions, respectively. Downstream of the pin (which is the source of circulation and unsteadiness), the magnitude of fluctuating energy experiences an increase up to
 $x/D \approx 1 \text {--}1.5$, where it reaches a saturation point and monotonically decays farther downstream. This near wake region associated with maximum unsteadiness is representative of the vortex formation region. Beyond this point, vortices are shed and break down, leading to a decrease in the total fluctuating energy. Note that the integrated TKE does not converge until well beyond the final measurement plane shown here, i.e.
 $x/D > 3$.
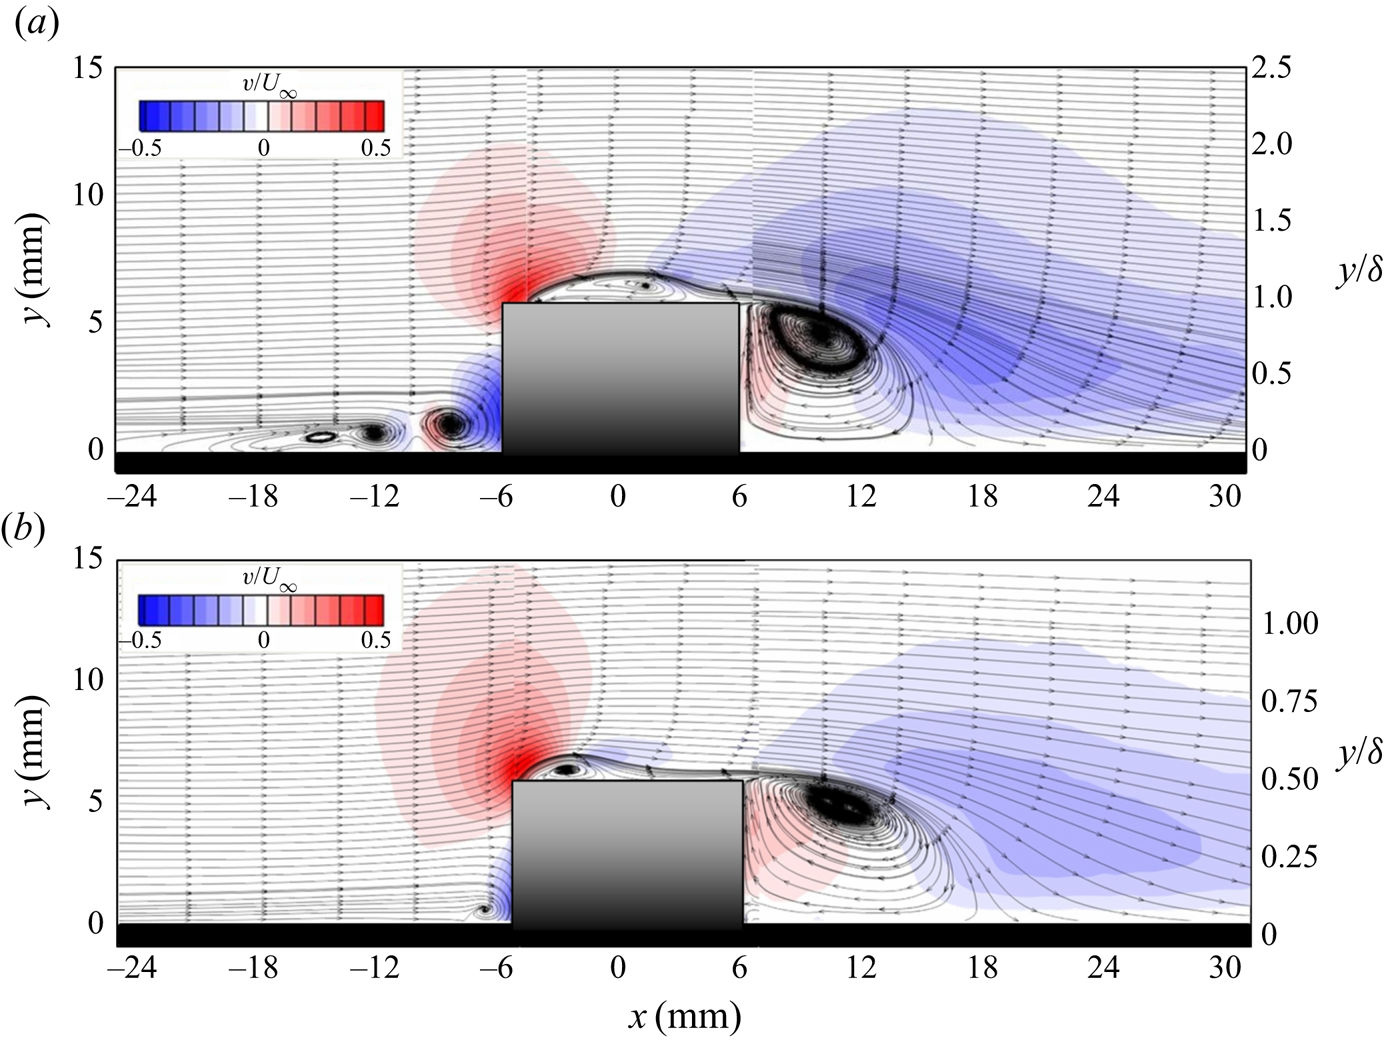
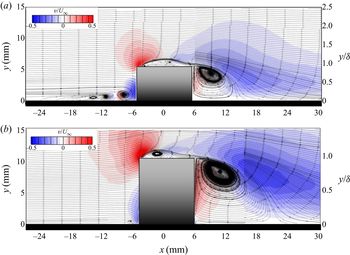
In order to isolate the mechanisms responsible for the resultant wake flow features as a function of the local boundary layer state, the effects of the aspect ratio and the pin's relative submergence are decoupled herein. Figures 14(a) and 14(b) reveal contours of the wall-normal velocity component along the centreline for the pin with a fixed  $AR_{p}$ of 0.5, presented across the entire streamwise measurement domain, as the pin is immersed in laminar and turbulent boundary layer conditions, respectively. As has been established previously, the resultant flow field in a laminar cross-flow is characterized by a quasi-steady horseshoe vortex system upstream of the pin, an extensive separation bubble over the free end, and a recirculation region in the wake yielding an ‘M-shaped’ arch vortex in the mean. The dimensions of the separation bubble in this case demonstrate a streamwise length of
 $x_{b} \approx 0.8D$ and a maximum height of
 $y_{b} \approx 0.16D$. Note that the change in Reynolds number is coupled to the pin's relative submergence. In this case, the pin's
 $AR_{p} = 0.5$ with a relative submergence of
 $h/\delta = 1$.
Colour contours of time-averaged, normalized wall-normal velocity,  $v/U_{\infty }$, along the centreline, superimposed with in-plane streamlines, for a fixed
 $AR_{p} = 0.5$, where (a)
 $h/\delta = 1$, and
 $Re_{x} = 6 \times 10^{5}$ (laminar inflow), and (b)
 $h/\delta = 0.5$, and
 $Re_{x} = 1.5 \times 10^{6}$ (turbulent inflow).

In like manner, the wall-normal velocity component is presented in figure 14(b) for the corresponding turbulent inflow condition. As previously discussed, the turbulent boundary layer is associated with a larger velocity gradient near the wall, resulting in a single, smaller horseshoe vortex (Baker Reference Baker1980). Moreover, the accelerated flow and increased turbulence intensity causes an earlier transition of the separating shear layer. Consequently, this results in a smaller separation bubble with earlier flow reattachment over the free end (i.e.  $x_{b} \approx 0.3D$,
 $y_{b} \approx 0.13$). Earlier reattachment is accompanied by an increased streamwise velocity component over the free end. To that end, there are characteristic differences exhibited in the vortex formation region of the wake, which may be explained in part by the vorticity transport equation given in (3.1). In a three-dimensional viscous flow, the right-hand side of the vorticity transport equation suggests that the vorticity in a Lagrangian element of fluid flowing along a streamline will only change for one of two reasons. It will either change due to diffusion of vorticity into that element through the action of viscosity, or because of vortex stretching. The vortex stretching term,
 $(\boldsymbol {\Omega } \boldsymbol {\cdot } \boldsymbol {\nabla }){\boldsymbol {u}}$, represents the product of the gradient of velocity (or shear), acting in the direction of the dominant vorticity component, and the magnitude of the total vorticity vector. Thus, the stretched recirculation region embodies a ‘true’ arch-type vortex shape (in the mean), characteristic to its namesake. Recall, the mean arch-type vortex takes on a different shape when the pin is exposed to an incoming laminar cross-flow due to relatively weak shear present in the flow field and increased magnitude of downwash over the top (see figure 9). Note that although the geometric aspect ratio remains the same, the relative submergence is altered due to a thicker turbulent incoming boundary layer. As such, the pin's aspect ratio and relative submergence are equivalently 0.5, as noted in figure 14(b). Its full submergence within the boundary layer is a contributing factor to the promotion of earlier reattachment over the top, and subsequently, a shallower separation angle off of the trailing edge. These variations in the flow physics have direct implications on the overall structure of the mean arch vortex and the secondary vortices formed thereafter. The specifications of those details are addressed in figures 15 and 16.
 \begin{equation} \frac{\textrm{D}{\boldsymbol{\Omega}}}{\textrm{D}t} = \frac{\partial {\boldsymbol{\Omega}}}{ \partial t} + ({\boldsymbol{u}} \boldsymbol{\cdot} \boldsymbol{\nabla}){\boldsymbol{\Omega}} = ({\boldsymbol{\Omega}} \boldsymbol{\cdot} \boldsymbol{\nabla}) {\boldsymbol{u}} + \nu\nabla^{2}{\boldsymbol{\Omega}}. \end{equation}
(a–e) Spanwise planes of time-averaged total vorticity,  ${|\boldsymbol {\Omega }|}D/U_{\infty }$, over the pin's free end, shown across half of the span at several streamwise locations (
 $-0.15 \leq x/D \leq 0.45$);
 $AR_{p} = 0.5$, for laminar and turbulent boundary layer conditions, respectively. (f–j) Spanwise planes of time-averaged streamwise vorticity,
 $\Omega _{x}D/U_{\infty }$, in the wake for
 $0.75 \leq x/D \leq 2.0$. Note that the flow direction is out of the page.

(a,c) Measurements from the present study of the local flow field for a low aspect ratio pin,  $AR_{p} = 0.5$ for laminar and turbulent conditions, respectively, compared with (b,d) flow field schematics from the work of Zhu et al. (Reference Zhu, Wang, Wang and Wang2017) and Kawamura et al. (Reference Kawamura, Hiwada, Hibino, Mabuchi and Kumada1984), respectively.

Cross-stream planes of total vorticity,  ${|\boldsymbol {\Omega }|}D/U_{\infty }$, as defined below in (3.2), are shown along half of the pin's span at several streamwise locations over the pin's free end (i.e.
 $x/D \leq |0.5|$) in figures 15(a)–15(e). These are shown to compare the developing flow features over the free surface under the influence of an incoming laminar or turbulent boundary layer, respectively. Correspondingly, the tip and trailing vortical flow features, which develop in the near wake (i.e.
 $x/D > 0.5$), are represented by colour contours of normalized streamwise vorticity,
 $\Omega _{x}D/U_{\infty }$, as shown in figures 15(f)–15(j). Note that each row represents a streamwise location,
 $x/D$, and each column represents the tested parameters of
 $Re_{x}$ and
 $h/\delta$ for a fixed aspect ratio.
 \begin{equation} {\boldsymbol{\Omega}} = \left(\frac{\partial w}{\partial y} - \frac{\partial v}{\partial z}\right)\hat{i} + \left(\frac{\partial u}{\partial z} - \frac{\partial w}{\partial x}\right)\hat{j} +\left(\frac{\partial v}{\partial x} - \frac{\partial u}{\partial y}\right)\hat{k}. \end{equation}
The curved region of maximum total vorticity over the pin's free end demarcates the outer portion of the separation bubble as the flow moves out of the page (figures 15a–15e). Under laminar conditions (left side of each panel), the separation bubble extends farther downstream, relative to the case exposed to fully turbulent conditions, due to a later transition and reattachment of the shear layer. In addition to the presence of a separation bubble, there is the emergence of the tip vortices along the outside of the pin in both cases. Note that the sense of rotation of the mushroom-type vortex pulls the higher momentum fluid from the outsides towards the mid-span (see figure 7). As a result, the accelerated flow along the pin's sides rolls over the edge with a counter-rotational sense to each other. The mechanisms of the formation of the tip vortices are similar in these cases, and thus, are independent of  $Re_{x}$ and
 $h/\delta$ for the aspect ratio of 0.5. However, the strength and location at which these vortices are present do demonstrate a dependency on the aforementioned variables. The origin of the tip vortices occurs farther upstream under turbulent conditions, which correspond to the point at which the magnitude of total vorticity (i.e. strength) within the separation bubble subsides and begins to descend towards the surface as x/D increases. Under laminar conditions, the tip vortices reveal a reduction in strength due to the less aggressive gradients in the separated region, and their emergence is delayed by
 ${\approx } 50\,\%$ due to the larger separation bubble. The strength and rotational sense of the tip vortices and subsequent development of the trailing vortex pair are observed in more detail in figures 15(f)–15(j) via contour planes of the streamwise vorticity component in the near wake.
Just downstream of the trailing edge (figure 15f), the concentrations of streamwise vorticity located near the top edges of the pin are indicative of the separating tip vortices. Due to the combined vorticity and downwash generated by the arch vortex and the free end, the tip vortices descend towards the ground over a short distance from the pin. These actions initiate the formation of the trailing vortex pair (shown in figure 15j). Under laminar boundary layer conditions, the trailing vortex is associated with higher strength, due to the weaker diffusive and dissipative properties, compared to its turbulent counterpart, as shown in figure 15(j).
The three-dimensionality of these vortical features are demonstrated with top view and isometric perspectives of the mean streamlines on the left and right sides of figures 16(a) and 16(c), respectively. These quantitative results are compared with the simplified flow field schematics from the flow visualization work of Zhu et al. (Reference Zhu, Wang, Wang and Wang2017) and Kawamura et al. (Reference Kawamura, Hiwada, Hibino, Mabuchi and Kumada1984) (figures 16b and 16d, respectively). As is evident, the cellular mushroom-type vortex over the top surface varies significantly with  $Re_{x}$ (and
 $h/\delta$). Under laminar inflow conditions (figure 16a), the mushroom vortex plays a predominant role over the free end, where the counter-rotating vortices are large and spread further apart, encompassing nearly the entire span. Moreover, the extended length of the separation bubble and magnitude of downwash flow over the top (compared to the turbulent inflow condition) contribute to the steeper separation angle in the central wake. These flow behaviours factor into the distinctive M-shape of the arch vortex, which agrees fairly well to results from Zhu et al. (Reference Zhu, Wang, Wang and Wang2017).
For the turbulent case (figure 16c), the full submergence of the pin within the turbulent boundary layer causes an earlier flow reattachment and an increased streamwise velocity component over the free end. Additionally, the accelerated flow delays the sidewall separation, effectively reducing the width of the wake and stretching the recirculation region in the streamwise direction. The nature of these interactions contribute to the formation of a true arch-like shape of the mean vortex. As stated in other works, such as Bourgeois, Sattari & Martinuzzi (Reference Bourgeois, Sattari and Martinuzzi2011), the relative thickness of the boundary layer has direct implications on the shear strength of the incoming flow over the characteristic length of the pin, i.e. the diameter. As such, the thicker boundary layer plays a vital role in the wake instability, due to the variation in the strength of the separated vortex sheet over the pin's span. This will be discussed in further detail in figure 19.
The effects of the pin's aspect ratio on the characteristic flow features are explored herein, where  $h/\delta$ is held constant for laminar and turbulent inflow conditions. Figure 17 presents the mean wall-normal velocity fields along the centreline, superimposed with in-plane streamlines. The main features under consideration are the flow over the free end and the recirculation region in the wake. The most notable observation is the
 $28\,\%$ reduction in reattachment length for the larger aspect ratio,
 $AR_{p} = 1$ (figure 17b). It has been cited previously (Sumner Reference Sumner2013) that an increased aspect ratio is directly related to an increased reattachment length. Based on the additional parameters tested in this study, this assumption does not hold. The results have provided evidence that the influence of the pin's aspect ratio and the state of the boundary layer (associated with an increased thickness and level of turbulence intensity) play a crucial role in the resultant flow physics.
Streamwise planes of time-averaged, normalized wall-normal velocity,  $v/U_{\infty }$, along the centreline, superimposed with in-plane streamlines, for a fixed
 $h/\delta = 1$, where (a)
 $AR_{p} = 0.5$,
 $Re_{x} = 6 \times 10^{5}$ (i.e.
 $Re_{D} = 8.1 \times 10^{3}$); and (b)
 $AR_{p} = 1$,
 $Re_{x} = 1.5 \times 10^{6}$ (i.e.
 $Re_{D} = 2 \times 10^{4}$).

The behaviour of the shear layer is arguably one of the most significant features contributing to the complex dynamics of the flow. The Kelvin–Helmholtz instability is responsible for the initial traces of turbulence in the wake as well as the transport mechanism for vorticity. To demonstrate the transition to turbulence in the shear layer, the unsteady behaviour of the front end shear layer over the top is presented in figures 18(a) and 18(b), for laminar and turbulent inflow conditions, respectively. Two realizations of normalized total vorticity are provided along the centreline for each tested pin, including the corresponding mean field (inset) for reference. The location of transition is demarcated by the initial occurrence of nonlinear growth of the KH instability. This is defined by the first roll-up occurrence of the sheet into a coherent vortex, which subsequently becomes amplified, exhibiting spatial growth and vortex pairing (Prassad & Williamson Reference Prassad and Williamson1997).
Instantaneous snapshot of the normalized total vorticity,  ${|\boldsymbol {\Omega }|}D/U_{\infty }$, along the centreline of the pin's free end, with corresponding time-averaged total vorticity (inset) for fixed
 $h/\delta = 1$, where (a)
 $AR_{p} = 0.5$,
 $Re_{x} = 6 \times 10^{5}$, (i.e.
 $Re_{D} = 8.1 \times 10^{3}$); and (b)
 $AR_{p} = 1$,
 $Re_{x} = 1.5 \times 10^{6}$ (i.e.
 $Re_{D} = 2 \times 10^{4}$).

Time-averaged, three-dimensional velocity streamlines over the pin's free end and in its near wake for fixed  $h/\delta = 1$, where (a)
 $AR_{p} = 0.5$,
 $Re_{D} = 8.1 \times 10^{3}$; and (b)
 $AR_{p} = 1$,
 $Re_{D} = 2 \times 10^{4}$. The dashed line indicates the mean vortex line.

Next, the three-dimensional mean streamlines are provided to complement the discussion on the interdependent nature between the wake flow structures and the behaviour of the shear layer and resultant vortical features over the free end. Although the effect of aspect ratio and  $Re_{x}$ are examined currently, the formation of the mean arch vortex appears insensitive to the pin's sub-critical range of aspect ratios tested presently. As can be observed, the arch vortex maintains an overall consistent shape for laminar and turbulent conditions, respectively (see figure 16c). It is therefore evident that the incoming turbulent boundary layer and increased turbulence intensity are responsible for promoting an earlier transition of the shear layer and supplying vorticity to the wake. Accordingly, the separating flow from the sides and over the top contains sufficient vorticity, such that the side ‘legs’ and spanwise vortex over the top are stretched in the axial direction, connecting near the free end to form a true arch-like shape vortex in the near wake.
Part of the focus of the present work was to demonstrate the robust nature of the symmetric arch vortex, irrespective of laminar or turbulent inflow conditions. Although the separation behaviours along the cylinder are not fixed, the differences presented in the mean flow are predominantly associated with the shear strength and characteristic shape of the arch vortex (i.e. ‘U’ or ‘M’ shaped). In essence, it does not appear that the existence of the arch vortex is significantly influenced by a change in the state of the approaching boundary layer for the case when aspect ratio and relative submergence are both  $O(1)$. Based on this outcome, it is difficult to argue the vital importance of understanding the individual contributions of each of the aforementioned parameters (i.e. aspect ratio,
 $h/\delta$ and
 $Re$). The authors believe there is a strong need for an accurate flow model to represent the flow field associated with low aspect ratio cylinders immersed in relatively thick boundary layers, given the broad potential applications. The wake model would require some level of adaptation as it pertains to aspect ratio and relative boundary layer thickness, given their crucial importance in defining the wake characteristics.
4. Conclusions
The present study examines the detailed flow physics associated with a finite-span, cantilevered, low aspect ratio cylindrical pin immersed in a laminar or a turbulent boundary layer over a flat plate. A parametric study was conducted using surface flow visualizations and SPIV measurement techniques to investigate the complex three-dimensional flow field and the associated vortex dynamics, to assess their sensitivity to the pin's aspect ratio,  $AR_{p}$, its relative submergence within the boundary layer,
 $h/\delta$ as well as the state of the incoming boundary layer.
In general, it was shown that the flow field is characterized by complex vortical flow features unique to cantilevered, low aspect ratio cylinders. The results have indicated that the pin's geometry and the state of the incoming boundary layer play a critical role in the vortex dynamics; and more specifically, the interplay between the two dominant instabilities of the separating shear layer and the wake. This strong interaction between the free end and wake flow is largely attributed to the significant end effects. The finite-span geometry facilitates a sub-critical aspect ratio and large component of downwash entrained into the wake, resulting in a symmetric arch-type shedding mode. These near wake flow features are also responsible for entraining the outer, high momentum flow towards the ground plane and reducing the wake deficit. The intersection of the entrained outer flow and the wall create a large spanwise component of velocity tangent to the wall and outward from the centreline. This relatively large spanwise velocity component effectively increased the induced velocity and streamwise vorticity component contributing to the formation of the trailing vortex pair. The development of strong, counter-rotating streamwise vortices was one of the primary contributors to the re-energization of the flow, enhanced near-wall fluid mixing, and transport of vorticity throughout the wake.
The investigation focused on a small range of geometric parameters, i.e.  $AR_{p} \leq 1$ and
 $h/\delta \leq 1$, for varied cross-flow conditions. The main objective was to create a test platform, which would facilitate a significant level of influence of the aspect ratio and local boundary layer on the resultant flow physics. Through designed experiments, these parameters were decoupled to examine their individual impacts on the characteristic vortex dynamics. It was shown that the existence of each of the aforementioned flow features is relatively consistent for this sub-critical range of aspect ratios. Throughout the study, each of the constituent vortical features demonstrated similar formation mechanisms. However, the detailed behaviours of the primary and secondary vortical interactions do show sensitivity to the Reynolds number and the relative submergence within the local boundary layer. The size and scale of the HV system around the pin, the mushroom-type vortex over the free end, and shape of the arch vortex in the near wake are predominantly driven by the state of the local boundary layer and the pin's level of submergence. These primary behaviours subsequently influence the onset and strength of the tip and trailing vortices.
The detailed quantification of these finite-span bluff body flows have broad impacts across many different systems and applications. The considerations of the present study have formed the basis of understanding the complex, and highly three-dimensional vortical interactions associated with low aspect ratio bluff bodies exposed to relatively thick boundary layers. More specifically, the over-arching goal of the work is to understand the fundamental flow physics surrounding these types of flows in an effort to introduce and/or improve various flow control strategies using these pins. With a detailed characterization of the vortex dynamics, control techniques may be implemented to effectively augment the inherent flow features and advance the potential capabilities for manipulating different types of flows.
Acknowledgements
The authors would like to acknowledge the support by the Department of Defense (DoD) through the National Defense Science and Engineering Graduate Fellowship (NDSEG) Program to S.G.
Declaration of interests
The authors report no conflict of interests.