Nickel oxide (NiO) is a basic metal oxide used in diverse applications ranging from solar devices to electronic materials.[Reference Castell, Wincott, Condon, Muggelberg, Thornton, Dudarev, Sutton and Briggs1–Reference Jin, Okamoto and Ishida3] It is a p-type semiconductor with wide intrinsic band gap of ~4 eV,[Reference Feinleib and Adler4] which adopts the rock-salt crystal structure at room temperature. The demonstration of conduction modulation (resistive switching)[Reference Sattler5–Reference Wei, Arredondo, Peng, Zhang, Guo, Xing, Li, Wong, Wang, Valanoor and Wu9] as well as novel electrochemical properties[Reference Du, Zhang, Chen, Ma, Liu, Wu and Yang10–Reference Sasi and Gopchandran12] has spawned a resurgent scientific interest in NiO, particularly in its nanostructured form. Recently, we demonstrated a size-dependent resistive switching in epitaxial NiO nanocrystals where the resistive switching mechanism was found to be interface-mediated.[Reference Sullaphen, Bogle, Cheng, Gregg and Valanoor13] It was shown that the applied electric field controls the minority carrier distribution and hence alters conductivity. In addition to electrical properties, NiO also shows intriguing surface-driven polar anisotropies,[Reference Barbier and Renaud14–Reference Song, Chen, Hu and Richards17] a burgeoning area attracting tremendous interest currently for photocatalysis.
It is clear that in order to effectively exploit nanocrystal NiO for electronic and electrochemical applications, detailed insight into surface and shape control and an understanding of underlying drivers of morphology is desired. This communication discusses the dimensional and morphological aspects of (001) oriented NiO nanocrystals fabricated via pulsed laser deposition on (001) SrTiO3 oxide substrates. The role of typical epitaxy process parameters (such as temperature, pressure, etc.) and laser pulses for controlled nanocrystal synthesis is investigated. It is found that the nanocrystals do not follow the thermodynamically expected equilibrium shapes and dimensions, of square-based pyramids (the shape with lowest total surface energy to volume ratio for FCC structures). Rather the observed non-equilibrium nature of nanocrystals, remarkably shows clear discretization of differences of basal dimensions, length (L) and width (W) of nanocrystals, that is, L − W = nΔ, where n is an integer and Δ is a constant.
The NiO nanocrystals of interest are deposited on a (001) strontium titanate (SrTiO3, STO) substrate using the recently reported universal method for the synthesis of magnetic oxide nanocrystals from bismuth perovskite precursors.[Reference Bogle, Anbusathaiah, Arredondo, Lin, Chu, O'Neill, Gregg, Castell and Nagarajan18, Reference Bogle, Cheung, Chen, Liao, Lai, Chu, Gregg, Ogale and Valanoor19] This approach consists of two steps. Step 1 is to create a temperature and pressure environment that promotes perovskite precursor instability to form a Bi2O3 matrix, in which randomly distributed nanoislands of NiO are embedded. For that purpose a bismuth nickel oxide (BiNiO3, BNO) perovskite precursor target is ablated using a KrF laser [248 nm, 1.5 J/cm2, Lambda Physik (Australian supplier, Coherent, Germany)] for 5000 pulses onto (001) vicinal STO (Shinkosha) heated at 900 °C in 50 mTorr O2 partial pressure. Combinatorial spread samples were prepared using a moving physical mask placed between the plume and the substrate creating a volume gradient of 1000–5000 pulses along the sample. Step 2 is the removal of Bi2O3 via evaporation in a high vacuum environment (10−6 to 10−7 Torr) during cooling at 3 °C/min. This leaves behind the required self-assembled array of NiO nanocrystals. A second annealing step is carried out at 900 °C to promote crystallization and complete the phase formation of the nanocrystals. The chamber O2 partial pressure (vacuum, 100 mTorr and 1 Torr) during this postdeposition annealing step is also considered (refer to Fig. S1 in supplementary) as a processing parameter. Annealing in vacuum is found to be an ineffective process condition since the reduction of STO substrate in high vacuum resulted in the formation of the undesired Ni2O3 phase, whereas an oxygen pressure of or greater than 1 Torr was found to be the most successful one in producing the desired morphology of nanocrystals with the appropriate stoichiometry. Thus, all results discussed here on are based on the 1 Torr postdeposition anneal.
Characterization of the NiO nanocrystal morphology was carried out using JEOL JSPM 5400 MkII Environmental atomic force microscope (AFM) with a custom-made size analysis MATLAB script (see Fig. S2 for details). Scanning electron microscopy (SEM) was achieved using a FEI Nova NanoSEM 230. X-ray diffraction (XRD) was performed on Phillips X-Pert MRD.
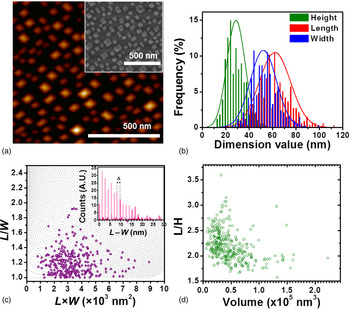
Typical NiO nanocrystals obtained according to the method outlined above are given in the AFM and SEM images [Fig. 1(a)]. An inspection of the nanocrystals reveals that the dominant morphology possessed is a rectangular-based truncated pyramid form with well-defined edges and {111} facets, similar to our previous study.[Reference Sullaphen, Bogle, Cheng, Gregg and Valanoor13] Ex-situ XRD (Fig. S3) confirms that the islands are epitaxial with the presence of only (002) reflections with no observable shift from the bulk value of 4.17 Å (JCPDS 071-1179). From this lack of shift in the lattice parameter it is inferred that the nanocrystals are completely relaxed on the substrate. The corresponding size distributions of the dimensions of the nanocrystals [length (L), width (W), and height (H)], with mean values of 60, 50, and 30 nm respectively, are given in Fig. 1(b).
(a) Typical AFM (SEM, in inset) image of the nanocrystals formed by the phase separation method showing square and rectangular-based truncated pyramids. (b) Size distribution of the nanocrystals with average lengths, widths, and heights of 60, 50, and 30 nm. (c) L/W of individual nanoislands as a function of their surface area (L × W). The inset histogram shows that most nanocrystals fall in discrete L − W differences which are of integer multiples of Δ = 1.38 nm. (d) Distribution of L/H as a function of volume of nanocrystals. The L/H ratio of nanocrystals is found to decrease with increasing volume, suggesting larger nanocrystals adopt pyramidal morphologies with lesser truncation.

It is known that for a truncated pyramid free from epitaxial strain, the lowest shape and interfacial energy is a square-based pyramid and not rectangular-based.[Reference Silly and Castell20] However, it is observed that the majority of the nanocrystals studied here are rectangular-based (97%) and only very few are square-based truncated pyramids. Hence, this observation appears inconsistent with the thermodynamically expected equilibrium morphology despite a reasonably long (3 h) annealing process that is carried out postdeposition to overcome any kinetics-related limitations. The nature of this rectangularity is examined closely in Fig. 1(c) where the L/W ratio of individual nanocrystals is plotted as a function of their interfacial surface area (L × W) with the STO substrate. The degree of rectangularity (L/W) is found to peak around L × W ≈ 3.5 × 10³ nm2. Interestingly, one can notice that the data points are not randomly distributed and considering the basal dimensions L and W, fall on lines along which the difference L − W is constant. In addition, the set of such lines altogether are found to obey the discretization defined as L − W = nΔ where n is an integer and Δ is a constant. This discretized behavior or preference for certain values of L − W is clearly noticeable from the histogram plot of L − W values given in the inset of Fig. 1(c), where a value of 1.38 nm is found for the increment Δ. The resulting family of lines, that is, L − W = n × 1.38 nm, is represented by the dashed lines in Fig. 1(c).
It is unclear if such a discretization is due to the kinetics of processing and, if such trends would extend through a wider range of sizes of nanocrystals, combinatorial techniques were employed. To ensure that the trends in Fig. 1(c) are extended to smaller nanocrystals, combinatorial pulsed laser deposition protocols were exploited. A deposition spread ranging from 1000 to 5000 laser pulses was then synthesized on a single wafer to allow the analysis of crystals ranging from 5 to 100 nm in their lateral dimensions. However, due to intrinsic limitations of the laser heater employed in this chamber setup and to ensure that the process was not frozen in a metastable state, the annealing of the deposition spread was performed ex-situ under atmospheric conditions at a higher temperature of 1000 °C and for a longer duration of 12 h.
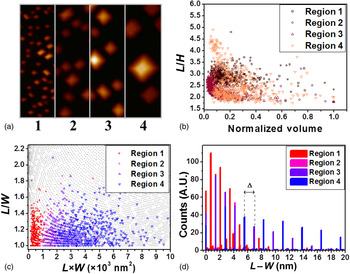
Figure 2(a) details the four regions analyzed in the combinatorial deposition spread showing increasing size distribution of the NiO nanocrystals in higher order regions. XRD (Fig. S4) confirms that the lattice parameter of the NiO nanocrystals is still 4.17 Å in all regions of the spread and is identical to that of the samples (Fig. 1) annealed at 900 °C and 1 Torr of O2 partial pressure. Figure 2(b) shows the L/H distribution as a function of normalized volume for each region. Despite the extended annealing process, the distribution lies consistent with samples annealed in chamber conditions throughout all four regions. For smaller nanocrystals (such as Region 1) there is a large variation in L/H ratios for a smaller range of normalized volumes. As the nanocrystals increase in volume (Regions 3 and 4), the L/H decreases (i.e., one obtains taller structures) for a fixed volume. Therefore, the variation in L/H as a function of volume is observed even after extended annealing of NiO nanocrystals and is not a frozen metastable state. Figure 2(c) shows L/W as a function of L × W and confirms that the same trends that occur in Fig. 1(c) also occur across the deposition spread. In all four regions except Region 1 (separate dimensional analysis plots are supplied in Fig. S5), the difference between basal dimensions of nanocrystals lies predominantly in integer multiples of Δ = 1.38 nm [dashed lines in Fig. 2(c)]. Figure 2(d) shows the L–W distributions across all four regions inspected. In addition to these, nanocrystals in Region 1 for which L × W is less than ≈103 nm2 are found to obey the same type of discretization but with the increment value being halved, that is, L − W = nΔ/2.
(a) A section of the four regions of the deposition spread studied. Nanocrystal sizes increased in higher order regions. Each region shown is 500 × 125 nm long. (b) L/H of all nanocrystals measured. Extensive annealing remains to produce a wide range of pyramidal morphologies. We find that smaller nanocrystals show more variation producing mostly flatter pyramids while larger nanocrystals form taller pyramids. (c) L/W as a function of surface area. Nanocrystals show their rectangular nature (L/W ratios) lie in discrete L − W steps (dotted line), consistent with Fig. 1. (d) Histogram showing the same Δ = 1.38 nm for nanocrystals in Regions 2 through to Region 4. Smaller nanocrystals in Region 1 show that they can lie in L − W = nΔ/2.

Electron diffraction from our previous publication has shown that the orientation of these nanocrystals are 〈100〉NiO//〈100〉STO with a rough interface.[Reference Sullaphen, Bogle, Cheng, Gregg and Valanoor13] The epitaxy of cubic NiO and STO would suggest that the substrate would induce an isotropic biaxial in-plane strain upon NiO nanocrystals. Oxide nanocrystals under similar misfit strains with nonequilibrium dimensions have been previously observed in TiO2–STO systems. Misfit strains, up to 5%, induce this rectangularity in shape evolution.[Reference Marshall and Castell21] Strong evidence of this effect is a clear bifurcation of lengths and widths at a specific nanocrystal–substrate interfacial area. Analysis of L and W individually as a function of L × W (Fig. S6) reveals that there is no clear bifurcation at any given interfacial area for any region, thus confirming that the observed rectangularity does not come from misfit strain-induced effects. As both annealing at high temperatures for 3 and 12 h produced the same level of discretization, this property is intrinsic to the thermodynamic behavior of NiO–STO nanocrystal system. Therefore this discretization of length and width is likely to be correlated to preferred geometries for a given interfacial area. These geometries are determined during the growth of these nanocrystals through the coarsening during annealing where mass transport occurs via means analogous with mechanisms such as Ostwald ripening or vapor phase transport.
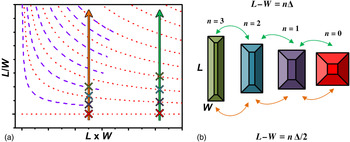
The schematic in Fig. 3 describes this geometric constraint. Figure 3(a) shows the L − W = nΔ and nΔ/2 lines as shown in Figs. 1(c) and 2(c). For a given interfacial area between the NiO nanocrystal and the STO substrate (as indicated by the colored arrows), only those geometries where the condition L − W = nΔ is satisfied will the nanocrystal become stable (as indicated by the intersects of the arrow and the dashed or dotted lines). For nanocrystals with a small interfacial surface area with the underlying substrate (i.e., L × W≲1 × 10³ nm2) the dimensions can be in multiples of Δ/2 while larger nanocrystals adopt L − W in integer multiples of Δ. Figure 3(b) shows that nanocrystals with equal interfacial area can adopt different regularities in discrete steps. Each step indicated by the orange and green arrows corresponds to the intersects in Fig. 3(a) and each of these geometries are equally preferred. The correlation of Δ to a physical parameter remains undetermined; cross-sectional TEM studies of the nanocrystal − substrate interface reveal that the interface is heavily deformed (see Fig. S7). Perhaps, this can contribute to the observed Δ correlation; however, this requires further detailed analysis.
(a) A schematic showing discretization of nanocrystal dimensions. The left arrow represents a nanocrystal of interfacial area ≲1 × 10³ nm2 and right arrow represents nanocrystals with larger interfacial surface area. Where the arrows intersect with the L − W = nΔ lines is where the geometries are preferred. (b) Represents the preferred rectangular geometries that the nanocrystal can adopt for a given substrate interfacial area. For smaller nanocrystals [corresponding to the left arrow in (a)], the nanocrystals increase can change the L − W in integer multiples of Δ/2 while larger nanocrystals [right arrow in (a)] increase in integer multiples of Δ.

In summary, we demonstrate NiO nanocrystals grown on (001) STO employing the concept of perovskite instability and phase separation via bismuth perovskite precursor yield morphologies that are not thermodynamically expected. Detailed analysis of nanocrystal dimensions show that they possess a predominantly rectangular form and the rectangularity (L − W) is discretized in integer multiples of Δ. This discretization suggests that nanocrystals of a given surface area have similar or metastable interface energies of specific geometries. This has a major implication for the self-assembly of nanocrystals—it shows that certain types of nanocrystals can have multiple preferred geometries of same interfacial area, an unexpected phenomena in the wake of typical expectations during nanostructure synthesis. This can alter the uniformity during synthesis and is an additional underlying factor toward the shape control. The implications of this provide an underlying factor in shape control of self-assembled NiO nanocrystals.
Acknowledgments
The research at UNSW was supported by ARC Discovery and LIEF Grant. We would like to acknowledge Electron Microscopy and Solid State & Elemental Analysis Units (EMU and SSEAU) at UNSW. We are also thankful to Prof. Marty Gregg and Prof. Martin Castell for helpful discussions. Ying-Hao Chu would like to acknowledge the support of the National Science Council, Taiwan (under contract No. NSC-101-2119-M-009-003-MY2) and Ministry of Education (under grant No. MOE-ATU 102W961) and Center for Interdisciplinary Science of National Chiao Tung University.
Supplementary materials
For supplementary materials for this article, please visit http://dx.doi.org/10.1557/mrc.2013.16