


Academic performance is an essential area of competence and one that has been associated with psychological adjustment across childhood and adolescence (Eccles, Roeser, Vida, Fredricks, & Wigfield, Reference Eccles, Roeser, Vida, Fredricks, Wigfield, Balter and Tamis-LeMonda2006). Given its central role in adaptive development, disentangling temporal associations between academic achievement and emotional–behavioral difficulty is an important area of consideration for developmental psychopathology as a prevention science. In terms of the existing evidence, some investigations have concluded that depression is a result of academic failure (Lewinsohn et al., Reference Lewinsohn, Roberts, Seeley, Rohde, Gotlib and Hops1994; Masten et al., Reference Masten, Roisman, Long, Burt, Obradovic and Riley2005; Pelkonen, Marttunen, & Aro, Reference Pelkonen, Marttunen and Aro2003), but others suggest that it is a harbinger of poor academic performance (Kessler, Foster, Saunders, & Stang, Reference Kessler, Foster, Saunders and Stang1995; Woodward & Fergusson, Reference Woodward and Fergusson2001). In a similar vein, several studies suggest that among both early and late adolescents, externalizing behaviors, like delinquency and substance use, precede poor academic performance (Ellickson, Bui, Bell, & McGuigan, Reference Ellickson, Bui, Bell and McGuigan1998; Newcomb et al., Reference Newcomb, Abbott, Catalano, Hawkins, Battin-Pearson and Hill2002; Newcomb & Bentler, Reference Newcomb and Bentler1988), while others suggest the opposite temporal sequence (Bryant, Schulenberg, O'Malley, Bachman, & Johnston, Reference Bryant, Schulenberg, O'Malley, Bachman and Johnston2003; Defoe, Farrington, & Loeber, Reference Defoe, Farrington and Loeber2013; Lipsey & Derzon, Reference Lipsey, Derzon, Loeber and Farrington1998).
These findings were derived from youth from middle-class backgrounds, and they yield limited insights for youth living at the extremes of the socioeconomic continuum. Failure to systematically consider socioeconomic context when investigating temporal associations in emotional–behavioral distress and achievement is a noticeable gap in the literature. This is particularly problematic in light of findings from Masten et al.'s (Reference Masten, Burt, Roisman, Obradovic, Long and Tellegen2004) 20-year prospective study. In that investigation, economic advantage was found to play a relatively “global” protective role because it was associated with completion of myriad developmental tasks. These positive effects, both within and across different domains, were found to persist well into adulthood.
Socioeconomic advantage has been investigated as a context within which to examine both short- and long-term associations concerning emotional distress, behavioral difficulty, and academic achievement in a limited number of studies (Ansary & Luthar, Reference Ansary and Luthar2009; Ansary, McMahon, & Luthar, Reference Ansary, McMahon and Luthar2012; Defoe et al., Reference Defoe, Farrington and Loeber2013; Li & Lerner, Reference Li and Lerner2011; Magnuson, Duncan, & Kalil, Reference Magnuson, Duncan, Kalil, Huston and Ripke2006). The findings from one study of early adolescents suggest that the academic achievement of affluent suburban youth may not be compromised by internalizing distress and problem behavior, while this does not appear to be the case for economically disadvantaged youth (Ansary et al., Reference Ansary, McMahon and Luthar2012). Similarly, Li and Lerner (Reference Li and Lerner2011) found that affluent youth report greater emotional and behavioral school engagement than their disadvantaged counterparts. Moreover, the results of that study also suggest that economic disadvantage acted as an independent predictor of poor achievement, which then led to delinquency, which in turn was associated with depression.
At first blush, these findings suggest that suburban affluence may provide environmental buffers that may protect against “spill over” of disturbance from one arena to another (i.e., emotional–behavioral difficulty to achievement and vice versa). However, other evidence suggests that wealth may not always confer a comprehensive protective effect. For instance, low-achieving affluent youth have been found to demonstrate more substance use (Ansary & Luthar, Reference Ansary and Luthar2009; Ansary et al., Reference Ansary, McMahon and Luthar2012; Ludden & Eccles, Reference Ludden and Eccles2007). More intriguing are the results of two separate studies of affluent early adolescents, which found high-achieving youth to also be at increased risk for substance use over time (Ansary et al., Reference Ansary, McMahon and Luthar2012; Ludden & Eccles, Reference Ludden and Eccles2007). Identification of moderating factors and elucidation of the mechanisms underlying the link between high achievement and substance use among affluent youth are still elusive.
Pressures to achieve may play a role in this somewhat paradoxical finding. In a study of privileged high school students, adolescents achieving only average grades whose teachers characterized them as exerting high effort in the classroom also reported more frequent use of cigarettes and alcohol, more delinquency, as well as increases in depression over time (Ansary & Luthar, Reference Ansary and Luthar2009). Though the finding requires replication, it is certainly plausible that pressures to achieve, which have been documented in this context (see Luthar, Barkin, & Crossman, Reference Luthar, Barkin and Crossman2013), may exacerbate the distress experienced when youth fall short of their achievement goals. Collectively, this evidence suggests there may be important differences in emotional–behavioral–achievement processes within socioeconomic context. Accordingly, prospective, person-centered investigations examining subgroup differences in the association between emotional–behavioral difficulty and achievement are warranted, especially within an affluent, suburban context.
Trajectories of Emotional Distress, Problem Behaviors, and Achievement
As noted earlier, while one study found almost no association between emotional–behavioral difficulty and achievement among affluent early adolescents (Ansary et al., Reference Ansary, McMahon and Luthar2012), another study done by the same research group found significant associations between drug use and later underachievement among wealthy high school students (Ansary & Luthar, Reference Ansary and Luthar2009). It is important to note that these two studies examined youth from two different affluent communities. The former study examined middle school early adolescents from the longitudinal New England Study of Suburban Youth study (NESSY; see Luthar & Barkin, Reference Luthar and Barkin2012) and the latter examined an entirely different sample of privileged high schoolers assessed in the mid-1990s (Luthar & D'Avanzo, Reference Luthar and D'Avanzo1999). Among these affluent high school-aged youth, those demonstrating both emotional difficulty and high levels of problem behaviors, namely, multiproblem youth, were found to have compromised achievement that persisted for the duration of a 3-year longitudinal investigation (Ansary & Luthar, Reference Ansary and Luthar2009). Cumulatively, the findings across these few studies suggest that emotional–behavioral–achievement associations may change over time, and the relative protection that affluent youth appear to manifest during middle school, particularly when considering substance use–achievement links, may not persist into the high school years (Ansary & Luthar, Reference Ansary and Luthar2009; Ansary et al., Reference Ansary, McMahon and Luthar2012; Luthar & Ansary, Reference Luthar and Ansary2005). Furthermore, these results suggest that privileged youth manifesting distress across multiple domains are more likely to suffer sustained impairments in achievement.
Guiding Theoretical Framework
We acknowledge that the existing literature examining the temporal associations between emotional–behavioral distress and achievement among affluent youth is constrained to a small number of studies and the results require replication. Nevertheless, this nascent work suggests that social class may play an important role in moderating the associations of interest. We agree with Grossman and Huynh (Reference Grossman and Huynh2013) that “social class is not culture-free: In addition to signaling one's rank, social class background also indicates social practices and system of values transmitted across generations. Class-specific behavior is not only about chronic awareness of one's rank but also about habits of thought” (p. 117).
As others have done (Cicchetti & Rogosch, Reference Cicchetti and Rogosch2002; Kraus, Tan, & Tannenbaum, Reference Kraus, Tan and Tannenbaum2013; Luthar & McMahon, Reference Luthar and McMahon1996), we conceptualize socioeconomic context as a cultural influence, which informs norms, beliefs, and practices that can shape behavior. As such, this investigation was guided by a sociocultural perspective that posits that social class can affect the individuals that comprise it by shaping ideas, practices, and patterns of thought and action. Stephens and Townsend (Reference Stephens and Townsend2013) argued that individuals bring their “socioculturally shaped selves to educational settings, and thus experience these settings quite differently. For example, a sociocultural perspective would attend to the ways in which students' backgrounds confer culture-specific strengths, challenges, and strategies for success” (p. 129).
Overview of the Current Study
Limitations in our current understanding of antecedent–consequent associations between emotional–behavioral difficulty and academic achievement as they pertain to affluent youth are due to (a) a dearth of prospective, person-centered longitudinal studies examining temporal associations within this socioeconomic context; (b) difficulties in assessing, as Li and Lerner (Reference Li and Lerner2011) posit, reciprocal relationships among these constructs; and (c) failure to examine developmental trends in these associations from late childhood through adolescence. Consequently, there are other queries in addition to the primary question: do internalizing distress and problem behaviors precede underachievement or does underachievement precede internalizing distress and problem behaviors? Are there subgroups of youth, for example, that are nested within this socioeconomic context for whom one trajectory is more likely to unfold while for others a separate pattern is traversed? If so, is there continuity in these patterns over time?
A multiple-method, multiple-informant approach was utilized in this investigation that sought to address these gaps in the literature. The sample was composed of relatively affluent youth tracked from the beginning of middle school through the end of high school in the NESSY (Luthar & Barkin, Reference Luthar and Barkin2012). Consistent with others who have explored associations of interest here (Ansary & Luthar, Reference Ansary and Luthar2009; Ludden & Eccles, Reference Ludden and Eccles2007), we employed a person-based approach because this approach has the capacity to illuminate different trajectories that may yield different outcomes (Bergman, Reference Bergman2001; Bergman, Magnusson, & El-Khouri, Reference Bergman, Magnusson and El-Khouri2003). Where possible, this study assessed the same associations examined by Ansary and Luthar (Reference Ansary and Luthar2009) within a completely different sample of affluent youth followed from early to late adolescence via seven annual assessments.
The study comprised two parts. Part 1 explored emotional–behavioral adjustment during 6th grade predicting changes in academic performance across middle and high school. Part 2 explored academic performance in 6th grade predicting changes in emotional–behavioral adjustment across middle and high school. Broadly and based on previously described evidence, we expected that as development unfolds, cross-domain influences are likely to emerge as teens move from early to late adolescence.
Research Hypotheses
Prior evidence examining these associations shaped our a priori hypotheses. Using cluster analyses to group high schoolers on dimensions of internalizing distress and problem behaviors, Ansary and Luthar (Reference Ansary and Luthar2009) found five groups: (a) a conventional or asymptomatic cluster, (b) an internalizing distressed cluster, (c) two distinct drug-using clusters, and (d) a multiproblem cluster with both internalizing distress and problem behaviors. Given that this study began tracking youth at 6th grade, when it is expected that substance use and delinquency levels would be relatively low, in Part 1 of the current investigation we did not expect there to be two distinct drug-using clusters. We only expected to find one externalizing cluster. In Part 2 of the study, a similar rationale was used, in that findings from prior work examining achievement clusters was used to frame expectations for the cluster structure in this sample.
Part 1: Emotional–behavioral difficulty predicting academic competence
When students attending 6th grade were sorted on markers of emotional–behavioral difficulty, we anticipated four clusters of students with (a) minimal emotional–behavioral problems, (b) internalizing distress, (c) externalizing problems, and (d) multiple problems (i.e., mixed internalizing–externalizing difficulty). When compared with students experiencing minimal emotional–behavioral problems, students in the other three groups were expected to demonstrate less academic competence during 6th grade with further deterioration of their academic competence as they moved through 12th grade. Furthermore, consistent with prior evidence (Ansary & Luthar, Reference Ansary and Luthar2009; Ensminger & Joun, Reference Ensminger, Joun and Jessor1998; Roeser, Eccles, & Strobel, Reference Roeser, Eccles and Strobel1998), we expected that the multiproblem cluster would exhibit the worst academic outcomes with more substantive deteriorations over time when compared to the asymptomatic group.
Part 2: Academic competence predicting emotional–behavioral difficulty
When students attending 6th grade were grouped on measures of academic competence, six clusters were expected to emerge. The anticipated groups were as follows: (a) high grades and high classroom adjustment; (b) three groups demonstrating medium grades each with a different level of classroom adjustment (e.g., low, medium, and high); and (c) two clusters with low grades each with a different level of classroom adjustment (e.g., low and medium). Moreover, when students beginning middle school with a high grade point average and high classroom adjustment were compared with the other students, we expected (a) students in the two groups with low grades to demonstrate more emotional–behavioral difficulty during 6th grade with a significantly greater escalation of emotional–behavioral difficulty as they moved through 12th grade, and (b) students with average grades and concomitant high classroom adjustment to also report more emotional–behavioral difficulty at 6th grade and significantly greater escalation of emotional–behavioral difficulty over time.
Method
Setting
This study was conducted in an affluent, suburban town located in southern New England. When the study began, data reported by the US Census Bureau (2002) indicated that the town had a total population of approximately 26,000 individuals. The median household income for the town was $125,381, while the median family income for the entire state was $65,000. When compared with the rest of the state, adults living in this community were more likely to (a) have earned at least a bachelor's degree (69% vs. 31%); (b) be working in a management, business, or professional occupation (65% vs. 39%); and (c) be married and living with minor children (34% vs. 24%) in a home they owned (87% vs. 67%) of substantial value ($626,000 vs. $167,000). Very few (2.4% vs. 8.6%) of the family units with minor children were living in poverty. When the study began, three elementary schools, two middle schools, and a single high school served the community.
Sample and procedures
Participants
Participants took part in the NESSY, a cohort of 319 6th graders (48% female) recruited from this affluent, suburban community in 1998 who were tracked annually through high school (Luthar & Barkin, Reference Luthar and Barkin2012). The final sample included 319 of approximately 350 students enrolled in 6th grade at the two middle schools that served the community. The average age of the participants at the time of the first data collection during the spring semester of 6th grade was 12.02 (SD = 0.36) years. Girls (48.28%) and boys (51.72%) were equally represented. Most (92.43%) of the students reported they were of European American heritage. A minority reported they were of Asian (2.84%), Hispanic (1.89%), African American (1.26%), and other (1.58%) heritage. Unfortunately, reliable information about the socioeconomic status of each family was not available in data collected. However, the median annual family income in that community in 1998 when the study began was, as noted above, approximately $125,381, which fell within the top 5% of US households at that time.
Procedure
All children registered as 6th grade students at the two middle schools that served the community where the study was done were invited to participate in a longitudinal study of psychosocial adjustment in the context of suburban affluence. That original cohort was evaluated annually through 12th grade. Each year, a letter from the school was mailed home to parents, and inclusion in the sample was based on a passive consent procedure. On the days of data collection, assent for participation was secured from each student. Unfortunately, practical and ethical considerations precluded tracking of students enrolled in the study who left the public school system.
Self-report and peer-nomination measures were administered to groups of students in a classroom setting. During middle school, data were collected from students on 2 consecutive days during a 45-min class period. During high school, data were collected during a single session in the school cafeteria. Over 7 years, 1,690 (75.68%) of 2,233 possible panel assessments were completed by the 319 students who enrolled in the study. On average, each participant completed 5.30 (SD = 1.95) annual assessments. Similarly, only 71 (0.84%) of a possible 8,450 self-report measures within the 1,690 panels assessments completed by the 319 participants were missing. At each data collection, questions were read aloud in order to minimize potential effects of individual differences in reading ability.
Complementary data from teachers, as well as each participant's school records, were collected at the time of each annual assessment. A concurrent teacher rating of classroom behavior was available for 1,643 (97.22%) of the 1,690 data points available for the 319 students who participated in the study. A concurrent grade point average was available for 1,679 (99.35%) of the 1,690 data points. During grades 6th through 8th, students received a pizza party for their participation. In the high school years, participants were given gift cards for their participation with the value of the monetary incentive increasing yearly. Teachers were offered $1 for each teacher rating they completed.
Measures
Negative mood
The Negative Mood Scale from the Children's Depression Inventory (Kovacs, Reference Kovacs1992) was used in this study as an index of depressive affect and was administered annually from 6th through 12th grade. The Children's Depression Inventory is a 27-item measure of depressive symptoms in which children and adolescents are asked to choose from three statements representing different degrees of depressive symptoms. Kovacs (Reference Kovacs1992) and others (e.g., see Craighead, Curry, & Hardi, Reference Craighead, Curry and Hardi1995) have documented the reliability and validity of the measure when used with children and adolescents. The Negative Mood Scale consists of 6 items that the respondent rates along a 3-point scale and yields scores ranging from 0 to 12. The Negative Mood Scale was chosen as the preferred measure of depressive symptoms for this study because it represents the primary factor derived from the 27 items that comprise the inventory (Kovacs, Reference Kovacs1992). Within this sample, this scale also correlated less than the total score with the other measures of emotional–behavioral difficulty selected for use in the study. Coefficient α values for the measure ranged from 0.67 (Grade 11) to 0.73 (Grades 8 and 10). For this study, a raw score greater than 3 was also taken as a marker of risk for more serious depression likely to be confirmed by less than 15% of the general adolescent population (Kovacs, Reference Kovacs1992).
Anxiety
The Revised Children's Manifest Anxiety Scale (Reynolds & Richmond, Reference Reynolds and Richmond1985) was used to measure symptoms of anxiety from 6th to 12th grade. The Revised Children's Manifest Anxiety Scale is a self-report measure that requires respondents to indicate whether each of 37 statements is generally true or false for them. The instrument yields three scores representing three different dimensions of anxiety: (a) social anxiety, (b) worry, and (c) physiological manifestations of anxiety. In this study, only the subscales representing social anxiety and physiological manifestations of anxiety were utilized because in previous work with other suburban populations, they have proven to be strong correlates of psychosocial adjustment (e.g., see McMahon & Luthar, Reference McMahon and Luthar2006). Scores on these subscales can range from 0 to 7 for the measure of social anxiety and from 0 to 10 for the measure of physiological distress. Higher scores represent more emotional distress. The reliability and validity of the measure have been documented by Reynolds and Richmond (Reference Reynolds and Richmond1985). Coefficients α for the measures ranged from 0.58 (Grade 12) to 0.76 (Grade 8) for the subscale representing social anxiety and from 0.50 (Grade 12) to 0.70 (Grade 8) for the subscale representing physiological manifestations of anxiety. For this study, raw scores greater than 4 on the social anxiety subscale and greater than 5 on the physiological distress subscale were also taken as markers of risk for more serious anxiety likely to be confirmed by less than 15% of the general adolescent population (Reynolds & Richmond, Reference Reynolds and Richmond1985).
Delinquent behavior
Thirty-three items from the Self-Report Delinquency Checklist (Elliot, Dunford, & Huizinga, Reference Elliot, Dunford, Huizinga, Burchard and Burchard1987) were used to measure frequency of delinquent behavior during each panel assessment. The Self-Report Delinquency Checklist is a 38-item, self-report measure that asks respondents to rate how often they engaged in delinquent behavior over the course of the previous year along a 4-point ordinal scale ranging from never (0) to very often (3). Items are summed to create a total score reflecting severity of delinquent behavior. In this study, items representing delinquent behavior directly related to substance use were not included in computation of the total score to avoid a spurious correlation with the measure of substance use. Consequently, total scores had a possible range of 0 representing no involvement in any delinquent activity to 99 representing frequent involvement in all 33 types of delinquent activity over the past year. The reliability and validity of the instrument have been documented by others (e.g., see Huizinga & Elliot, Reference Huizinga and Elliot1986), and the instrument has been used extensively in large-scale, community-based surveys of adolescents (e.g., see Loeber et al., Reference Loeber, Farrington, Stouthamer-Loeber, Moffitt, Caspi, White, Thornberry and Krohn2003). Within this sample, coefficients α for the measure ranged from 0.83 (Grade 10) to 0.93 (Grade 6). For this study, report of any physical assault, particularly physical assault of an adult, was taken as a marker of risk for involvement in more serious forms of delinquent behavior (e.g., see Loeber et al., Reference Loeber, Farrington, Stouthamer-Loeber, Moffitt, Caspi, White, Thornberry and Krohn2003).
Use of alcohol
The frequency of alcohol use was assessed via one question drawn from the Monitoring the Future Survey (Johnston, O'Malley, Bachman, & Schulenberg, Reference Johnston, O'Malley, Bachman and Schulenberg2014). Respondents are asked to rate the frequency of their alcohol use during the past year along a 7-point ordinal scale ranging from 0 (never) to 6 (40 + times). For this study, the ordinal ratings were converted to a frequency count representing a lower bound estimate of the number of occasions (0 to 40) each student had used alcohol over the past year. The psychometric properties of this measure, as well as the general approach to collecting information about the substance use of adolescents, have been documented by Johnston et al. (Reference Johnston, O'Malley, Bachman and Schulenberg2014). Given epidemiological data on the use of alcohol during adolescence (Substance Abuse and Mental Health Services Administration, 2013), any use of alcohol without parental permission during 5th to 6th grade was taken as a marker of risk for problematic use of substances during adolescence. Use of alcohol at this age is typically reported by less than 10% of 12- to 13-year-olds.
Classroom adjustment behavior
The Teacher–Child Rating Scale (T-CRS; Hightower et al., Reference Hightower, Work, Cowen, Lotyczewski, Spinell and Guare1986) was used to obtain a teacher rating of adaptive and maladaptive school behavior. The T-CRS is a 36-item measure, which asks teachers to rate the behavior of their students along a 5-point ordinal scale. Hightower et al. (Reference Hightower, Work, Cowen, Lotyczewski, Spinell and Guare1986) documented the reliability and validity of the instrument, and teacher ratings derived from the six subscales have correlated meaningfully with other constructs in school-based research involving older children and adolescents (e.g., see Luthar & Becker, Reference Luthar and Becker2002; Luthar & D'Avanzo, Reference Luthar and D'Avanzo1999).
Four of the six subscales from the T-CRS were used in this study. The shy–anxious and acting-out subscales were used to document maladaptive classroom behavior during 6th grade. Each of these scales was scored such that it had a possible range of 0 to 24, with higher scores reflecting more problematic classroom behavior. These scales were only used to validate the clusters created during the 6th grade. Two positive subscales of the T-CRS (frustration tolerance and task orientation) were used to document adaptive classroom behaviors associated with academic competence during 6th through 12th grade. Because they consistently correlated highly across 1,643 observations (r > .80), the frustration tolerance and task orientation subscales were summed to operationalize a single construct representing positive classroom adjustment. This classroom adjustment composite was scored such that it had a possible range of 0 to 48, with higher scores representing more adaptive classroom behavior. Coefficients α for the shy–anxious and acting-out subscales during 6th grade were 0.88 and 0.92. Across the seven waves, coefficients α for the classroom adjustment composite ranged from 0.92 (Grade 9) to 0.97 (Grade 11). Given available data (e.g., see Hightower et al., Reference Hightower, Work, Cowen, Lotyczewski, Spinell and Guare1986), a raw score less than 25 on this composite scale was also taken as a marker of risk for clinically significant deficits in academic competence expected to be present in less than 15% of a suburban school population.
Grade point average
A grade point average, computed using grades in four courses representing the traditional academic domains of (a) English, (b) mathematics, (c) science, and (d) social studies, was used to document the academic performance of each student during the marking period in which data were collected. A grid provided by the school for use in calculating a grade point average was used to convert each letter grade to a grade point value (F = 0 to A+ = 12). The four grades were then averaged to produce a grade point average for the marking period. Coefficients α for this marker of academic competence ranged from 0.76 (Grade 12) to 0.89 (Grade 7). For this study, any single grade below a C– (4) was also taken as a marker of risk for academic failure.
Peer reputation
An adaptation of the Revised Class Play developed by Masten, Morison, and Pellegrini (Reference Masten, Morison and Pellegrini1985) was used to document selected dimensions of peer reputation during 6th grade. The Revised Class Play requires respondents to imagine they are directing a play and must cast their classmates in the most appropriate roles. Students are provided with class rosters and asked to identify the child best suited for roles representing positive and negative attributes. For this study, the total number of nominations each student received was taken as a measure of peer reputation related to four different dimensions: (a) shyness, (b) sadness, (c) irritability, and (d) propensity to tease others. The development and psychometric properties of the instrument have been described in detail (Masten et al., Reference Masten, Morison and Pellegrini1985; Rubin & Cohen, Reference Rubin and Cohen1986). Luthar and McMahon (Reference Luthar and McMahon1996) documented the psychometric properties of the approach when used with adolescents. In this study, the measure was only used to validate the clusters created during the 6th grade.
Academic self-concept
The Self-Perception Profile for Children (Harter, Reference Harter1985) is a 36-item, self-report measure that documents five dimensions of self-concept. The measure requires students to rate the extent to which two contrasting statements apply to them along a 4-point scale. In this study, the scholastic competence subscale of the instrument was used to assess self-perception of academic ability during sixth grade. The 6 items that comprise this scale were simply summed to create a measure with a possible range of 0 to 18. Higher scores represent a perception of greater academic competence. Harter (Reference Harter1985) and others (e.g., see Granleese & Joseph, Reference Granleese and Joseph1993, Reference Granleese and Joseph1994; Muris, Meesters, & Fijen, Reference Muris, Meesters and Fijen2003) have described the psychometric properties of the instrument. Coefficient α for the scale was 0.84. This measure was also only used to validate the clusters created during the 6th grade.
Data analysis
General approach
As noted above, a person-centered approach to the analysis of individual differences was used (for discussion, see Bergman & Magnusson, Reference Bergman and Magnusson1997).Footnote 1 There were two parts to the data analysis. In Part 1, five markers of emotional–behavioral adjustment (negative mood, physiologic anxiety, social anxiety, delinquent behavior, and use of alcohol) during 6th grade were used to define clusters of students with specific patterns of emotional–behavioral difficulty. Once the clusters were defined, generalized linear modeling was used to show that the emotional–behavioral clusters differed as expected on (a) teacher ratings of shy–anxious and disruptive behavior and (b) peer nominations for shyness, sadness, irritability, and propensity to tease others, also obtained during 6th grade. Generalized estimating equations were then used to test for between-cluster differences in markers of academic competence (grade point average and classroom adjustment) from 6th to 12th grade.
In Part 2, two markers of academic competence (grade point average and classroom adjustment) during 6th grade were used to define clusters of students with specific patterns of academic performance. Once the clusters were defined, generalized linear modeling was used to show that the academic clusters differed as expected on a self-rating of academic competence as well as peer nominations for prosocial leadership also obtained during 6th grade. Generalized estimating equations were then used to test for between-cluster differences in markers of emotional–behavioral difficulty (negative mood, physiologic anxiety, social anxiety, delinquent behavior, and use of alcohol) from 6th to 12th grade. The same statistical procedures were used in both parts of the study.
Cluster analyses
A disjoint (k-median) approach to cluster analysis was used to identify groups of students with potentially meaningful differences in psychosocial adjustment as they began middle school. A disjoint clustering procedure was chosen because, unlike hierarchical clustering procedures, disjoint clustering procedures use all available data to sort each observation into the most appropriate cluster. A k-median, rather than a k-means, approach was used to accommodate the skewed nature of the measures and minimize the potential influence of outliers (for discussion, see Brusco & Kohn, Reference Brusco and Kohn2008; Kaufman & Rousseeuw, Reference Kaufman and Rousseeuw2005; Kohn, Steinley, & Brusco, Reference Kohn, Steinley and Brusco2010). In both parts of the study, the clustering variables were entered into a k-median cluster analysis with a request for two to six clusters. Descriptive statistics reflecting (a) the size of the clusters, (b) pattern of emotional–behavioral difficulties within each cluster, (c) the separation of the clusters, and (d) the homogeneity of the clusters were used to determine the optimal cluster solution. Categorical markers of risk derived from the clustering variables described above were also used to characterize the cluster solutions.
Cross-informant validation of the clusters
Once the optimal cluster solution was determined, generalized linear modeling was used to validate the cluster solution and document demographic differences in cluster assignment. In this study, the GENMOD procedure available in SAS (SAS Institute, 2004) was used to document (a) between-cluster differences in emotional–behavioral difficulties using data collected from another informant and (b) between-cluster differences in age and gender. For cross-validation, cluster assignment was entered as the independent variable with coding of pairwise contrasts representing comparison of each cluster with each of the others. Because of positive skew in most of the variables used in the cross-informant validation of the clusters, the cross-informant variables were entered as dependent variables with specification of a negative binomial distribution and a log link function. To document demographic differences in cluster membership, cluster assignment was again entered as the independent variable. A large cluster of students representing a normative group was coded as a reference group, and the other clusters were compared with this normative cluster in a series of pairwise comparisons. Age and gender were entered as the dependent variables with specification of a normal distribution and an identity link function and a binary distribution and a logit link function. Parameter estimates with a p value of less than .01 were accepted as statistically significant. Parameter estimates with a p value between .01 and .05 were accepted as nonsignificant trends in the data worthy of mention.
Generalized estimating equations
Finally, generalized estimating equations were used to document patterns of change in markers of emotional–behavioral difficulties occurring within each cluster from 6th through 12th grade. Generalized estimating equations represent an extension of the generalized linear model that corrects estimates of standard errors to account for the correlated nature of measurements collected repeatedly from the same individual over time (for further discussion, see Hardin & Hilbe, Reference Hardin and Hilbe2003). The GENMOD procedure available in SAS (SAS Institute, 2004) was also used to fit the generalized estimating equations. Two groups of generalized estimating equations were conducted.
The first group of generalized estimating equations was done to characterize (a) the nature of the correlation matrix for the repeated measurements and (b) the pattern of change over time for each marker of emotional (negative mood, physiologic manifestations of anxiety, and social anxiety), behavioral (delinquent behavior and use of alcohol), and academic competence (grade point average and classroom adjustment). In this first series of generalized estimating equations, time was coded so that the intercept represented the status of the sample during 6th grade and the slope represented change from 6th to 12th grade. Linear, quadratic, and cubic functions of time were entered as the independent variables with specification of different patterns of correlation among the repeated measurements to determine the nature of the correlation matrix and the pattern of change over time within the entire sample for each of the seven dimensions assessing emotional–behavioral difficulties and academic competence. Within this series of statistical analyses, the Quasi–Akaike information criterion statistic proposed by Pan (Reference Pan2001) was used to make comparative judgments about optimal representation of the correlation matrix and change over time. The distribution, link function, correlation matrix, and pattern of change for each marker of emotional–behavioral difficulty and academic competence derived from this preliminary series of generalized estimating equations are listed in Table 1.
Specifications for entry of the seven markers of emotional–behavioral difficulty and academic competence into the generalized estimating equation analyses
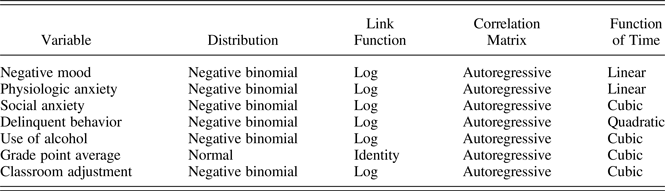
Note: Because of significant negative skew, the distribution of classroom adjustment was reflected and then entered into the generalized estimating equation analysis with the specifications noted above.
The second group of generalized estimating equations was done to test for between-cluster differences in markers of emotional–behavioral difficulties from 6th to 12th grade. In this series of statistical analyses, categorical coding of cluster membership was entered as the independent variable. Time was again coded so that the intercepts represented the status of the clusters during 6th grade and the slopes represented change within each cluster from 6th to 12th grade. Depending on the dimension of emotional–behavioral difficulties being considered, linear, quadratic, or cubic representation of time was entered as an independent variable as specified in Table 1. Pairwise comparison to a large cluster of students taken as a normative group was again used to document between-cluster differences in emotional–behavioral difficulties from 6th to 12th grade. Specific markers of emotional–behavioral difficulties were entered as the dependent variables with specification of the distribution, link function, and pattern of correlation over time indicated in Table 1. Parameter estimates with a p value of less than .01 were accepted as statistically significant. Parameter estimates with a p value between .01 and .05 were accepted as nonsignificant trends in the data worthy of mention.
Results
Part 1: Emotional–behavioral difficulty predicting academic competence
Emotional–behavioral clusters
The results of the cluster analysis representing patterns of emotional–behavioral difficulty during 6th grade are summarized in Table 2. The correlation of the variables used to define the emotional–behavioral clusters ranged from .16 for the correlation of social anxiety with use of alcohol to .58 for the correlation of negative mood with physiologic manifestations of anxiety. Comparative evaluation of solutions defining two to six clusters suggested that a four-cluster solution offered the best representation of the data. As expected, this solution produced four clusters of students characterized by (a) minimal emotional–behavioral problems (minimal, n = 145), (b) internalizing distress (internalizing, n = 86), (c) externalizing difficulty (externalizing, n = 47), and (d) both internalizing and externalizing difficulty (multiproblem, n = 41). The four clusters represented 45.45%, 26.96%, 14.73%, and 12.85% of the sample, respectively. Table 2 presents descriptive statistics for the five markers of emotional–behavioral difficulty as measured during 6th grade.
Descriptive statistics for the emotional–behavioral clusters
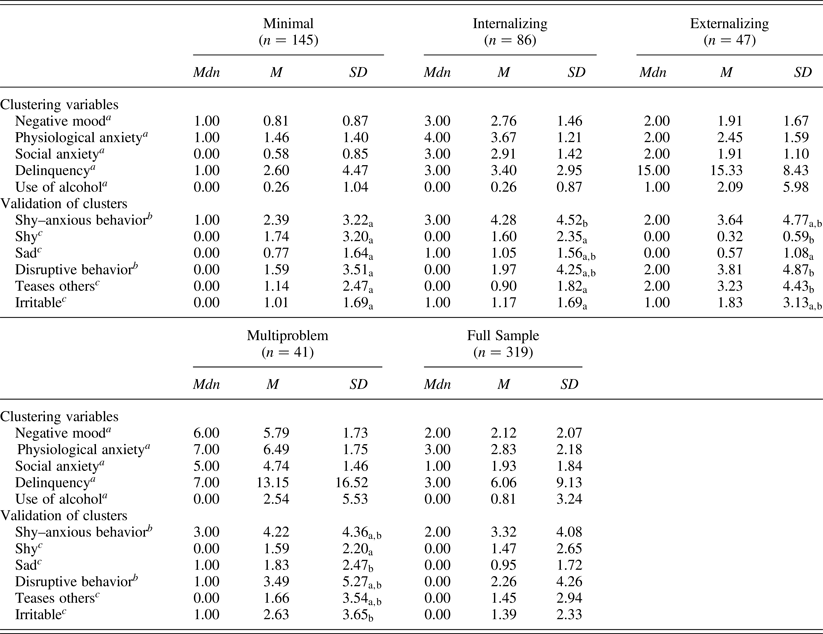
Note: N = 319. Descriptive statistics for clusters with different subscript letters differed significantly (p < .01) from each another in a generalized linear analysis done with designation of a negative binomial distribution and a log link function.
a Measures collected through self-report.
b Measures collected through teacher rating.
c Measures collected through peer nomination.
Consideration of the four-cluster solution from the perspective of risk for serious emotional–behavioral difficulty indicated that there was logically consistent distribution of risk within the four clusters. For example, 21.74% of the students in the full sample demonstrated clinically meaningful risk for difficulty with internalizing symptoms in the form of depressive symptoms, generalized anxiety, and social anxiety. Within the multiproblem and internalizing clusters, 94.44% and 28.00% of the students demonstrated clinically meaningful risk. Likewise, 12.62% of the students in the full sample demonstrated clinically meaningful risk for serious involvement in delinquent behavior because of physically assaultive behavior. Within the externalizing and multiproblem clusters, 68.89% and 63.41% of the students demonstrated clinically meaningful risk. Finally, 21.59% of the students in the full sample demonstrated risk for serious difficulty with substance use during adolescence through early use of alcohol. Within the externalizing and multiproblem clusters, 55.32% and 38.46% of the students demonstrated clinically meaningful risk.
Cross-informant validation of clusters
As noted in Table 2, there were theoretically consistent between-cluster differences in teacher ratings and peer nominations that validated the four-cluster solution. When compared with the other clusters, the internalizing cluster was, by teacher rating, characterized as more shy and anxious than the minimal cluster, χ2 (1 df, N = 319) = 9.21, p = .0024. The externalizing cluster was, by teacher report, characterized as more disruptive in the classroom than the minimal cluster, χ2 (1 df, N = 319) = 8.58, p = .0034; and there was a nonsignificant trend for this cluster to be characterized as more disruptive than the internalizing cluster. The externalizing cluster was, by peer nomination, also characterized as less shy than the internalizing and minimal clusters, χ2 (1 df, N = 319) = 18.55, p < .0001 and χ2 (1 df, N = 319) = 21.97, p < .0001, and more likely to tease others than the internalizing and minimal clusters, χ2 (1 df, N = 319) = 18.13, p < .0001 and χ2 (1 df, N = 319) = 15.56, p < .0001. In a nonsignificant trend, this cluster was also characterized as more irritable than the minimal cluster. Finally, the multiproblem cluster was, by peer nomination, characterized as more irritable than the minimal or internalizing clusters, χ2 (1 df, N = 319) = 14.24, p = .0002 and χ2 (1 df, N = 319) = 8.53, p = .0035. This cluster was also characterized as more shy than the externalizing cluster, χ2 (1 df, N = 319) = 15.18, p < .0001, and sadder than the externalizing and minimal clusters, χ2 (1 df, N = 319) = 11.57, p = .0007 and χ2 (1 df, N = 319) = 11.33, p = .0008. There were also nonsignificant trends for this cluster to be characterized as sadder than the internalizing cluster and both more disruptive and more shy and anxious than the minimal cluster.
Cluster differences in age and gender
Generalized linear analyses done to test for between-cluster differences in age and gender indicated that, when the other clusters were each compared with the minimal cluster, there were no significant differences in age. There were, however, significant relationships involving the distribution of gender. There was no significant difference in the presence of girls (55.86%) versus boys (44.14%) within the minimal cluster, χ2 (1 df, N = 319) = 1.98, p = .16. However, when the distribution of gender within the other clusters was compared with the distribution of gender within the minimal cluster, girls were less likely to be assigned to the externalizing and multiproblem clusters. Although girls represented 55.86% of the minimal cluster, they only represented 23.40% of the externalizing cluster and 31.71% of the multiproblem cluster, χ2 (1 df, N = 319) = 13.77, p = .0002 and χ2 (1 df, N = 319) = 7.15, p = .007.
Cluster differences in patterns of academic competence
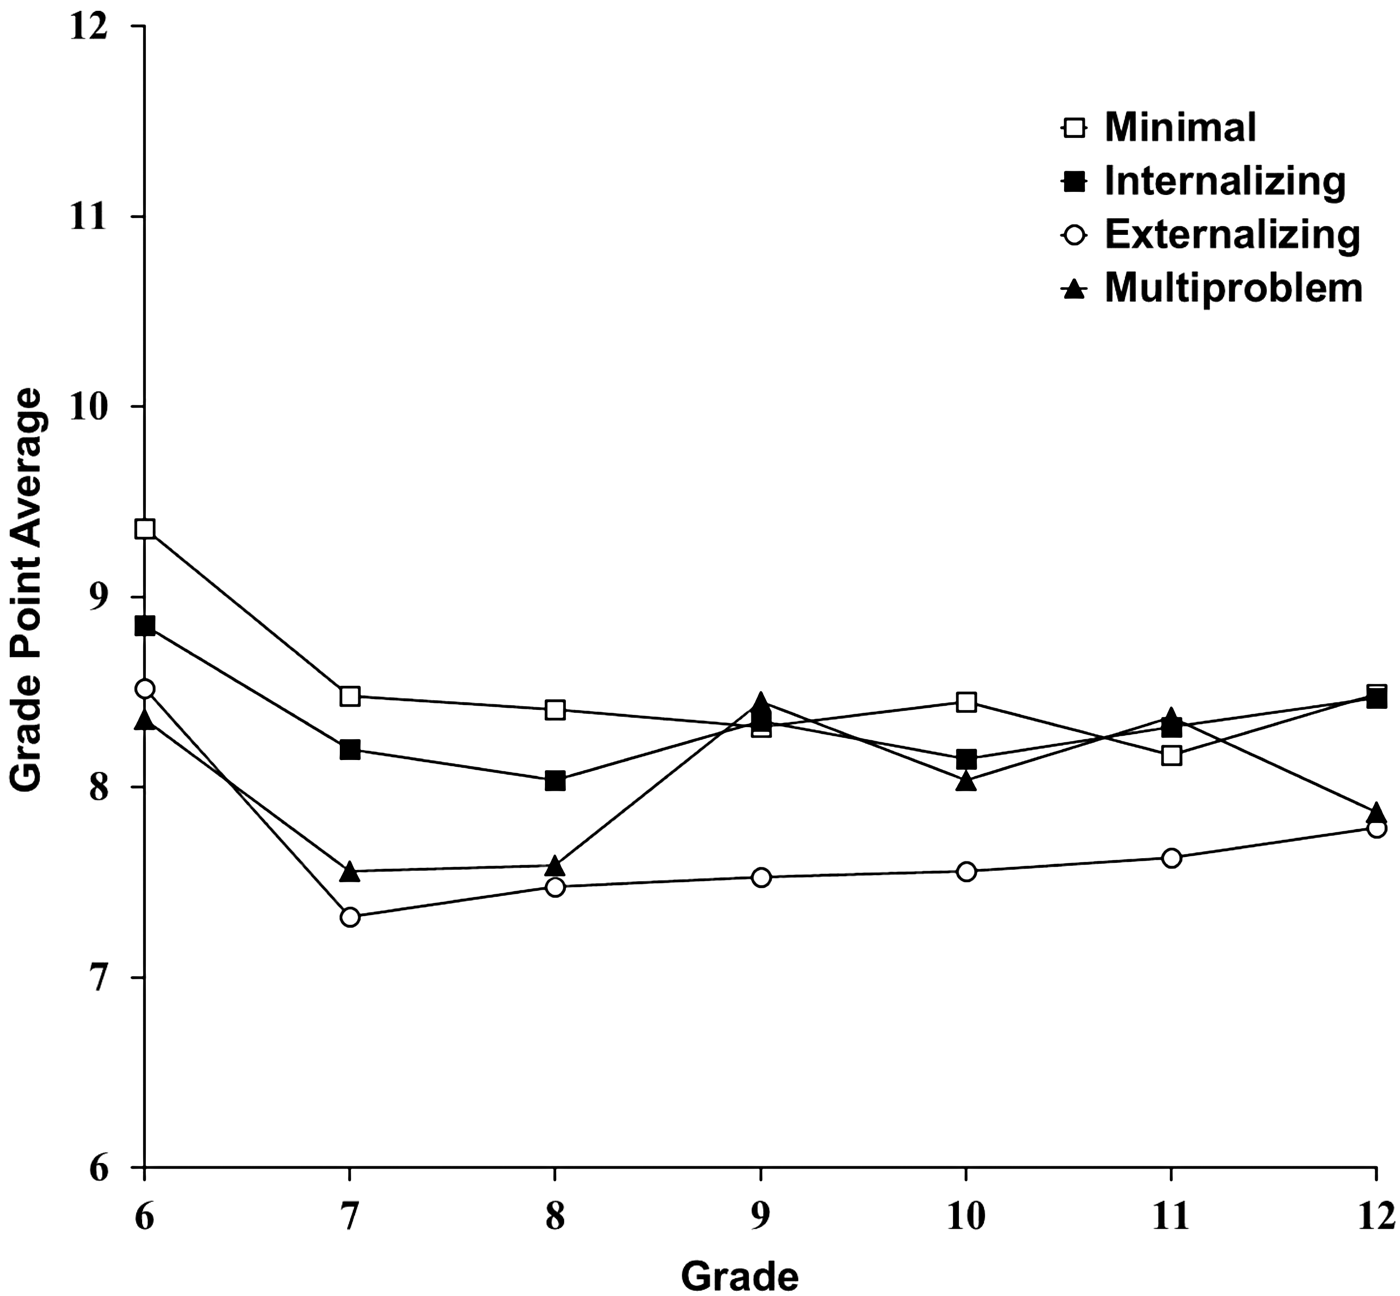
The minimal cluster demonstrated a grade point average approximately equal to a B+ during 6th grade and, as shown in Figure 1, exhibited a deteriorating pattern from 6th to 9th grade followed by an increase during 10th and another decline from 10th to 12th (z = –5.79, p < .0001, z = 3.87, p = .0001, and z = –2.95, p = .0032) for the tests of linear, quadratic, and cubic change over time. When compared with this cluster of students, both the externalizing and multiproblem clusters demonstrated significantly lower grade point averages in 6th grade that still represented a B average (z = –2.98, p = .0029 and z = –3.00, p = .0027). There was also a nonsignificant trend for the internalizing cluster to demonstrate lower grades during 6th grade. When the other three clusters were compared with the minimal cluster, there were no significant differences in the rate of linear, quadratic, or cubic change over time. No cluster had a mean grade point average from 6th to 12th that represented anything less than a B average.
Change in grade point average for the emotional–behavioral clusters. The full range of the scale for grade point average is 0 to 12.
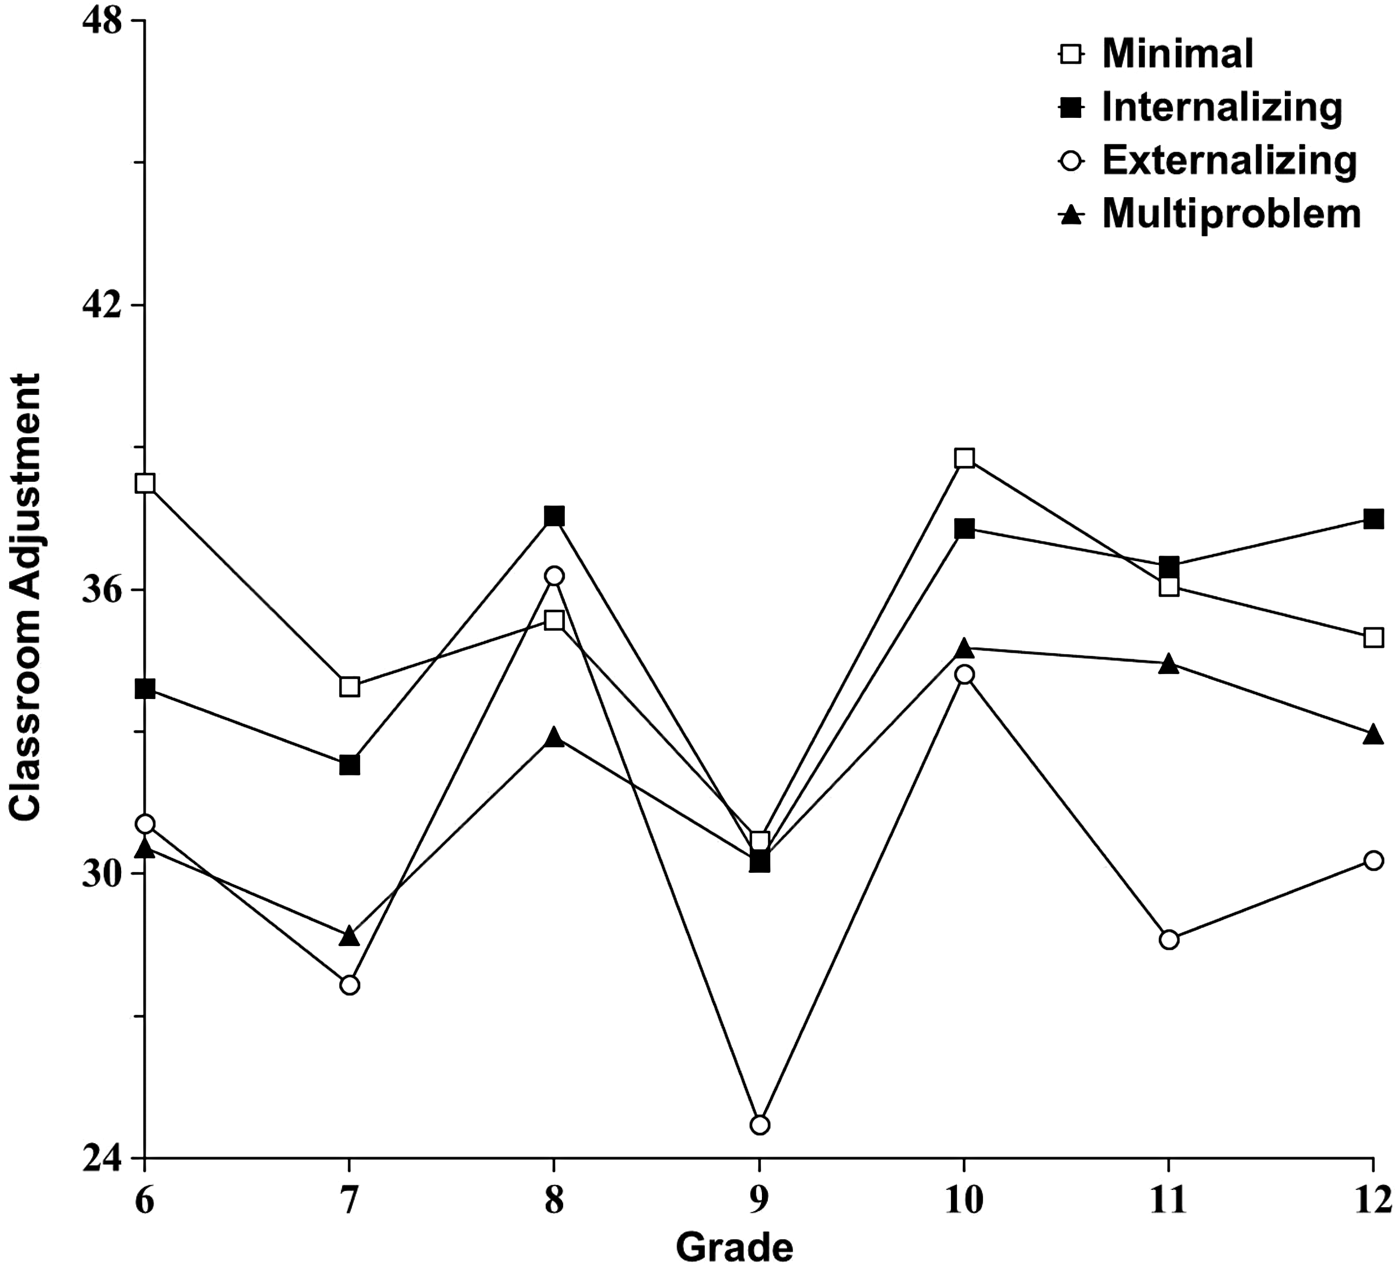
As seen in Figure 2, the minimal cluster demonstrated relatively positive classroom adjustment during 6th grade with a deteriorating pattern from 6th to 9th grade followed by an increase during 10th and another decline from 10th to 12th (z = –6.24, p < .0001, z = 5.47, p < .0001, and z = –4.82, p < .0001) for the tests of linear, quadratic, and cubic change over time. When compared with the minimal cluster, the internalizing, externalizing, and multiproblem clusters demonstrated significantly poorer classroom adjustment during 6th grade (z = –2.88, p = .0039, z = –3.62, p = .0003, and z = –3.76, p = .0002). Both the internalizing and externalizing clusters demonstrated a similar, but significantly less dramatic, change in classroom adjustment over time as compared to the minimal group. For the internalizing cluster, the markers of linear, quadratic, and cubic change were significantly less than those for the minimal cluster (z = 3.87, p = .0001, z = –3.30, p = .001, and z = 3.00, p = .0027). For the externalizing cluster, the markers of linear and quadratic change were significantly less than those for the minimal cluster (z = 3.00, p = .0027 and z = –2.61, p = .0091). There was also a nonsignificant trend for the marker of cubic change to be less than that for the minimal cluster.
Change in classroom adjustment for the emotional–behavioral clusters. The full range of the scale for classroom adjustment is 0 to 48.
Part 2: Academic competence predicting emotional–behavioral difficulty
Academic clusters
The results of the cluster analysis representing patterns of academic competence during 6th grade are summarized in Table 3. Correlation of the two variables used to define the academic clusters was .58. Comparative evaluation of solutions defining two to six clusters suggested that a five-cluster solution offered the best representation of the data. As noted in Table 3, the five clusters of students characterized by (a) high grades representing an A– average with high classroom adjustment (HG-HCA, n = 91), (b) medium high grades representing a B+ range with average classroom adjustment (MHG-MCA, n = 71), (c) medium grades representing a B average with average classroom adjustment (MG-MCA, n = 64), (d) medium grades representing a B– average and very low classroom adjustment (MG-VLCA, n = 41), and (e) low grades representing a C+ average with low classroom adjustment (LG-LCA, n = 51). The five clusters represented 28.53%, 22.57%, 20.06%, 12.85%, and 15.99% of the sample, respectively.
Descriptive statistics for the academic clusters
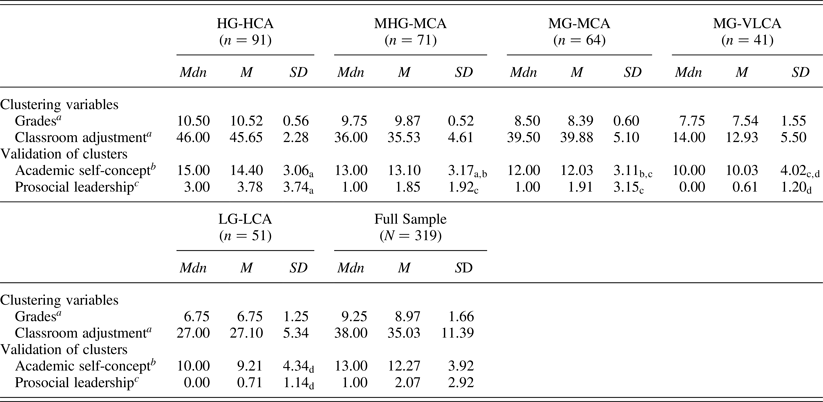
Note: N = 319. HG-HCA, high grades-high classroom adjustment; MHG-MCA, medium high grades-medium classroom adjustment; MG-MCA, medium grades-medium classroom adjustment; MG-VLCA, medium grades-very low classroom adjustment; LG-LCA, low grades-low classroom adjustment. Because of missing data, n = 309 for academic self-concept. Descriptive statistics for clusters with different subscript letters differed significantly (p < .01) from one another in a generalized linear analysis done with designation of a negative binomial distribution and a log link function.
a Measures collected through teacher rating.
b Measures collected through self-report.
c Measures collected through peer nomination.
Consideration of the five-cluster solution from the perspective of risk for academic failure indicated that there was logically consistent distribution of risk within the five clusters. For example, 9.72% of the students in the full sample demonstrated clinically meaningful risk for academic failure because of a grade below a C– in a core academic subject. Within the LG-LCA and MG-VLCA clusters, 27.45% and 24.39% of the students demonstrated clinically meaningful risk, respectively. Similarly, 18.18% of the students in the full sample demonstrated clinically meaningful risk for academic failure because of serious deficits in positive classroom behavior. Within the MG-VLCA and LG-LCA clusters, 100% and 31.37% of the students demonstrated clinically meaningful risk, respectively.
Cross-informant validation of the clusters
As noted in Table 3, there were theoretically consistent between-cluster differences in self-rating of academic competence and peer nominations for prosocial leadership that validated the five-cluster solution. When compared with the other clusters, the HG-HCA cluster described itself as more academically competent than the MG-MCA, MG-VLCA, and LG-LCA clusters, χ2 (1 df, N = 319) = 16.94, p < .0001; χ2 (1 df, N = 319) = 34.41, p < .0001; and χ2 (1 df, N = 319) = 47.24, p < .0001, respectively. There was also a nonsignificant trend for this cluster to describe itself as more academically competent than the MHG-MCA cluster. Similarly, the MHG-MCA cluster described itself as more academically competent than the MG-VLCA and the LG-LCA clusters, χ2 (1 df, N = 319) = 6.62, p = .01; and χ2 (1 df, N = 319) = 20.25, p = .0003, respectively. The MG-MCA cluster also described itself as more competent than the LG-LCA cluster, χ2 (1 df, N = 319) = 8.72, p = .0032; and there was also a nonsignificant trend for this cluster to describe itself as more academically competent than the MG-VLCA cluster.
When compared with the other clusters, the HG-HCA cluster received more peer nominations for prosocial leadership than the MHG-MCA, MG-MCA, MG-VLCA, and LG-LCA clusters, χ2 (1 df, N = 319) = 13.17, p = .0003; χ2 (1 df, N = 319) = 11.27, p = .0008; χ2 (1 df, N = 319) = 438.37, p < .0001; and χ2 (1 df, N = 319) = 40.51, p < .0001, respectively. Likewise, the MHG-MCA cluster received more peer nominations for prosocial leadership than the MG-VLCA and LG-LCA clusters, χ2 (1 df, N = 319) = 13.79, p = .0002; and χ2 (1 df, N = 319) = 12.79, p = .0003, respectively. Moreover, the MG-MCA cluster received more peer nominations for prosocial leadership than the MG-VLCA and LG-LCA clusters, χ2 (1 df, N = 319) = 14.18, p = .0002; and χ2 (1 df, N = 319) = 13.19, p = .0003, respectively.
Cluster differences in age and gender
Generalized linear analyses revealed no significant between-cluster differences in age when the HG-HCA cluster was compared with the other four clusters. There was, however, a nonsignificant trend for the MG-MCA cluster to be somewhat older than the HG-HCA cluster. There were also significant differences involving the distribution of gender within the academic clusters. Girls (67.03%) were overrepresented in the HG-HCA cluster, χ2 (1 df, N = 319) = 10.13, p = .0015. When compared with the HG-HCA cluster, girls were underrepresented in the lower achieving clusters. Although girls represented 67.03% of the HG-HCA cluster, they represented only 45.31% of the MG-MCA cluster, 21.95% of the MG-VLCA cluster, and 35.29% of the LG-LCA cluster, χ2 (1 df, N = 319) = 7.15, p = .007; χ2 (1 df, N = 319) = 20.37, p < .0001; and χ2 (1 df, N = 319) = 12.77, p = .0004, respectively.
Cluster differences in patterns of emotional–behavioral difficulty
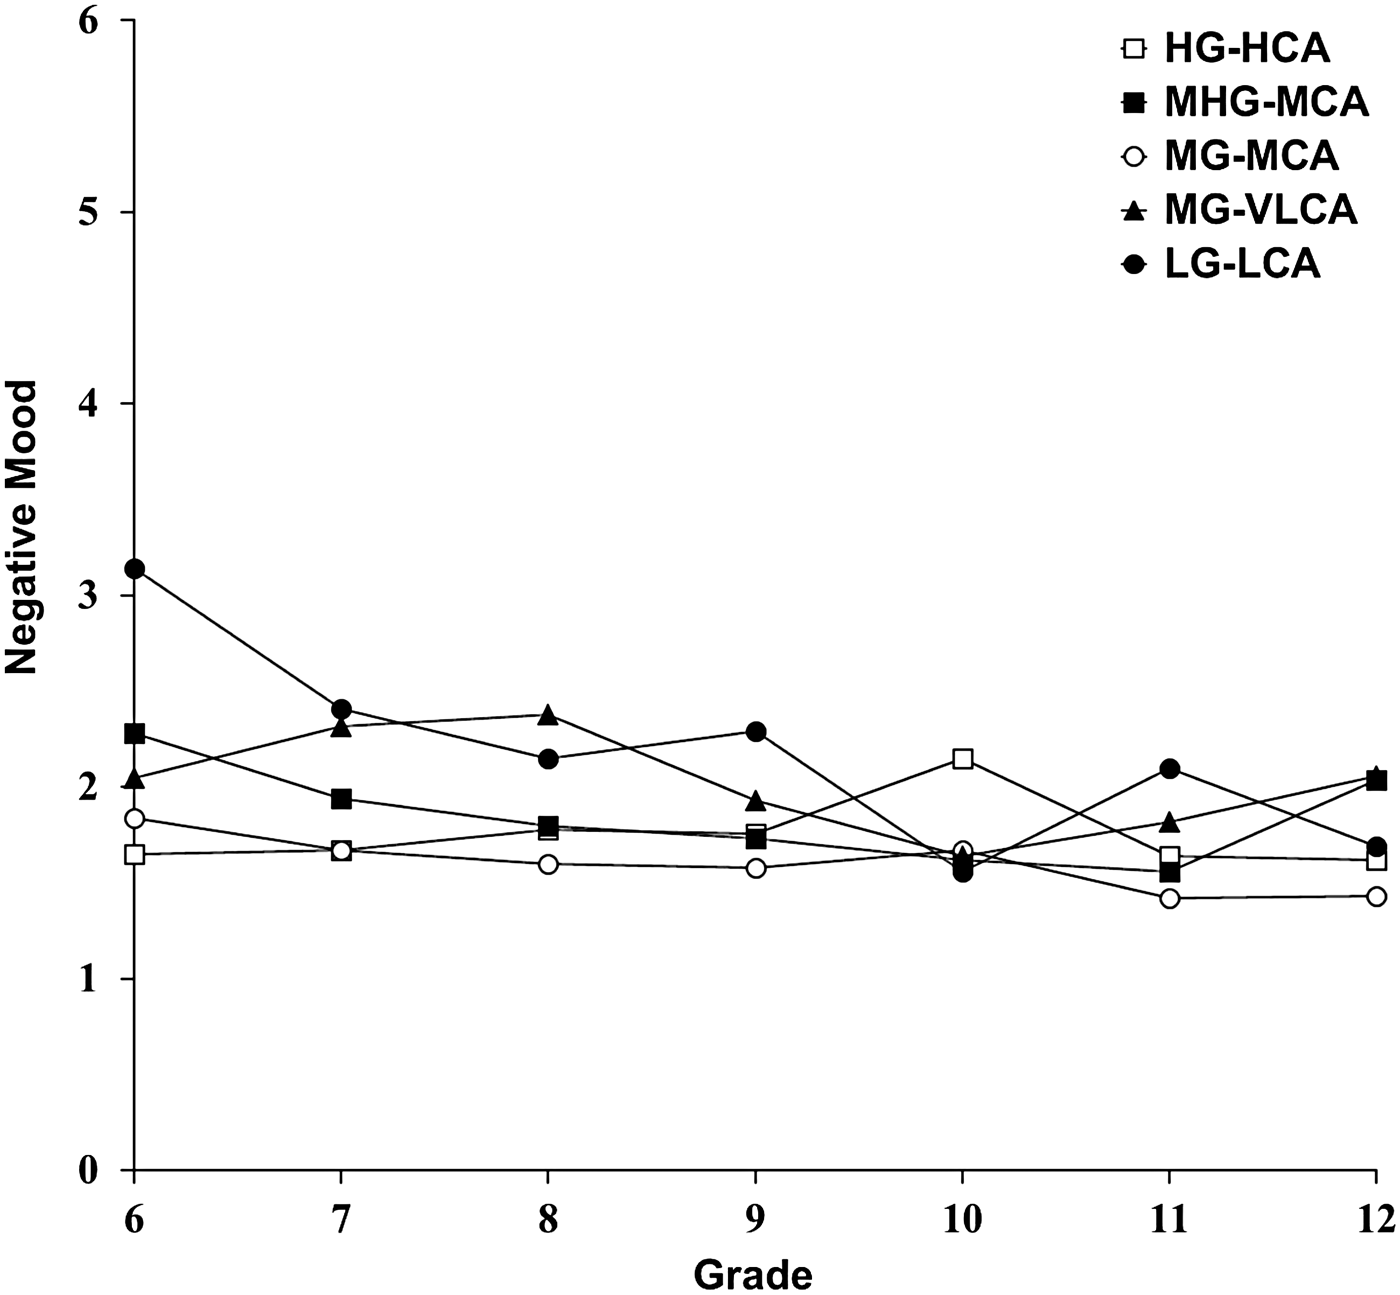
The results of the generalized estimating equations done to test for significant between-cluster differences in emotional–behavioral difficulty from 6th to 12th grade are summarized in Figures 3 to 7. As noted in Figure 3, the HG-HCA cluster demonstrated relatively few depressive symptoms during 6th grade (z = 5.34, p < .0001), with no significant change in negative mood from 6th to 12th grade. When compared with this cluster, the LG-LCA cluster demonstrated more depressive symptoms during the 6th grade (z = 3.67, p = .0002). The rate of linear change within this cluster also differed significantly from the HG-HCA cluster such that this cluster demonstrated a significant decline in depressive symptoms over time (z = –3.15, p = .0017). The other three clusters did not differ significantly in terms of depressive symptoms present during 6th grade or the rate of linear change over time.
Change in negative mood for the academic clusters. HG-HCA, high grades–high classroom adjustment; MHG-MCA, medium high grades–medium classroom adjustment; MG-MCA, medium grades–medium classroom adjustment; MG-VLCA, medium grades–very low classroom adjustment; LG-LCA, low grades–low classroom adjustment. The full range of the scale for negative mood is 0 to 12.
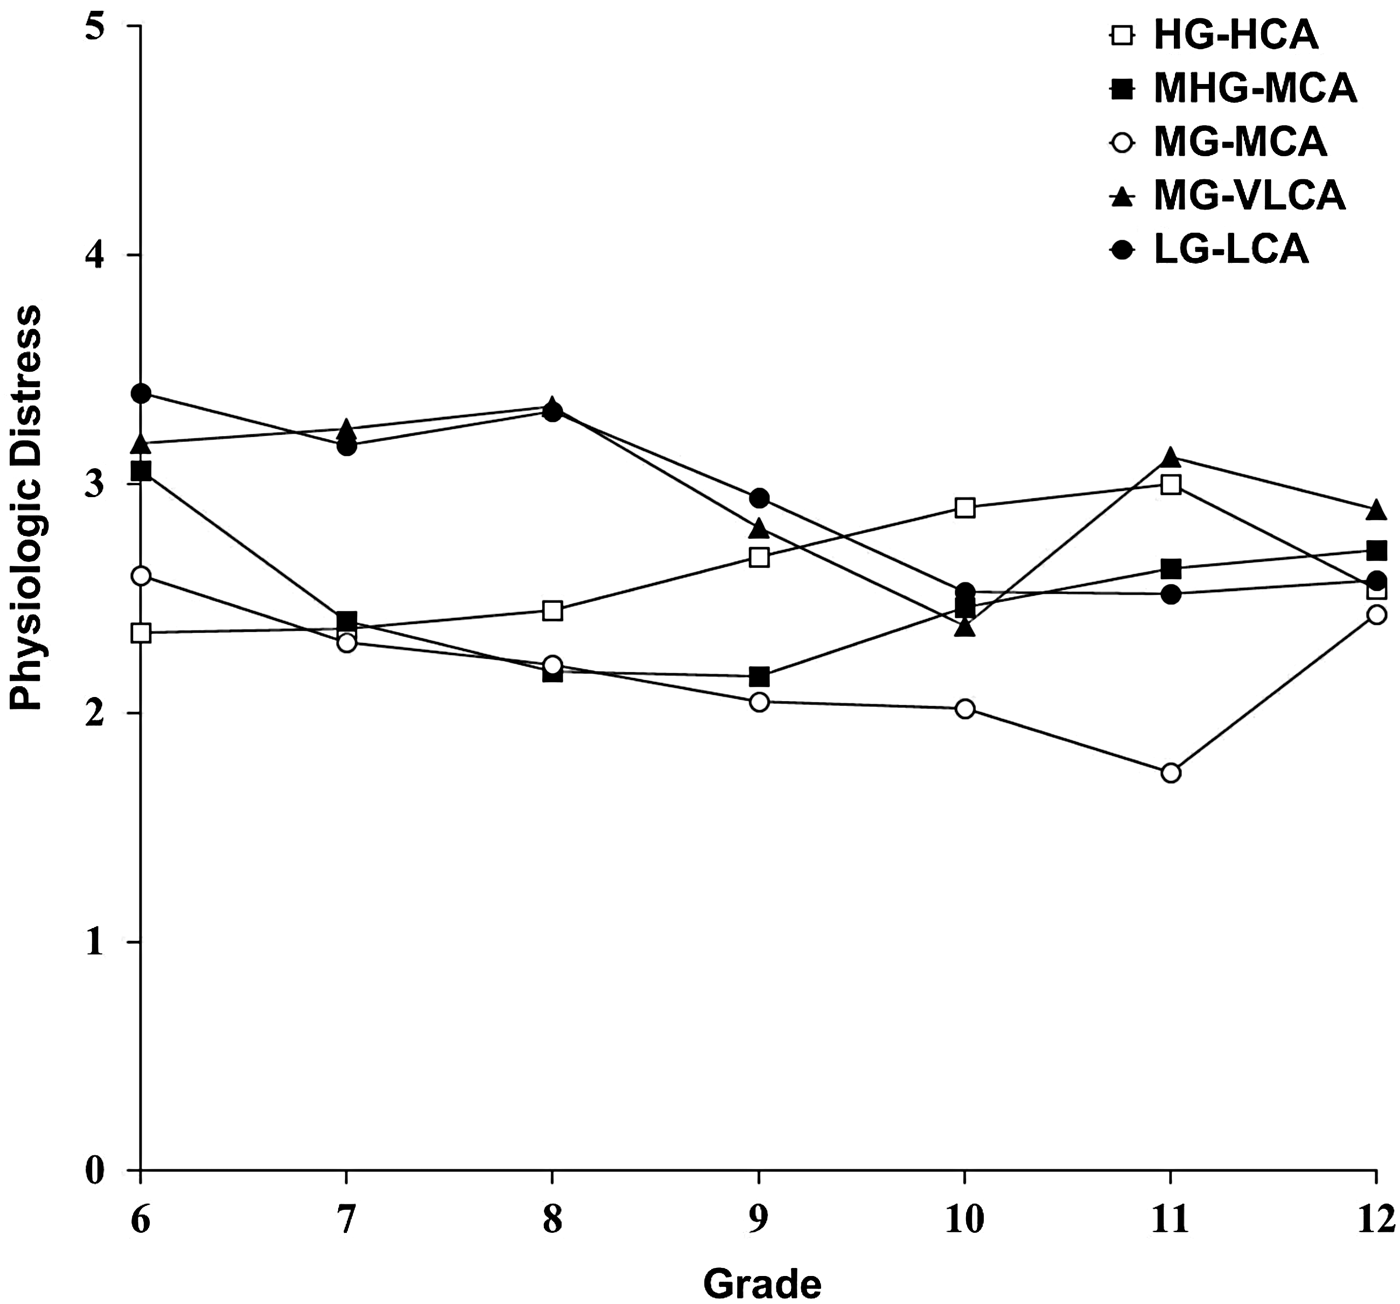
Change in physiologic distress for the academic clusters. HG-HCA, high grades–high classroom adjustment; MHG-MCA, medium high grades–medium classroom adjustment; MG-MCA, medium grades–medium classroom adjustment; MG-VLCA, medium grades–very low classroom adjustment; LG-LCA, low grades–low classroom adjustment. The full range of the scale for physiologic distress is 0 to 10.
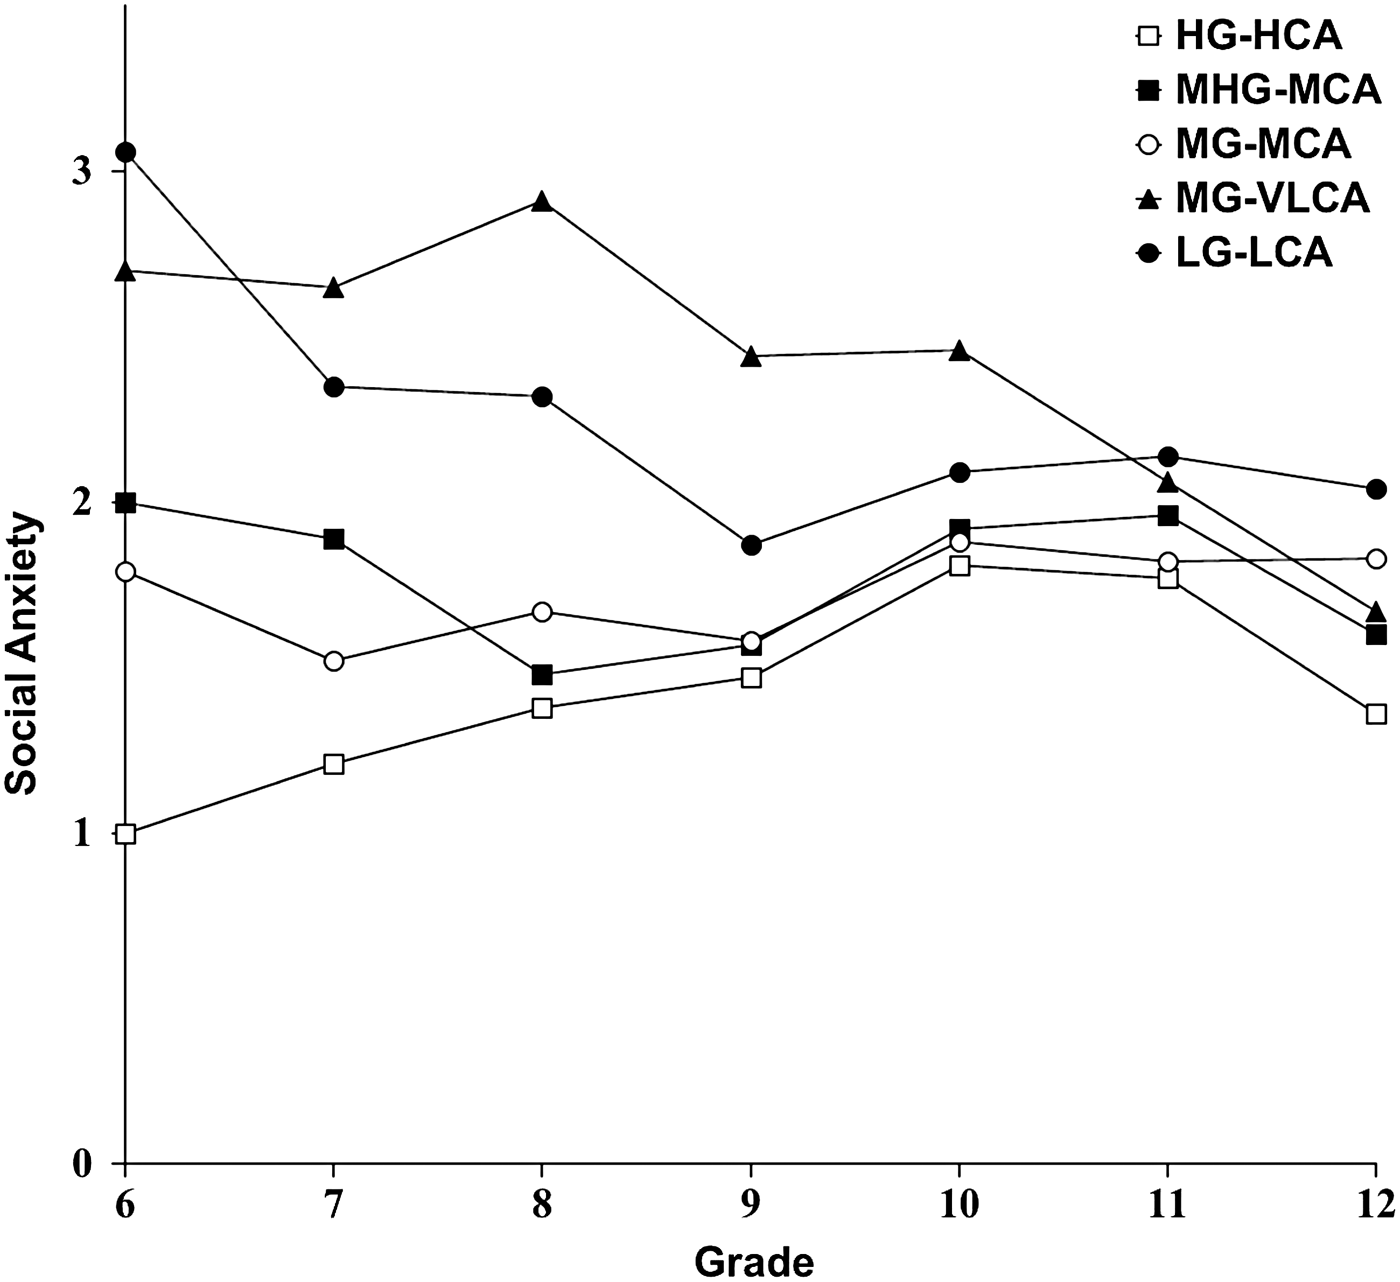
Change in social anxiety for the academic clusters. HG-HCA, high grades–high classroom adjustment; MHG-MCA, medium high grades–medium classroom adjustment; MG-MCA, medium grades–medium classroom adjustment; MG-VLCA, medium grades–very low classroom adjustment; LG-LCA, low grades–low classroom adjustment. The full range of the scale for social anxiety is 0 to 7.
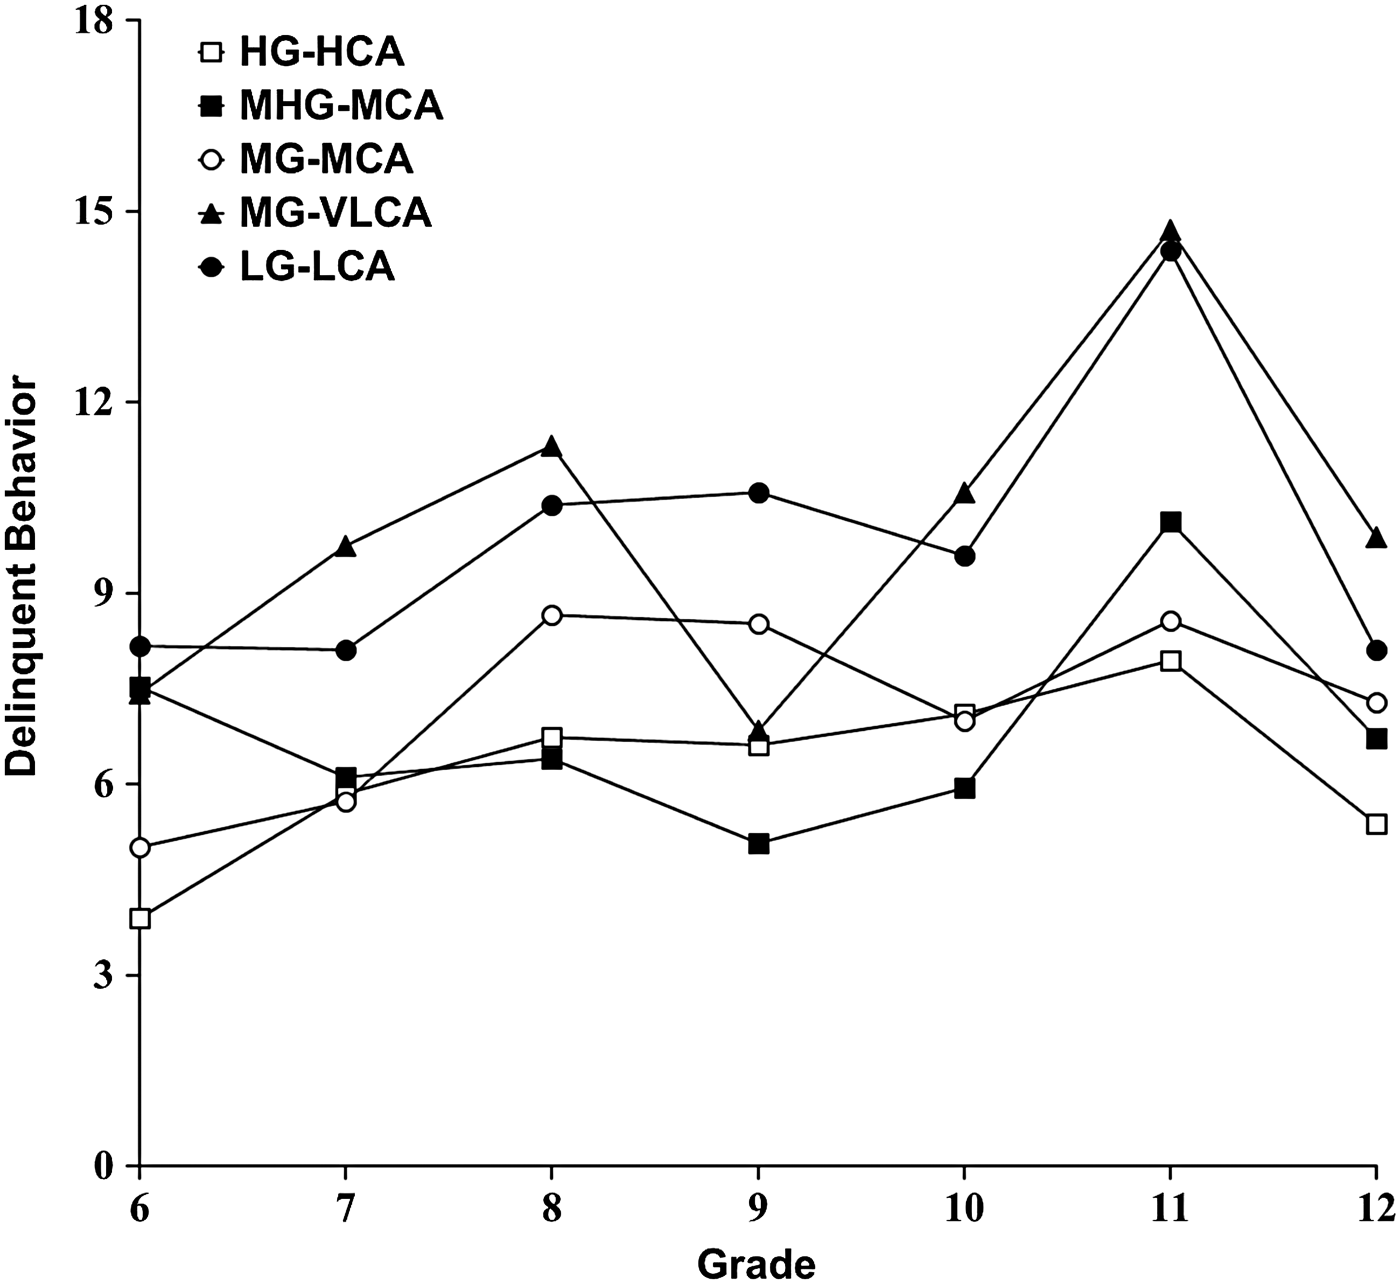
Change in delinquent behavior for the academic clusters. HG-HCA, high grades–high classroom adjustment; MHG-MCA, medium high grades–medium classroom adjustment; MG-MCA, medium grades–medium classroom adjustment; MG-VLCA, medium grades–very low classroom adjustment; LG-LCA, low grades–low classroom adjustment. The full range of the scale for delinquent behavior is 0 to 99.
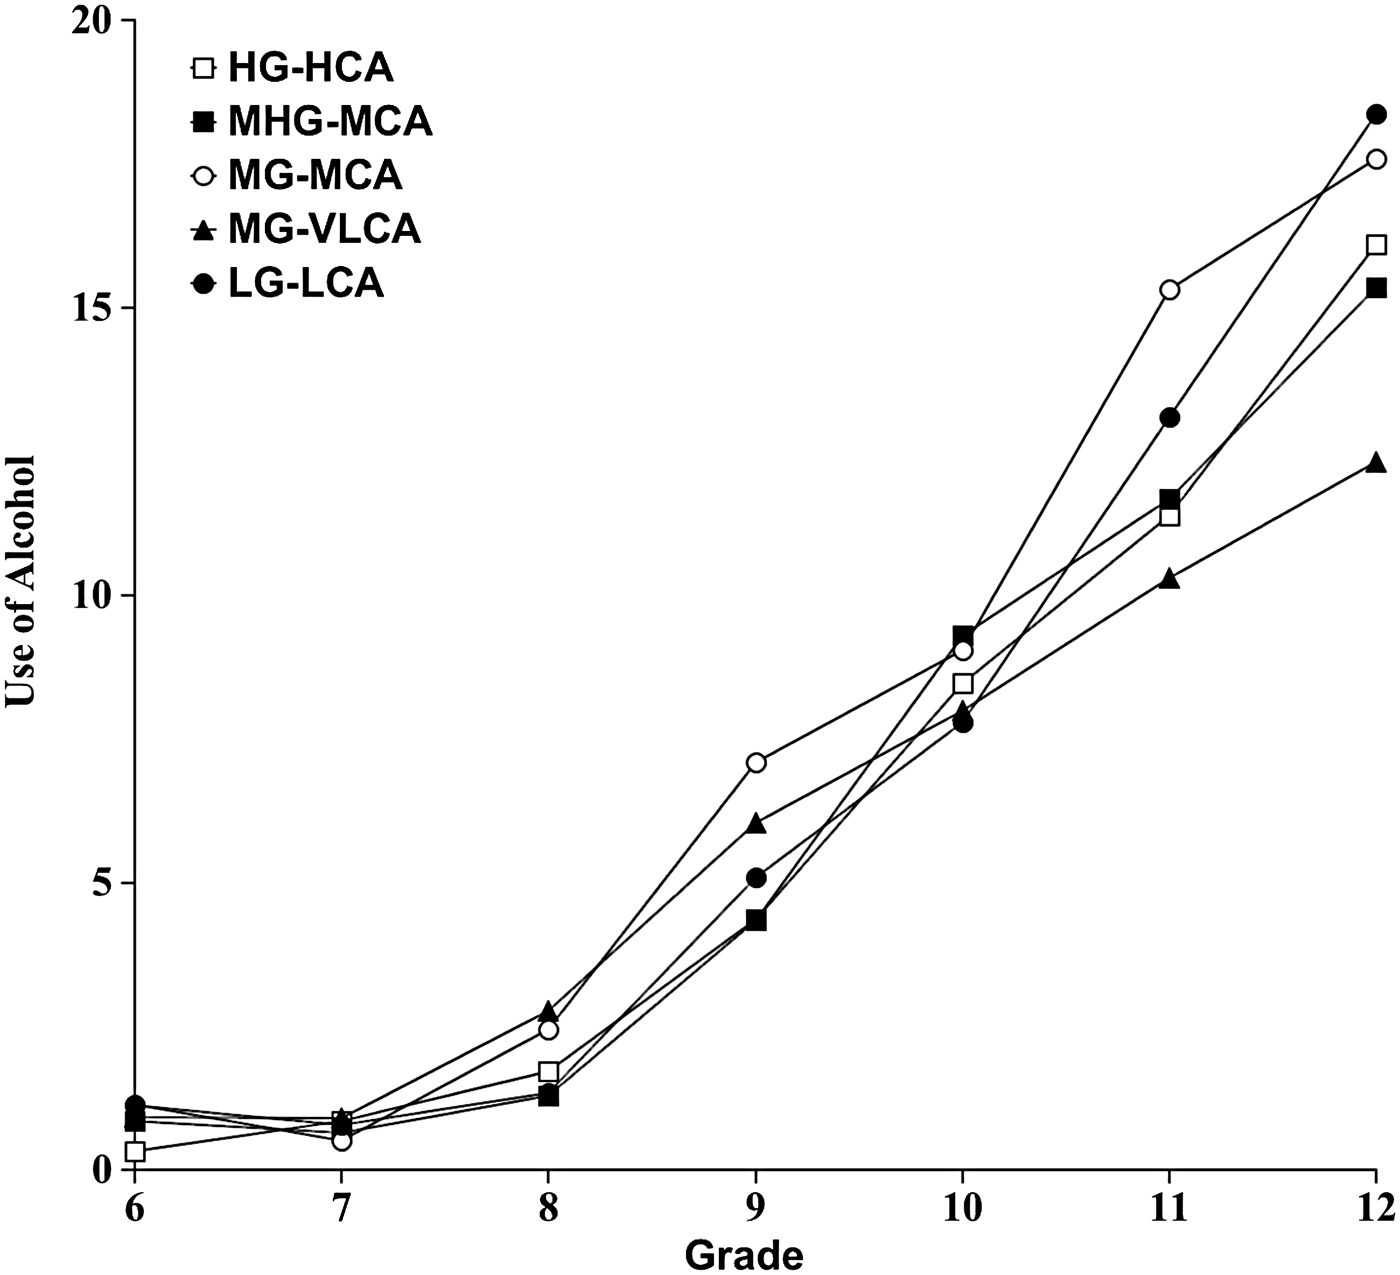
Change in the use of alcohol for the academic clusters. HG-HCA, high grades–high classroom adjustment; MHG-MCA, medium high grades–medium classroom adjustment; MG-MCA, medium grades–medium classroom adjustment; MG-VLCA, medium grades–very low classroom adjustment; LG-LCA, low grades–low classroom adjustment. The full range of the scale for use of alcohol is 0 to 40.
As noted in Figure 4, the HG-HCA cluster demonstrated relatively few physiological symptoms of anxiety during 6th grade with a nonsignificant trend involving an increase in physiological symptoms over time. When compared with this cluster, the LG-LCA cluster demonstrated more physiologic manifestations of anxiety during the 6th grade (z = 3.02, p = .0026), with a significant decline in physiological distress over time relative to the HG-HCA cluster (z = –3.32, p = .0009). There were also nonsignificant trends for the MG-VLCA cluster to report more physiologic symptoms during 6th grade and the MHG-MCA cluster to report a pattern of change that represented a nonsignificant decline in symptoms over time.
As noted in Figure 5, the HG-HCA cluster also demonstrated no significant social anxiety during 6th grade (z = –0.20, p = .84). However, there was a significant increase in social anxiety over time that attenuated significantly as students moved from 6th through 12th grade (z = 3.73, p = .0002 and z = –3.23, p = .0012) for the tests of linear and quadratic change over time. When compared with this cluster, the other four academic clusters each demonstrated significantly more social anxiety during 6th grade (z = 4.14, p < .0001 for the MHG-MCA cluster; z = 3.52, p = .0004 for the MG-MCA cluster; z = 5.83, p < .0001 for the MG-VLCA cluster; and z = 7.18, p < .0001 for the LG-LCA cluster). The MHG-MCA cluster also demonstrated a significantly less dramatic escalation of social anxiety as students moved from 6th to 12th grade, with a trend toward less dramatic attenuation of that escalation (z = –2.96, p = .0031 and z = 2.32, p = .02). The MG-MCA cluster demonstrated significantly less dramatic escalations of social anxiety with significantly less attenuation (z = –3.44, p = .0031 and z = 3.34, p = .000). When compared with the HG-HCA cluster, the rate of change in the LG-LCA differed significantly such that the cluster actually demonstrated a significant decline in social anxiety over time (z = –4.63, p < .0001 and z = 3.37, p = .0007).
As noted in Figure 6, the HG-HCA cluster demonstrated relatively little delinquent behavior during 6th grade (z = 8.54, p < .0001). There was, however, a significant escalation in delinquent behavior within this cluster that attenuated significantly as students moved from 6th to 12th grade (z = 3.57, p = .0004 and z = –3.52, p = .0004, respectively) for tests of linear and quadratic change over time. When compared with this cluster, the MG-VLCA and LG-LCA clusters demonstrated significantly more delinquent behavior during 6th grade (z = 2.65, p = .0081 and z = 3.26, p = .0011, respectively). There was also a nonsignificant trend for the MHG-MCA cluster to demonstrate more delinquent behavior during 6th grade. When compared with the HG-HCA cluster, the MHG-MCA cluster demonstrated a significantly less dramatic increase in delinquent behavior with a significantly less dramatic attenuation of the increase as students moved from 6th to 12th grade (z = –2.78, p = .0054 and z = 3.04, p = .0024, respectively). There were no other significant differences in the rate of linear or quadratic change over time.
Finally, the HG-HCA cluster demonstrated very little experimentation with alcohol during 6th grade (z = –2.31, p = .02). As noted in Figure 7, there was, however, a significant linear escalation in use of alcohol as students moved from 6th to 12th grade (z = 9.47, p < .0001). There were no significant differences from this pattern of change within the other clusters.
Discussion
The findings from this seven-wave investigation of affluent suburban youth contribute to our nascent understanding of concurrent and prospective associations between emotional–behavioral difficulty and academic competence within this population. Broadly, the results suggest that this is a sample of privileged youth with relatively high levels of emotional, behavioral, and academic adjustment. More specifically, results from Part 1 of the study revealed that there were statistically significant group differences on academic outcomes for youth clustered on dimensions of emotional–behavioral problems. It is noteworthy that these results suggest that among privileged youth, whatever concurrent associations among emotional–behavioral–achievement were apparent at 6th grade were maintained over time. Perhaps most important, the results of both Parts 1 and 2 of the study provide little to no evidence of temporal precedence. Accordingly, these findings suggest that the nature of the relationship between emotional–behavioral difficulty and achievement within this sample is likely to be reciprocal as opposed to prospective. In other words, it is unlikely that maladjustment in one area paves the way for eventual maladjustment in another area. Instead, the associations appear to be concurrent and sustained over time during this period of development in this specific context.
A parallel but slightly varied pattern emerged in Part 2. Just as youth appeared relatively well adjusted in terms of the emotional–behavioral dimensions examined in Part 1 of the study, the same youth grouped on academic indices in Part 2 also demonstrated relatively high academic achievement. Even though a low grade point average and low classroom adjustment (LC-LCA) group emerged, the grade point average of that group was still a C+ (a group of youth that was not necessarily in academic jeopardy). In terms of the question of substantive interest, expected between-cluster differences did emerge with the lowest achieving group demonstrating the highest levels of emotional–behavioral difficulties. Furthermore, as in Part 1, with few exceptions, the between-group differences in emotional and behavioral outcomes detected during 6th grade were relatively stable. Cumulatively, these findings suggest a general pattern of relative positive adjustment with continuity in between-cluster differences in emotional–behavioral–achievement associations over time.
Thus, the present findings, garnered across six annual assessments, contribute to the emerging developmental psychopathology literature concerning affluent youth in three substantive ways. First, the findings suggest that within this privileged sample of suburban teens, there were relatively high levels of emotional, behavioral, and academic adjustment throughout adolescence. Second, these results suggest relatively robust continuity in emotional–behavioral–achievement associations in the lives of affluent youth traversing adolescence. With few exceptions, the concurrent associations evident during 6th grade were generally the same during 12th grade. Third, the last important contribution to the literature concerns the finding that the nature of the relationship between emotional–behavioral difficulty and achievement among privileged youth is likely to be a reciprocal one, because no clear pattern of prospective associations was evident within the study.
Evidence of concurrent and stable cross-domain associations
Part 1
Our hypothesis regarding cluster membership was supported given the emergence and validation of four clusters reflecting the following groups during 6th grade: (a) minimal or those reporting low emotional–behavioral difficulty, (b) internalizing or those reporting higher levels of depression and two forms of anxiety, (c) externalizing or those reporting more delinquency and more alcohol use, and (d) multiproblem or those with mixed internalizing and externalizing difficulties. Although the results are generally consistent with the clusters obtained by Ansary and Luthar (Reference Ansary and Luthar2009), who observed similar associations within a different community of affluent high schoolers, there is a notable difference between these two studies. In the current investigation, a clear externalizing behavior problem cluster emerged with relatively high levels of self-reported delinquency, whereas Ansary and Luthar (Reference Ansary and Luthar2009) found two drug-using clusters reporting relatively limited delinquent activity. Given the young age of the sample in this study at baseline and the extremely low incidence of substance use during 6th grade, we did not expect nor obtain high frequencies of alcohol use (i.e., the drug primarily used by youth in this sample at baseline) and thus did not expect a unique substance-using group. With regard to the low levels of alcohol use during 6th grade, less than 15% of 12- to 13-year-olds in the general population report any use of alcohol without parental permission (Substance Abuse and Mental Health Services Administration, 2013).
Between-cluster differences
In terms of our hypotheses regarding between-cluster differences on the two indices of academic achievement, our expectations were partially supported. First, when compared to the minimal cluster, all other groups had relatively poorer academic grades and classroom adjustment. For grades, the difference was only marginally significant when the minimal and internalizing groups were compared. It is important to note that these concurrent between-group differences, though significant, do not represent vast discrepancies in academic performance across the groups: the externalizing and multiproblem clusters, who scored lowest on both grades and classroom adjustment, had no less than a B average during 6th grade, whereas the minimal group demonstrated a B+ average. Second, while it was expected that greater declines on the two indicators of academic competence would be present for the multiproblem group across the 7 years, this was not borne out in the results. Nonetheless, while multiproblem youth did not decline in achievement over time, they were comparatively lower than the minimal group on the academic outcomes during 6th grade and their relative ranking compared to this group was sustained across the duration of the study. This general trend is evident in prior work documenting the sustained underachievement of multiproblem youth in affluent settings (Ansary & Luthar, Reference Ansary and Luthar2009) as well as in more varied socioeconomic environments (Ensminger & Joun, Reference Ensminger, Joun and Jessor1998; Roeser et al., Reference Roeser, Eccles and Strobel1998).
Part 2
The findings from Part 2 of the investigation also yielded somewhat surprising results suggesting relatively good emotional–behavioral adjustment for nearly all groups clustered on academic indices during 6th grade. Although there are some theoretical consistencies in the clusters we obtained, our explicit hypothesis regarding the cluster structure was only partially supported. As expected, three groups exhibited grades that were commensurate with their levels of classroom adjustment (i.e., HG-HCA, MG-MCA, and LG-LCA). Although we did not find exactly three groups demonstrating medium grades with three different (i.e., low, medium, and high) levels of classroom adjustment as hypothesized, we did obtain close variants, namely, clusters with medium high grades and medium classroom adjustment (MHG-MCA) as well as an average performing group that demonstrated exceptionally low classroom adjustment (MG-VLCA).
Between-cluster differences
Hypothesized between-cluster differences in emotional–behavioral outcomes in Part 2 of the study were also partially supported. As expected, the lowest achieving group reported significantly higher levels of depression, physiological and social anxiety, as well as delinquency at 6th grade when compared to the highest achieving group. Though these low-achieving youth scored the highest on emotional–behavioral difficulties at the start of the study, youth in this cluster also demonstrated significant declines in depression and physiological anxiety across the seven waves, as well as a less severe increase in social anxiety over time when compared to the highest achievement group.
With regard to the three groups demonstrating average grades (i.e., medium grade groups), it is noteworthy that on the outcomes of interest, these youths were only slightly different than the highest group and were rarely different than the lowest achieving group. The only exception to this general trend concerned the MG-VLCA cluster, which scored significantly higher on delinquency and also demonstrated a nonsignificant trend of higher social anxiety when compared to their high-achieving counterparts. Other differences exist when comparing these groups with the others; however, these are quite subtle. Regarding patterns of change in these markers over time, the MHG-MCA group demonstrated a decline in physiological anxiety and delinquency, but these results represented nonsignificant trends. There was also a less dramatic decline in social anxiety over time when the MHG-MCA group was compared to the highest achieving group. Thus, while the three medium-grade group clusters differed from their peers on indicators of achievement, they were not substantively different from them on emotional–behavioral difficulties.
With regard to the top performing students, the highest achieving group reported the highest levels of adjustment across all five outcomes (with the exception of alcohol use), and these group differences were most apparent when compared to the lowest achieving group. As noted above, nearly all groups reported higher (some significantly higher while others were nonsignificant but noteworthy trends in the data) levels of social anxiety and delinquency compared to these high achievers. It is important to note that while these high-achieving students may have begun the study lower than these groups on social anxiety and delinquency, the high achievers also showed escalations in both outcomes over time when compared to the others.
The findings obtained with respect to the association between achievement and social anxiety are consistent with that obtained in prior work on affluent youth (Ansary et al., Reference Ansary, McMahon and Luthar2012). In that study, social anxiety was concurrently and negatively associated with achievement at 6th grade with no evidence of prospective associations. This finding does not appear to be unique to wealthy youth because a similar association between social anxiety and underachievement was also obtained within a sample of disadvantaged youth (Ansary et al., Reference Ansary, McMahon and Luthar2012). Taken together, these findings point to the possibility that, regardless of socioeconomic context, more socially anxious youth may have more difficulty engaging in the academic realm. While there is a paucity of evidence concerning links between social anxiety and achievement, what evidence exists suggests a complicated array of factors underlying this association, including (a) reduced interaction in the academic realm, (b) specific anxiety concerning interacting with other students in a group setting, and (c) worry over performance (Beidel, Reference Beidel1991; Last, Hersen, Kazdin, Orvaschel, & Perrin, Reference Last, Hersen, Kazdin, Orvaschel and Perrin1991; Topham & Russell, Reference Topham and Russell2012).
In the current investigation, it is noteworthy that the highest achievement group demonstrated a steeper increase in social anxiety over time. Close inspection of the data indicates that, although social anxiety within this group increased markedly over time, it still scored comparatively lower than the other groups during 12th grade. Two explanations may underlie this finding: (a) high-achieving youth may “catch up” so to speak with their peers on social anxiety, or (b) as high-achieving youth mature and become more aware of peers' perceptions of them, they may develop apprehension about their less “cool” status associated with being labeled a “brainiac” or “nerd” (see Ansary & Luthar, Reference Ansary and Luthar2009). Future work will be needed to examine the mechanism underlying concurrent links between underachievement and social anxiety as well as the process associated with escalation in social anxiety as these youth traverse adolescence.
In terms of outcomes of an externalizing nature, the findings regarding the trajectories of achievement clusters and between-group differences on delinquency are also noteworthy. In general, with regard to delinquency, the highest achieving group scored lower than all other groups and demonstrated an escalation over time that attenuated during the later waves. With the exception of those with medium high grades and medium classroom adjustment who demonstrated a less dramatic escalation and attenuation, all groups followed a similar pattern. Although they need to be replicated, these findings suggest that with the exception of the highest achieving youth sampled in this context, generally most of their peers, regardless of achievement cluster, traverse a similar pathway across adolescence when considering the outcome of delinquency. The pattern of an escalation and then an attenuation of deviant activities is consistent with the adolescence-limited delinquency profile identified by Moffitt, Caspi, Rutter, and Silva (Reference Moffitt., Caspi, Rutter and Silva2001), in which youth exhibit an increase in delinquency during early to middle adolescence followed by a decline in deviant activities as youth prepare for the transition to early adulthood.
With regard to the alcohol use outcome, all achievement groups began 6th grade at extremely low levels, and all youth, regardless of cluster membership, showed a sustained escalation in alcohol use across the seven waves. In the current investigation, poorer achievement was not associated with alcohol use either concurrently or prospectively, and this coincides with findings from prior longitudinal work on affluent youth (Ansary & Luthar, Reference Ansary and Luthar2009; Ansary et al., Reference Ansary, McMahon and Luthar2012) and evidence from a cross-sectional study (Luthar & Ansary, Reference Luthar and Ansary2005).
The inconsistencies in the field regarding the association between alcohol use and achievement, regardless of socioeconomic context, fail to produce a firm direction going forward. For instance, while some findings suggest no direct association between alcohol consumption and academic achievement (Bryant & Zimmerman, Reference Bryant and Zimmerman2002; Ludden & Eccles, Reference Ludden and Eccles2007), others have found alcohol use to be associated with increased rates of drop out (Zimmerman & Schmeelk-Cone, Reference Zimmerman and Schmeelk-Cone2003), and others have found alcohol use to be associated with high school achievement and plans for college (Newcomb & Bentler, Reference Newcomb and Bentler1988; Schulenberg, Bachman, O'Malley, & Johnston, Reference Schulenberg, Bachman, O'Malley and Johnston1994). Again, as noted by Ludden and Eccles (Reference Ludden and Eccles2007), there are likely to be myriad moderating factors (e.g., academic motivation, school engagement, peer influences on views of achievement, etc.) that may explain these discrepant findings. These inconsistencies in the literature may also be due to variations across studies in the operationalization of alcohol use (Casswell, Pledger, & Hooper, Reference Casswell, Pledger and Hooper2003).
Implications
Although the findings suggest that the affluent youth sampled were relatively well adjusted, the findings also point to clusters of youth within this environment in need of prevention efforts. Teachers and counselors working in affluent settings may be remiss to presume that underachievement or manifestation of emotional–behavioral difficulty is unworthy of intervention due to environmental buffers present in affluent settings (e.g., access to resources, teachers, and counselors invested in supporting achievement). The evidence here suggests that early intervention is warranted when maladjustment in the emotional–behavioral and achievement realms is detected because the patterns appear to be stable as affluent youth move through middle and high school. Another important facet to consider is evidence suggesting that youth in affluent environments have reported lower levels of adult supervision after school concomitant with greater isolation from parents (see Luthar et al., Reference Luthar, Barkin and Crossman2013). Accordingly, prevention efforts in this setting might focus on promoting after-school supervision as well as parental education about the deleterious consequences of emotional–behavioral difficulty and compromised academic achievement. Furthermore, the cumulative findings suggesting that low-achieving affluent youth, not just those with substandard grades but those who engage in maladaptive classroom behavior, are not immune to externalizing problems (Ansary & Luthar, Reference Ansary and Luthar2009; Ansary et al., Reference Ansary, McMahon and Luthar2012). Thus, these findings support the need for prevention designs that are implemented early and are sensitive to the needs of these youth.
Limitations and future work
There are some shortcomings of the study that qualify the findings. Only one school from a single affluent suburban town was assessed. Although there is no reason to believe that this group is different than other suburban towns characterized by wealth (see Luthar & Barkin, Reference Luthar and Barkin2012), we cannot be fully certain that this sample is representative of all affluent, suburban adolescents. Consequently, some of the findings, like the cubic patterns of change in some developmental outcomes, may be specific to this sample. Relatedly, the sample primarily comprised Euro-American youth, which prevented any evaluation of ethnic differences.
In addition, although census data provided evidence suggesting that the variability in socioeconomic status between families was very limited, we were not able to examine the potential influence of socioeconomic status within this cohort of students. It is important to note that our original intention for this study was not to examine within-group socioeconomic differences, but rather our primary aim was to examine developmental patterns in these associations within this socioeconomic environment. Nonetheless, the lack of data concerning family income is a limitation of the study. This is unfortunate given evidence of socioeconomic differences in substance use–achievement associations in the context of moderating factors (Ludden & Eccles, Reference Ludden and Eccles2007). Moreover, although gender differences were assessed in terms of cluster composition, gender was not examined as a potential moderator of between-group differences in either Part 1 or Part 2 of the study. Accordingly, future work should explore ethnic, gender, and socioeconomic differences in these associations in a larger, representative sample of adolescents living in relative privilege.
Another limitation of the study concerns our assessment of cluster membership. Even though the findings suggest continuity over time in between-cluster differences, this is not to say that youth remained in the same clusters across the seven waves. For instance, it is certainly plausible that youth in the externalizing group may manifest greater emotional–behavioral difficulties as they mature and could conceivably transition to the multiproblem group. This limitation underscores the necessity for future work within this context to obtain a more comprehensive understanding of cluster membership and how this may change over time.
Our method of cluster validation as well as our conservative approach to defining statistical significance may have introduced another limitation of the study. Although researchers frequently use data from a single informant to define clusters and validate those clusters using measures collected from the same or other informants (e.g., see Caspi, Moffitt, Newman, & Silva, Reference Caspi, Moffitt, Newman and Silva1996; De Clercq, Rettew, Althoff, & De Bolle, Reference De Clercq, Rettew, Althoff and De Bolle2012; Marsee, Frick, Barry, Kimonis, & Aucoin, Reference Marsee, Frick, Barry, Kimonis and Aucoin2014), other statistical approaches to clustering students and documenting change over time with more liberal definitions of statistical significance may have produced somewhat different results. We believe our approach is methodologically rigorous and consistent with the approach taken by other developmental researchers (e.g., see Caspi et al., Reference Caspi, Moffitt, Newman and Silva1996; De Clercq et al., Reference De Clercq, Rettew, Althoff and De Bolle2012; Marsee et al., Reference Marsee, Frick, Barry, Kimonis and Aucoin2014). Nevertheless, our approach may represent a limitation of the study because clusters defined using other informants may have looked somewhat different than the clusters obtained. A different and unfortunate flaw in the current investigation concerns our inability to look at marijuana use. In light of prior evidence in this context suggesting the deleterious effect marijuana use may have on achievement, we would have liked to investigate this further; however, we were precluded due to the extremely low levels of marijuana use in our young sample at baseline.
Conclusion
Notwithstanding the limitations, this study represents one of the most rigorous studies examining emotional–behavioral–achievement associations among affluent youth. As Masten et al. (Reference Masten, Burt, Roisman, Obradovic, Long and Tellegen2004) note, “studies of continuity and change in patterns of adaptive and maladaptive behavior are vital to elucidating the processes by which successful development is achieved, sustained, undermined, lost, and recovered” (p. 1072). This study addresses a significant gap in our current, yet early, understanding of continuity and discontinuity in patterns of psychological and academic adjustment over time among privileged adolescents. For the affluent youth sampled here, it appears that there is considerable, yet relative in terms of between-group differences, continuity in these cross-domain associations over time. Future work would be well served to delve deeper to elucidate the mechanisms by which these relative cluster differences in emotional–behavioral–achievement indices emerge prior to middle school and are sustained through the end of high school.



