Introduction
ICs comprise a class of stimuli widely used for the investigation into the internal nature of visual processing in the brain. Promisingly, they can provide important clues to understanding the process of transformation of a raw retinal image into perception of objects.
Human studies employing EEG/MEG responses found that sensitivity to Kanizsa-type ICs manifested itself as an enhanced amplitude of response to the IC compared with control stimuli; the timing of the effect coincided with the so-called N1 component, which is a negative peak of the visual evoked potential at 150–200 ms with a broad distribution over the parieto-occipital scalp (Ohtani et al., Reference Ohtani, Okamura, Shibasaki, Arakawa, Yoshida, Toyama and Ejima2002; Proverbio & Zani, Reference Proverbio and Zani2002; Halgren et al., Reference Halgren, Mendola, Chong and Dale2003; Khoe et al., Reference Khoe, Freeman, Woldorff and Mangun2004; Knebel & Murray, Reference Knebel and Murray2012; Shpaner et al., Reference Shpaner, Molholm, Forde and Foxe2013; Mijovic et al., Reference Mijovic, De Vos, Vanderperren, Machilsen, Sunaert, Van Huffel and Wagemans2014). A large body of recent evidence using source reconstruction of EEG/MEG signals demonstrates that these initial amplitude modulations occur relatively late in processing, and that LOC is the most critical node responsible for the IC detection (Murray & Herrmann, Reference Murray and Herrmann2013; Shpaner et al., Reference Shpaner, Molholm, Forde and Foxe2013). LOC activity is most salient within the N1 time range, yet the earliest signs of the IC effect may be detected in LOC as early as 88 ms—i.e., much earlier than N1 (Murray et al., Reference Murray, Wylie, Higgins, Javitt, Schroeder and Foxe2002a ).
Using high-density recordings of event-related potentials (ERPs) and studying the responses to Gabor contours embedded in Gabor noise versus control stimuli, Shpaner et al. (Reference Shpaner, Molholm, Forde and Foxe2013) specifically targeted C1 component of the visual evoked potential (50–100 ms)—i.e., the early activity originating from the primary visual cortex—and found no indication of the IC sensitivity at this early stage of IC processing in V1. Similar results were obtained in several earlier studies employing Kanizsa-type ICs (Shpaner et al., Reference Shpaner, Murray and Foxe2009; Altschuler et al., Reference Altschuler, Molholm, Russo, Snyder, Brandwein, Blanco and Foxe2012).
Yet, according to animal studies, early visual cortices including V1 seem to be involved in IC detection, with strong implications of recurrent processing and interactive communication both within and between visual areas. Most of the evidence concerning the involvement of low-order visual cortices V1/V2 comes from recording single-unit responses to ICs (Von der Heydt et al., Reference Von der Heydt, Peterhans and Baumgartner1984; Redies et al., Reference Redies, Crook and Creutzfeldt1986; Peterhans & Von der Heydt, Reference Peterhans and Von der Heydt1989; Von der Heydt & Peterhans, Reference Von der Heydt and Peterhans1989; Grosof et al., Reference Grosof, Shapley and Hawken1993; Sheth et al., Reference Sheth, Sharma, Rao and Sur1996; Leventhal et al., Reference Leventhal, Wang, Schmolesky and Zhou1998; Sugita, Reference Sugita1999; Lee & Nguyen, Reference Lee and Nguyen2001; Ramsden et al., Reference Ramsden, Hung and Roe2001; Zhou et al., Reference Zhou, Jia, Tao and Shou2001). Altogether, the data evidenced that early visual cortices respond to ICs and gave rise to the theories placing the earliest stage of IC processing to such low-order visual areas as V1 and V2 [e.g., Grosof et al. (Reference Grosof, Shapley and Hawken1993)].
Lee and Nguyen (Reference Lee and Nguyen2001) found that the excitatory IC effect in V1 began at 100 ms after stimulus onset, while in V2 it could be detected much earlier—at 70 ms. Lee and Nguyen conclude that the excitatory IC effect in the V1 may be a secondary result of feed-back coming from V2, and the two areas—V1 and V2—tightly interact and may receive top-down interactions, mediated by recurrent feedback connections from the higher nodes of the visual system.
Importantly, according to animal studies, IC processing may be related to both inhibitory and excitatory modulation of neuronal activity in V1: at least two studies report absolute or relative suppression of V1 cells in response to ICs. Ramsden et al. (Reference Ramsden, Hung and Roe2001) found in V1 pronounced inhibitory responses to ICs formed by abutting line gratings: while a real contour presented at the optimal orientation within the cell’s receptive field evoked an excitatory response, an IC located in the same place and having the same orientation pushed the cell’s firing rate below the background level, i.e., produced significant inhibition. Ramsden et al. (Reference Ramsden, Hung and Roe2001) proposed that the de-emphasis of IC in V1 coupled with its emphasis in V2 may be a specific signature of an IC needed for further processing. Peterhans and Von der Heydt (Reference Peterhans and Von der Heydt1989) found relative suppression of neuronal activity in response to ICs, which canceled the cells’ response to the ends of a real contour extending into the receptive field of the cell.
PET and fMRI studies of IC perception generally provided less conclusive results concerning the involvement of the early visual cortices in IC perception than single unit recording. Some of such studies of IC perception found activations in V1 and/or V2 (Hirsch et al., Reference Hirsch, Delapaz, Relkin, Victor, Kim, Li, Borden, Rubin and Shapley1995; Ffytche & Zeki, Reference Ffytche and Zeki1996; Goebel et al., Reference Goebel, Khorram-Sefat, Muckli, Hacker and Singer1998; Seghier et al., Reference Seghier, Dojat, Delon-Martin, Rubin, Warnking, Segebarth and Bullier2000; Sasaki & Watanabe, Reference Sasaki and Watanabe2004; Maertens et al., Reference Maertens, Pollmann, Hanke, Mildner and Moller2008). Suppression of fMRI signal in V1 and V2 in response to Kanizsa stimuli was reported by Mendola et al. (Reference Mendola, Dale, Fischl, Liu and Tootell1999). It should be mentioned, however, that PET and fMRI provide low temporal resolution, thus not permitting to distinguish the exact timing of the effects found.
Surprisingly, in contrast to reports concerning ICs per se, Gestalt perception was found to robustly suppress fMRI signal within early retinotopic areas (Murray et al., Reference Murray, Kersten, Olshausen, Schrater and Woods2002b ; Fang et al., Reference Fang, Kersten and Murray2008; de-Wit et al., Reference de-Wit, Kubilius, Wagemans and Op de Beeck2012). Apparently, Gestalt perception depends upon both real and IC processing in the brain. The effect of suppression of the early visual cortices during Gestalt perception had been considered within these studies in terms of top-down effects from the higher-tier visual areas.
As far as EEG/MEG is concerned, the first indication of a relative suppression of the response to ICs—the inverted IC effect—came from an event-related potential study in children with autistic spectrum disorder (Stroganova et al., Reference Stroganova, Orekhova, Prokofyev, Posikera, Morozov, Obukhov and Morozov2007); the IC effect comprising N1 enhancement in response to the illusory figure was reversed, so that the Kanizsa figure produced weaker response than the control figure. Stroganova et al. (Reference Stroganova, Orekhova, Prokofyev, Posikera, Morozov, Obukhov and Morozov2007) explained the inverted effect by the predominance of local to global processing in autistic children (Mottron et al., Reference Mottron, Dawson, Soulieres, Hubert and Burack2006). Later the result was extended by recording phase-locked gamma-activity (Stroganova et al., Reference Stroganova, Orekhova, Prokofyev, Tsetlin, Gratchev, Morozov and Obukhov2012): it was demonstrated that the IC effect at occipital electrodes comprised two distinct phases. The early one within 40–120 ms after stimulus onset was the inverted IC effect (weaker response to the Kanizsa figure than to the control) in both autistic children and their healthy peers. During the later phase within 120–270 ms after stimulus onset the IC effect continued to be inverted in autistic children but turned into the “direct” IC effect in healthy children. The finding concerning the inverted IC effect within 40–120 ms in normally developing children was novel; yet the same experimental procedure applied to healthy adults failed to reveal the early inverted IC effect [Supplementary Materials in Stroganova et al. (Reference Stroganova, Orekhova, Prokofyev, Tsetlin, Gratchev, Morozov and Obukhov2012)].
Both the subjective perception of the Kanizsa illusion and the related IC effect in the brain activity strongly depend upon iso-oriented collinear borders (Ramachandran et al., Reference Ramachandran, Ruskin, Cobb, Rogersramachandran and Tyler1994; Proverbio & Zani, Reference Proverbio and Zani2002): the illusion-inducing patterns involve such collinear borders with uninterrupted gaps between them, while commonly used control patterns have no such borders. Since the effect of surround suppression can be readily observed in V1 in response to collinear objects (Sillito & Jones, Reference Sillito and Jones1996; Jones et al., Reference Jones, Grieve, Wang and Sillito2001; Nurminen & Angelucci, Reference Nurminen and Angelucci2014), one may expect stronger surround suppression effect to be elicited by Kanizsa figures compared with control stimuli.
Generally, surround suppression can be detected as a decrease in V1 cell spiking if iso-oriented objects are presented simultaneously outside and inside the cell’s classical receptive field. The effect of surround suppression was extensively studied using several different classes of iso-oriented stimuli, including gratings (Sillito & Jones, Reference Sillito and Jones1996; Jones et al., Reference Jones, Grieve, Wang and Sillito2001; Kinoshita et al., Reference Kinoshita, Gilbert and Das2009; Ishikawa et al., Reference Ishikawa, Shimegi, Kida and Sato2010; Hashemi-Nezhad & Lyon, Reference Hashemi-Nezhad and Lyon2012; Henry et al., Reference Henry, Joshi, Xing, Shapley and Hawken2013; Vanni & Casanova, Reference Vanni and Casanova2013), Gabor patches (Polat & Norcia, Reference Polat and Norcia1996; Polat et al., Reference Polat, Mizobe, Pettet, Kasamatsu and Norcia1998; Chen et al., Reference Chen, Kasamatsu, Polat and Norcia2001), and collinear bars (Knierim & Vanessen, Reference Knierim and Vanessen1992; Kinoshita et al., Reference Kinoshita, Gilbert and Das2009). Importantly, the effect of iso-orientation suppression in V1 appears rather early within the first 100 ms after stimulus onset (Henry et al., Reference Henry, Joshi, Xing, Shapley and Hawken2013; Liu et al., Reference Liu, Hashemi-Nezhad and Lyon2013) and may be delayed as little as 9 ms relative to the onset of the V1 cell’s response (Bair et al., Reference Bair, Cavanaugh and Movshon2003).
The origin of the iso-orientation surround suppression may be intrinsic to V1 (Ishikawa et al., Reference Ishikawa, Shimegi, Kida and Sato2010; Hashemi-Nezhad & Lyon, Reference Hashemi-Nezhad and Lyon2012; Henry et al., Reference Henry, Joshi, Xing, Shapley and Hawken2013; Tanaka & Nakamura, Reference Tanaka and Nakamura2013), while there is also strong evidence that a very fast surround suppression at greater angular distances may be mediated by feedback connections from extrastriate regions, such as V2, V3, and middle temporal area (MT) (Angelucci & Bullier, Reference Angelucci and Bullier2003; Angelucci & Bressloff, Reference Angelucci, Bressloff, MartinezConde, Macknik, Martinez, Alonso and Tse2006; Schwabe et al., Reference Schwabe, Obermayer, Angelucci and Bressloff2006; Liu et al., Reference Liu, Hashemi-Nezhad and Lyon2013; Nassi et al., Reference Nassi, Lomber and Born2013; Nurminen & Angelucci, Reference Nurminen and Angelucci2014). The latter fact is compatible with the finding that the IC effect generally commenced earlier in V2 than in V1 (Lee & Nguyen, Reference Lee and Nguyen2001).
The primary goal of the current study was to test the existence of the early inverted IC effect in adults in response to Kanizsa figures. We used MEG recording, which is more sensitive than EEG to activity originating from the medial aspect of the occipital lobe comprising V1 and V2 areas (Muthukumaraswamy & Singh, Reference Muthukumaraswamy and Singh2013; Orekhova et al., Reference Orekhova, Butorina, Sysoeva, Prokofyev, Nikolaeva and Stroganova2015), and has a significantly better time resolution than fMRI. We anticipated that as a consequence of the iso-orientation surround suppression, Kanizsa figures would evoke weaker short-latency activity compared with controls, and this effect would be most pronounced in V1. Following the findings of Stroganova et al. (Reference Stroganova, Orekhova, Prokofyev, Tsetlin, Gratchev, Morozov and Obukhov2012), we analyzed the time interval of 40–120 ms. We also restricted our analysis to the medial occipital area and the occipital pole. We used two sizes of stimuli in order to probe the putative early inverted IC effect at two different levels of eccentricity. We expected the inverted IC effect to be localized mostly within the primary visual cortex in a topographical manner related to the IC eccentricity.
Materials and methods
Participants
Twenty adult volunteers (8 males, 12 females) aged 20–28 years (mean = 23.5, s.d. = 2.5) participated in this study. Two participants were left-handed, the rest were right-handed according to The Edinburgh Inventory (Oldfield, Reference Oldfield1971). All participants had normal or corrected to normal vision, and did not report any neurological or psychiatric disorders. The study was approved by the ethics committee of the Moscow State University of Psychology and Education and was conducted following the ethical principles regarding human experimentation (Helsinki Declaration). All participants signed the informed consent before the experiment.
Experimental paradigm
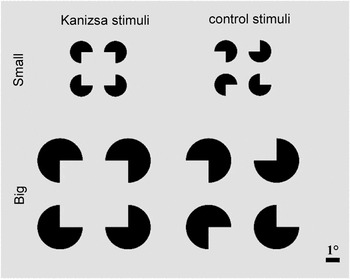
Two types of stimuli were used in this study: a stimulus producing an IC—a Kanizsa-type square (Kanizsa, Reference Kanizsa1955) and a control stimulus (Fig. 1). Both stimuli were comprised of four identical black inducer discs each having a 90° sector missing; the length of inducing edges was equal to the disc radius. The Kanizsa stimulus and the control stimulus were identical except for the relative orientation of missing sectors of the inducer discs. The distance between the inducer discs was equal to their radius, thus producing the support ratio of 2:3—the ratio of physically specified contour segments to total contour length (Shipley & Kellman, Reference Shipley and Kellman1992). Each stimulus was used in two sizes of 4.5° × 4.5° and 9.0° × 9.0°, referred below as small and big (Fig. 1). The stimuli were presented in the center of the monitor; a small fixation cross was presented in the center of the monitor between the stimuli.
Kanizsa and control stimuli used in the experiment.

The participants were instructed to constantly maintain their gaze toward the center of the screen. Involvement of the participants in the experiment was continuously monitored with the help of two video surveillance cameras showing both the whole interior of the recording chamber and participants’ upper face and eyes. This ensured that the participants were strictly following the instruction to attend to the screen center.
The stimuli were presented to the participants using Presentation software (Neurobehavioral Systems Inc., Albany, CA) on a 26-in. projection monitor with a refresh rate of 60 Hz. The monitor was located 1.7 m in front of the participants. Both the stimuli and the fixation cross were presented in the center of the monitor. The duration of each stimulus was 500 ms, and the interstimulus interval randomly varied between 500 and 1000 ms. The experiment comprised two series, with the small stimuli presented in one of them and the big stimuli in the other; the order of the two experimental series was counterbalanced across the participants. Each stimulus was presented 150 times within each of the experimental series. Kanizsa stimuli and controls were interleaved in a quasirandom order.
After the experiment the participants were asked to report on their subjective perception of the stimuli. Kanizsa stimuli of both sizes were described by all of the participants as a luminous square superimposed on the four black circles; thus all of the participants did perceive the illusion.
Recording
Prior to the MEG recording, the coordinates of head-positioning indicator coils and fiducial points were determined with a three-dimensional digitizer “FASTRAK” (Polhemus, Colchester, VT). Four coils were attached to the surface of the scalp in the upper part of the forehead and behind the ears: they were used to track head position relative to MEG sensors. The left and right preauricular points and the nasion were used as fiducial points.
MEG was recorded using a 306-channel MEG “Vector View” system (Elekta Neuromag, Helsinki, Finland). The MEG sensor array consisted of 102 triplets (each triplet comprising two planar gradiometers and one magnetometer). Bipolar electromyogram from the left dorsal surface of the neck over trapezoid muscle and four channels of electrooculogram were also recorded for the purpose of artifact detection. MEG, electromyogram, and electrooculogram were recorded at sampling rate of 1000 Hz, a high-pass filter of 0.1 Hz, and low-pass filter of 330 Hz.
MEG preprocessing
All raw MEG data were first processed using the temporal signal-space separation method to remove biological artifacts and other environmental magnetic sources originating outside the brain. The temporal signal-space separation method as well as movement compensation were achieved with options implemented in MaxFilter software (Elekta Neuromag, Finland).
Trials were rejected if they were heavily contaminated with eye movements or blinks (if the bipolar electrooculogram electrode pairs showed a voltage difference greater than 200 µV), or if the peak-to-peak MEG amplitude exceeded 12,000 fT/cm for magnetometers or 3000 fT/cm for gradiometers in either direction. Artifacts generated by remaining eye blinks were removed using signal space projections, which was performed using Brainstorm software (Tadel et al., Reference Tadel, Baillet, Mosher, Pantazis and Leahy2011). The number of trials used in further analyses was 149.7 ± 0.6 (mean ± s.d.) for small Kanizsa stimuli, 149.7 ± 0.5 for small control stimuli, 148.9 ± 1.4 for big Kanizsa stimuli and 148.9 ± 1.6 for big control stimuli (out of 150 for each stimulus type).
In order to avoid the inflation of Type 1 error due to an excessively high number of statistical comparisons, as well as to reduce the volume of computations, MEG signal was downsampled by a factor of 5 by integrating adjacent time points, resulting in 200 timeframes/s. No additional filtering was applied to the data.
Sensor-level analysis
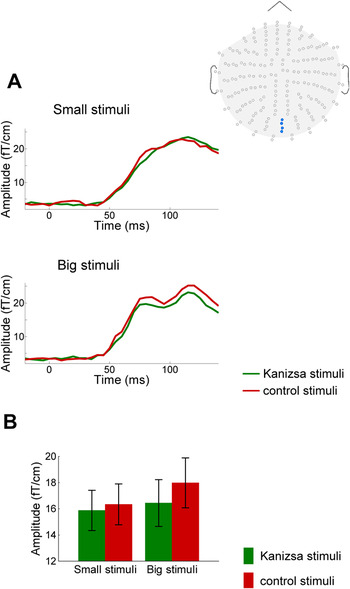
The RMS values of MEG signal amplitudes were calculated within each subject from two pairs of gradiometers overlying the occipital midline (sensors 2112, 2113, 2122, and 2123); this averaged measure was used to assess RMS timecourses. Grand-averaged RMS timecourses are presented in Fig. 2A.
RMS absolute amplitudes from gradiometers overlying the occipital midline, locations of which are indicated by the inset at top right. (A) Grand-averaged timecourses of RMS absolute amplitudes for small and big stimuli. (B) RMS absolute amplitudes averaged over 40–120 ms. Error bars represent standard errors of mean between subjects.

Structural MRI and magnetoencephalography source analysis
Sequences of 176 high-resolution structural T 1-weighted MRI slices in the sagittal plane were acquired on a 1.5 T Siemens scanner with slice thickness of 1 mm.
The individualized three-layer boundary element models were constructed for each participant using T 1-weighted MRI scans. The cortical, inner, and outer skull surfaces were reconstructed using FreeSurfer software (Dale et al., Reference Dale, Fischl and Sereno1999; Desikan et al., Reference Desikan, Segonne, Fischl, Quinn, Dickerson, Blacker, Buckner, Dale, Maguire, Hyman, Albert and Killiany2006). Individual brains were spatially co-registered by morphing them into the FreeSurfer average brain via a spherical surface. The surface was also “inflated” to unfold the cortical sulci, providing a convenient view of cortical activation patterns (Fischl et al., Reference Fischl, Sereno and Dale1999).
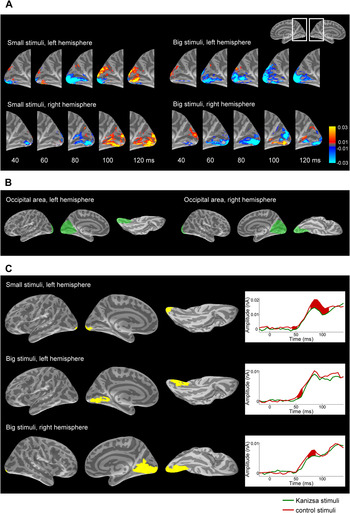
Source estimation was performed using unsigned cortical-surface-constrained L2-norm-based minimum norm estimation by using the MNE software suite (Minimum Norm Estimate; Hämäläinen & Sarvas, Reference Hämäläinen and Sarvas1989). A grid spacing of 5 mm was used for dipole placement, yielding 10,242 sources per hemisphere. “Orientation constraint parameter,” which determines the extent to which dipoles may deviate from the orthogonal orientation in relation to the cortical surface, was set to 0.4. Depth weighting with the order of 0.8 and the limit of 10 was applied. Unsigned (absolute) estimates of source currents were used. The differences in the absolute source strength between Kanizsa stimuli and control stimuli plotted on the inflated brain surface are presented in Fig. 3A.
Source localization for the IC effect. (A) Grand-averaged difference in the absolute source strength between Kanizsa and control stimuli plotted on the medial occipital aspects of the inflated brain surface (see inset at top right). Negative values correspond to the inverted IC effect. Scale: nA. (B) The occipital area used to assess the inverted IC effect statistically. (C) The ROIs defined on the basis of TFCE-corrected permutation statistics (left) and grand-averaged timecourses of brain activity within corresponding ROIs (right). Filling between the timecourses shows corrected statistically significant differences (permutation statistics, maximal temporal cluster size correction, P < 0.05).

Statistical analysis
In this study, we aimed to find evidence of the inverted IC effect, thus we restricted the analysis both spatially and temporally on the basis of the findings reported by Stroganova et al. (Reference Stroganova, Orekhova, Prokofyev, Posikera, Morozov, Obukhov and Morozov2007, Reference Stroganova, Orekhova, Prokofyev, Tsetlin, Gratchev, Morozov and Obukhov2012).
In the sensor space, two-way ANOVA with repeated measures [factors: Stimulus Type (Kanizsa vs. control) × Stimulus Size (small vs. big)] was performed on RMS data recorded over the occipital midline and averaged within a 40–120 ms time window.
For the statistical analysis of source-estimated data, the following restrictions were used: (1) one-tailed statistical approach was used to test the hypothesis that there would be a reduced response to the Kanizsa stimuli compared with control stimuli; (2) statistical analysis was performed within the 40–120 ms time window relative to stimulus onset; (3) on the basis of the abovementioned studies which localized the inverted IC effect close to the occipital pole as well as on the basis of the candidate mechanism of the inverted IC effect (Stroganova et al., Reference Stroganova, Orekhova, Prokofyev, Tsetlin, Gratchev, Morozov and Obukhov2012), we restricted the search of the IC effect to occipital areas comprising early stages of visual processing. Thus, brain surface was clipped to the occipital areas shown in Fig. 3B.
Altogether, four statistical comparisons of brain responses to Kanizsa stimuli with responses to control stimuli were performed separately (2 stimulus sizes × 2 hemispheres). For each comparison, the following procedure was applied independently in order to determine the ROIs within the occipital areas (using a custom-made script).
For each vertex within the selected occipital area in a 40–120 ms time window (17 time frames at 5 ms resolution), a paired t-test was computed across all participants, resulting in a SPM, containing t-values. This procedure was applied to the real dataset and to 1000 permuted surrogate datasets produced from the real dataset by swapping condition labels (“Kanizsa stimulus” vs. “control stimulus”) in random subsets of participants at 50% probability level. Each repetition of surrogate data generation was truly random and independent from previous repetitions. Data swapping was performed within subjects, and the “stimulus size” label was always preserved in surrogate datasets.
A TFCE technique was then applied, as described in Mensen and Khatami (Reference Mensen and Khatami2013). This approach takes into account both data point statistical intensity and its neighborhood via computing a “supporting area” for each data point. TFCE procedure was identically applied to the SPMs produced from the real dataset and to the SPMs produced from 1000 surrogate datasets. Since we were interested in the inverted IC effect, and negative values corresponded to lower brain activity in response to Kanizsa stimuli compared with controls, a single most negative value across all vertices and time points was taken for each of the 1000 SPMs obtained from surrogate datasets following the TFCE procedure, thus producing a distribution of 1000 values. Each vertex at each time frame within the real dataset was considered statistically significant if its value fell within the lower 0.05 quantile of the distribution specified above. A ROI was specified as the aggregation of all significant vertices across all timeframes within the of 40–120 ms interval. The resulting ROIs are represented in Fig. 3C.
Further statistical procedure was applied to these ROIs to determine the time spans of statistically significant differences between conditions. For this purpose, the correction based on the approach described by Nichols and Holmes (Reference Nichols and Holmes2002) was used with one important modification: while the report mentioned above dealt with the maximal spatial cluster size correction, we used the maximal temporal cluster size correction, as described below.
For each time point unsigned source currents were averaged across all vertices within the ROI, yielding a 1-dimensional array of data points for each participant. These data are presented in Fig. 3C as timecourses of brain activity. These time courses were permuted 1000 times by swapping condition labels in random subsets of participants at 50% chance level. For each permutation paired two-tailed Student’s t-test was performed at each time point, yielding a one-dimensional array of P-values. At every permutation step a maximum span length of significant (P < 0.05) neighboring time points was taken, thus yielding a distribution of 1000 values. The same statistics performed on the real nonpermuted data was considered significant if the length of the span of significant (P < 0.05) neighboring time points fell within the 0.05 upper quantile of the distribution obtained from the permuted data. This procedure allowed us to find the time spans during which the time courses were significantly different between conditions.
Results
Sensor-level analysis
RMS amplitudes across gradiometers overlying the occipital midline are represented in Fig. 2A. For both small and big stimuli, the onset of the visual response can be clearly seen immediately before 50 ms after stimulus onset. The response reached its near-maximum values approximately at 70–80 ms. Visual inspection of timecourses for both small and big stimuli suggests that the magnitude of the early response was smaller for Kanizsa stimuli compared with control stimuli, thus demonstrating the inverted IC effect.
Two-way ANOVA with repeated measures [factors: Stimulus Type (Kanizsa vs. control) × Stimulus Size (small vs. big)] performed on RMS values averaged within the 40–120 ms time window (Fig. 2B) confirmed that the RMS values were smaller for Kanizsa stimuli compared with control ones—i.e., the inverted IC effect (Stimulus Type: F (1,19) = 7.11, P = 0.015, ƞ p 2 = 0.272). There was no significant effect of Stimulus Size (F (1,19) = 1.26, P = 0.27, ƞ p 2 = 0.062), and interaction between Stimulus Type and Size was not significant (F (1,19) = 0.66, P = 0.43, ƞ p 2 = 0.034), thus refuting the dependence of the inverted IC effect on the stimulus size.
Source-level analysis
Source magnitude plotted on the inflated brain surface also revealed a visible inverted IC effect for both stimulus sizes in both hemispheres within the 40–120 ms time window. As can be seen in Fig. 3A, brain activity was apparently lower for Kanizsa stimuli compared with control stimuli within the occipital pole and/or along the ventral bank of the calcarine sulcus during at least part of this time interval, with the most pronounced effect present around 80 ms after stimulus onset.
Spatial localization of the IC effect
In this study, we aimed to find the inverted IC effect within the occipital area (Fig. 3B) comprising early stages of visual processing. Thus the first step was to find statistically valid spatial areas, or ROIs. Permutation statistics applied to the TFCE-corrected results of comparison between current sources in response to Kanizsa vs. control stimulus produced the following results (Fig. 3C).
For small stimuli the permutation procedure applied to the TFCE-corrected results yielded a narrowly focused cluster of significantly activated vertices at the occipital pole of the left hemisphere below the end of the calcarine sulcus, which consisted of 33 vertices (Fig. 3C). At the threshold of 0.05 used, within the right hemisphere the permutation procedure fetched no significant voxels; yet by loosening the threshold to 0.2, the permutation procedure produced a symmetrically located cluster in the occipital pole of the right hemisphere too. The latter region was not included into the further analyses, as it did not reach the accepted significance level.
For big stimuli the same procedure yielded statically significant loci both in the left and in the right hemispheres. In the left hemisphere, the IC-specific activation occupied most of the lingual gyrus along the ventral bank of the calcarine sulcus, i.e., a much broader area compared with small stimuli. The cluster comprised 93 vertices (Fig. 3C). In the right hemisphere the cluster of statistically significant vertices for big stimuli had even broader spatial distribution similar to that in the left hemisphere (310 vertices) (Fig. 3C).
Temporal dynamics of the IC effect
The further statistical analysis was carried out within the three ROIs defined as specified above, aiming to describe the time course of activation within the respective regions. The timecourses of current source amplitudes averaged across vertices within ROIs (Fig. 3C) revealed a sharp increase in activity commencing approximately 50 ms after the stimulus onset, with a prominent peak at 80–90 ms for all four stimulus types.
For the small stimuli significant IC-control differences in the source current amplitude within left-hemispheric ROI spanned mainly the time window between 70 and 105 ms after the stimulus onset, with similar but shorter lasting time period of differential response to IC occurring even earlier (between 45 and 55 ms) and accompanying the appearance of the response itself (Fig. 3C).
For the big stimuli a significant inverted IC effect was evident at 50–55 ms and at 65–75 ms in the ROIs of the left and the right hemisphere correspondingly (Fig. 3C).
Discussion
The current study revealed that the early inverted IC effect can be detected in adult nonclinical population using MEG recording. To the best of our knowledge this is the first direct evidence in human neuroimaging literature of the inverted IC effect (reduced activity to a Kanizsa figure compared with controls) at relatively short latencies, localized in lower-order visual areas. Thus we corroborate and extend to adults the EEG findings of Stroganova et al. (Reference Stroganova, Orekhova, Prokofyev, Tsetlin, Gratchev, Morozov and Obukhov2012), who discovered the early inverted IC effect in children. This finding generally stays in accord with studies involving single-unit recordings in animals (Sillito & Jones, Reference Sillito and Jones1996; Jones et al., Reference Jones, Grieve, Wang and Sillito2001; Ramsden et al., Reference Ramsden, Hung and Roe2001; Ishikawa et al., Reference Ishikawa, Shimegi, Kida and Sato2010; Hashemi-Nezhad & Lyon, Reference Hashemi-Nezhad and Lyon2012; Henry et al., Reference Henry, Joshi, Xing, Shapley and Hawken2013; Vanni & Casanova, Reference Vanni and Casanova2013), optical imaging in animals (Kinoshita et al., Reference Kinoshita, Gilbert and Das2009) and fMRI studies of Kanizsa illusion perception in humans (Mendola et al., Reference Mendola, Dale, Fischl, Liu and Tootell1999), as well as studies of Gestalt perception in humans (Murray et al., Reference Murray, Kersten, Olshausen, Schrater and Woods2002b ; Fang et al., Reference Fang, Kersten and Murray2008; de-Wit et al., Reference de-Wit, Kubilius, Wagemans and Op de Beeck2012).
The inverted IC effect at the sensor level
At sensor level, the analysis clearly confirmed the existence of the inverted IC effect in the MEG signal obtained from the sensors, overlying the medial occipital cortex (Fig. 2). The strength of the visual response to the big and small stimuli was not significantly different. This observation stays in accord with a number of accounts demonstrating that the area of the cortical representation of a stimulus remains roughly constant when the stimulus size is scaled (Daniel & Whitteridge, Reference Daniel and Whitteridge1961; Virsu & Rovamo, Reference Virsu and Rovamo1979; Wilson et al., Reference Wilson, Levi, Maffei, Rovamo, DeValois, Spillmann and Werner1990). No difference in the strength of the inverted IC effect was found between the two stimulus sizes as well, and no interaction between the two factors. Thus, our data are compatible with a conclusion on the lack of difference in the strength of the inverted IC effect between big and small stimuli. Importantly, the classical IC effect in LOC was also found to be independent of the stimulus size (Murray et al., Reference Murray, Kersten, Olshausen, Schrater and Woods2002a ) and eccentricity/laterality of presentation within the visual field (Altschuler et al., Reference Altschuler, Molholm, Russo, Snyder, Brandwein, Blanco and Foxe2012).
The inverted IC effect at the source level
For the small stimuli, the inverted IC effect was found within the occipital pole (Fig. 3C), in the area corresponding to the central field of vision within the primary visual cortex V1 (Hasnain et al., Reference Hasnain, Fox and Woldorff1998; Dougherty et al., Reference Dougherty, Koch, Brewer, Fischer, Modersitzki and Wandell2003; Wandell et al., Reference Wandell, Brewer and Dougherty2005). Under the threshold of statistical significance of 0.05, the effect was found in the left hemisphere only. Still this effect was visibly present in the right hemisphere as well (Fig. 3A).
For the big stimuli, the statistical procedure yielded roughly symmetrical broad areas along the lower bank of calcarine sulcus and in the lingual gyrus. Apparently, these ROI mostly correspond to the cortical representation of the peripheral parts of the visual field in V1, although they may include extrastriate areas adjacent to V1 (Hasnain et al., Reference Hasnain, Fox and Woldorff1998; Dougherty et al., Reference Dougherty, Koch, Brewer, Fischer, Modersitzki and Wandell2003).
Thus, the difference in the localization of the inverted IC effects between big and small stimuli suggests that big and small ICs affect early visual processing at respective cortical representations of the visual field. The statistical approach used did not involve any a priori assumptions on the effect localization within the very broadly defined occipital area; thus the observation that the topography of the IC effect predictably matched the retinotopic organization of the primary visual areas supports the validity of the early inverted IC effect found.
According to Cicmil et al. (Reference Cicmil, Bridge, Parker, Woolrich and Krug2014), source localization of MEG data using MNE algorithm may be insufficiently accurate for checkerboard pattern rings when considering at individual level of analysis; at the same time, MNE proved to be very accurate for quarter-rings. It should be underlined that the current study did not aim at precise localization of effects—our finding allowed us to conclude that the relative difference in localization between the effects for the two sizes of stimuli met our prediction relying upon the retinotopic mapping. Also, our study differs in several important aspect from that of Cicmil et al. (Reference Cicmil, Bridge, Parker, Woolrich and Krug2014). First, we localized the differential activation, rather than brain response per se. Second, we report group statistics for 20 subjects, while Cicmil et al. (Reference Cicmil, Bridge, Parker, Woolrich and Krug2014) analyzed localization results obtained individually. Finally, the stimuli substantially differ between the two studies. The rings used in Cicmil et al. (Reference Cicmil, Bridge, Parker, Woolrich and Krug2014) were constructed of checkerboard patterns and thus had very large numbers of luminance borders; this may have induced a widespread distributed activity in the visual cortex, posing a challenge for the MNE algorithm. The stimuli used in our experiment had a much less number and total length of luminance borders.
The inverted IC effect occupied greater cortical areas for big stimuli compared with small ones (Fig. 3C). We suggest that the latter finding most probably resulted from some inaccuracy of MEG inverse solution. Indeed, the effect was localized more medially and deeper in the brain for the big stimuli compared with the small ones (Fig. 3C, left). Deeper locations can be identified with less spatial accuracy and thus are subject to greater blurring (Hillebrand & Barnes, Reference Hillebrand and Barnes2002). This made the source localization for big stimuli less focused, encompassing greater numbers of vertexes (Fig. 3C). Consequently, no direct statistical comparison of the strength of the visual response and the IC effect was feasible at the source level across qualitatively different ROIs.
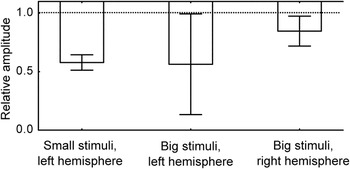
The follow-up analysis of timing of the inverted IC brought additional validity to its existence within the 40–120 ms time window (Fig. 3C, right). Bar graphs representing the effects within significant time intervals are shown in Fig. 4.
Relative source amplitude of the inverted IC effect across all participants measured within respective ROIs and within significant time intervals shown in Fig. 3C. Values represent the measure calculated as: (“response to Kanizsa stimulus” − “response to control stimulus”)/“response to control stimulus.” Columns represent the average across subjects, and error bars represent standard errors of mean between subjects. Downward orientation of columns represents the inverted nature of the early IC effect.

In the current study, participants’ attention and gaze direction were not explicitly controlled (except for through surveillance cameras). Yet, since the stimuli were presented in random order, no anticipatory eye movements or attention shifts could create the effect found. Additionally, the effect seems to be too early to be affected by eye movements to the stimuli (Yuval-Greenberg et al., Reference Yuval-Greenberg, Tomer, Keren, Nelken and Deouell2008).
The finding of the inverted IC effect in the early visual areas raises two major questions: how it can be explained from a neurophysiological perspective, and why it has not been reported earlier.
The origin of the inverted IC effect
The illusory square within the Kanizsa stimulus is formed by four pairs of collinear real luminance borders (Fig. 1), while no such pairs of collinear borders are present in the control stimuli. Collinearity of aligned boundaries was shown to play the primary role in IC perception, as well as in the IC effect produced by Kanizsa-like figures (Ramachandran et al., Reference Ramachandran, Ruskin, Cobb, Rogersramachandran and Tyler1994; Proverbio & Zani, Reference Proverbio and Zani2002).
Effects of collinearity were extensively studied in a broader context of so-called extra-classical receptive fields of V1 cells. Although low-contrast Gabor patches forming an illusory path may produce surround facilitation (Kapadia et al., Reference Kapadia, Ito, Gilbert and Westheimer1995; Mizobe et al., Reference Mizobe, Polat, Pettet and Kasamatsu2001; Hess et al., Reference Hess, Hayes and Field2003), collinear objects of sufficient contrast evoke surround suppression [for review see Series et al. (Reference Series, Lorenceau and Fregnac2003)]. Surround suppression is well expressed under a very wide range of contrasts except for very low contrasts close to the sensory threshold (Polat & Norcia, Reference Polat and Norcia1996; Polat et al., Reference Polat, Mizobe, Pettet, Kasamatsu and Norcia1998; Chen et al., Reference Chen, Kasamatsu, Polat and Norcia2001; Henry et al., Reference Henry, Joshi, Xing, Shapley and Hawken2013). The inducer discs forming the Kanizsa figures used in the present experiment as well as in most other similar experiments have collinear luminance borders at high contrast far exceeding the sensory threshold, thus they should potentially evoke surround suppression.
Importantly, the effect of iso-orientation suppression in V1 appears rather early—it was reported to be pronounced well within the first 100 ms (Bair et al., Reference Bair, Cavanaugh and Movshon2003; Henry et al., Reference Henry, Joshi, Xing, Shapley and Hawken2013; Liu et al., Reference Liu, Hashemi-Nezhad and Lyon2013), and thus it perfectly matches the timing of the inverted IC effect found in the current study.
Surround suppression in V1 cells occurs if iso-oriented objects are presented simultaneously both inside and outside the cell’s classical receptive field. Thus, in order for the surround suppression to be evoked by Kanizsa figures, a real luminance border of a pacman should be projected inside a cell’s receptive field, while an iso-oriented luminance border belonging to another pacman should be projected outside the classical receptive field. One may question whether the sizes of gaps within Kanizsa stimuli used in the current experiment are compatible with the surround suppression explanation. The gaps in collinear borders were 0.9 and 1.8° for the small and big stimuli, respectively. Although there is some controversy in literature concerning the spatial extent of extra-classical effects, these gap sizes would most likely allow the effects of collinearity in Kanizsa figures, since contextual modulation can extend up to 3° according to Alexander and Wright (Reference Alexander and Wright2006) and even up to 12° (Mizobe et al., Reference Mizobe, Polat, Pettet and Kasamatsu2001); even greater values were obtained by way of optical recording in cats (Vanni & Casanova, Reference Vanni and Casanova2013) [refer also to discussions in Series et al. (Reference Series, Lorenceau and Fregnac2003), Murray and Herrmann (Reference Murray and Herrmann2013), and Nurminen and Angelucci (Reference Nurminen and Angelucci2014)].
Thus, the considerations presented above make it reasonable to believe that Kanizsa figures, which have very sharp collinear borders and high contrast largely exceeding the sensory threshold, may indeed engage mechanisms of surround suppression in V1—leading to weaker net V1 activation in response to a Kanizsa figure compared with controls.
Why the inverted IC effect is hard to detect in neuroimaging studies
Reports of any effects within V1/V2 in response to ICs are rare in EEG/MEG studies—with some important exceptions (Ohtani et al., Reference Ohtani, Okamura, Shibasaki, Arakawa, Yoshida, Toyama and Ejima2002; Proverbio & Zani, Reference Proverbio and Zani2002; Halgren et al., Reference Halgren, Mendola, Chong and Dale2003; Knebel & Murray, Reference Knebel and Murray2012). Surprisingly, the suppressive effect of Kanizsa stimuli found in our MEG study has not been observed in previous EEG/MEG studies. Several EEG reports specifically addressed the issue of spatial and temporal distribution of the IC effect across the brain using Kanizsa stimuli (Shpaner et al., Reference Shpaner, Murray and Foxe2009; Altschuler et al., Reference Altschuler, Molholm, Russo, Snyder, Brandwein, Blanco and Foxe2012). Contrary to our MEG finding, no statistically significant early effects were found in the primary visual cortex.
The first explanation of the discrepancy with the previous finding is the difficulties arising from the detection of the weak signal generated by deep sources in the primary visual cortex, which is located far from EEG/MEG sensors. Since the IC effects were shown to involve very small V1 retinotopic regions corresponding to key elements of the stimuli (Maertens et al., Reference Maertens, Pollmann, Hanke, Mildner and Moller2008), the IC effect within the EEG signal may be weak and hard to detect due to low signal-to-noise ratio. To this end, the use of MEG recording technique in our study favored detection of neural activity from the sources localized at the medial aspect of occipital lobe. Indeed, recent research reported a 10-fold increase in sensitivity of MEG comparing to EEG in respect to electromagnetic signals originating from primary visual cortex (Muthukumaraswamy & Singh, Reference Muthukumaraswamy and Singh2013; Orekhova et al., Reference Orekhova, Butorina, Sysoeva, Prokofyev, Nikolaeva and Stroganova2015). Besides, in the study of Altschuler et al. (Reference Altschuler, Molholm, Russo, Snyder, Brandwein, Blanco and Foxe2012) the extensive statistical search was done at the level of EEG electrodes rather than sources—while the early effect in the primary visual cortex may be masked by other sources of brain activity located at the lateral cortical surface, i.e., closer to EEG electrodes. In the study of Shpaner et al. (Reference Shpaner, Murray and Foxe2009), the sources of EEG activity were analyzed, but the stimuli had much smaller support ratio than those used in the current study.
Beyond the recording technique, the detectability of an early IC effect in noninvasive studies strongly depends on the features of a visual display creating the illusion. For example, Shpaner et al. (Reference Shpaner, Molholm, Forde and Foxe2013) recently conducted a high-density EEG study of IC effects using “pathfinder displays” formed of Gabor patches and found no indication of early effects in V1 within the first 100 ms after stimulus onset, with LOC being the first site of IC-related activation occurring at 170 ms post-stimulus. However, the conclusion published should not be generalized to other ICs displayed. Indeed, EEG studies employing Kanizsa stimuli instead of noise-embedded Gabor “pathfinder displays” (Murray et al., Reference Murray, Wylie, Higgins, Javitt, Schroeder and Foxe2002a ; Brodeur et al., Reference Brodeur, Lepore, Lepage, Bacon, Jemel and Debruille2008), found a substantially shorter latency of a direct IC effect than that reported by Shpaner et al. (Reference Shpaner, Molholm, Forde and Foxe2013). Supposedly, since the ICs formed of Gabor patches were embedded in noise consisting of other numerous Gabor patches, relatively low-amplitude early effects including the early V1 signal could have been statistically masked by responses to the “noise” of distracting Gabor patches.
Still, the main source of the apparent difficulty to detect the early inverted IC effect in V1 in human neuroimaging studies seems to be primarily related to mutual cancellation of spatially distinct but temporally overlapping excitatory and suppressive IC effects in brain activity. Particularly, an increase in P1 amplitude around 100 ms after stimulus onset was found in response to illusory figures; source localization demonstrated that the effect was generated in extrastriate areas far from V1 (Brodeur et al., Reference Brodeur, Lepore, Lepage, Bacon, Jemel and Debruille2008). The first signs of the “direct” IC effect may be detected in LOC at 88 ms (Murray et al., 2002Reference Murray, Wylie, Higgins, Javitt, Schroeder and Foxe a ). Thus, the direct IC effect in LOC partially overlaps in time with the inverted IC effect in V1. This stronger early excitatory effect might prevail and mask the early inverted effect in noninvasive neuroimaging studies.
Similarly, only few PET/fMRI studies report any effects within V1/V2 in response to the ICs (Hirsch et al., Reference Hirsch, Delapaz, Relkin, Victor, Kim, Li, Borden, Rubin and Shapley1995; Ffytche & Zeki, Reference Ffytche and Zeki1996; Goebel et al., Reference Goebel, Khorram-Sefat, Muckli, Hacker and Singer1998; Larsson et al., Reference Larsson, Amunts, Gulyas, Malikovic, Zilles and Roland1999; Seghier et al., Reference Seghier, Dojat, Delon-Martin, Rubin, Warnking, Segebarth and Bullier2000; Sasaki & Watanabe, Reference Sasaki and Watanabe2004; Maertens et al., Reference Maertens, Pollmann, Hanke, Mildner and Moller2008); activation usually found in these studies may correspond to late and relatively strong excitatory effects in V1/V2 (Lee & Nguyen, Reference Lee and Nguyen2001; Shpaner et al., Reference Shpaner, Molholm, Forde and Foxe2013), which spatially overlaps with the early inverted IC effect and thus may mask it due to low time resolution of the method [but cf. Mendola et al. (Reference Mendola, Dale, Fischl, Liu and Tootell1999)].
These considerations suggest that the combination of the following methodological features of the present study were advantageous for detection of the inverted IC effect. We used Kanizsa figures with rather high support ratio of 2:3, which could have favored the collinearity effect by increasing the surround suppression (Series et al., Reference Series, Lorenceau and Fregnac2003). The participants passively viewed the visual stimuli under constant video surveillance control, which apparently disciplined them and made them continuously keep their gaze at the screen center. Unlike most of the neuroimaging IC studies mentioned above, the current task did not involve any target stimuli: “targetness” of stimuli is known to strongly affect the results of IC studies (Herrmann & Mecklinger, Reference Herrmann and Mecklinger2000), while the current study was devoid of this confounding variable. MEG recording was used, which is generally more sensitive than EEG in terms of signal-to-noise ratio for signals originating from the medial surface of the occipital lobe (Muthukumaraswamy & Singh, Reference Muthukumaraswamy and Singh2013; Orekhova et al., Reference Orekhova, Butorina, Sysoeva, Prokofyev, Nikolaeva and Stroganova2015), and allows more precise localization of activity sources in the brain than EEG and more precise timing of activity than PET and fMRI. Most importantly, the statistical analysis of MEG data was guided by previous results (Stroganova et al., Reference Stroganova, Orekhova, Prokofyev, Tsetlin, Gratchev, Morozov and Obukhov2012), and it was restricted both in space and in time, thereby avoiding unnecessary multiple comparisons inflating a possibility of type 2 error.
It should also be stressed that the inverted IC effect found in the current study may be specific to a particular subset of IC stimuli such as modal Kanizsa stimuli, since it supposedly depends upon iso-oriented collinear borders with no elements visually obscuring the gap between the collinear luminance borders [cf. Peterhans and Von der Heydt (Reference Peterhans and Von der Heydt1989)]. Thus the inverted IC effect found here is less likely to be detected or may be different for other stimuli commonly used in IC studies such as abutting gratings and amodal Kanizsa stimuli. The existence of the inverted IC effect for different types of ICs should be tested in future research.
Interestingly, unlike IC perception, perception of Gestalt images was found in a number of fMRI studies to suppress brain activity within early retinotopic areas (Murray et al., Reference Murray, Kersten, Olshausen, Schrater and Woods2002b ; Fang et al., Reference Fang, Kersten and Murray2008; de-Wit et al., Reference de-Wit, Kubilius, Wagemans and Op de Beeck2012). Seemingly, Gestalt images involve more collinear borders than scrambled images—making these effects relevant to the current discussion. Kanizsa illusion apparently involves a Gestalt-like percept of a luminous square overlaid over black discs.
Conclusions
Using a strictly aimed approach, we detected the early inverted IC effect—i.e., the reduction in activity to Kanizsa figures compared to controls—both at sensor and source levels. To our knowledge, it has never been demonstrated directly in EEG/MEG studies in adult participants. Validity of the effect found is supported by the facts that it was reproduced for stimuli of both sizes, and that cortical localization of the effect was predictably related to the IC eccentricity.
The likely explanation of the early inverted IC effect found in the present study is surround suppression induced by iso-oriented luminance borders (Sillito & Jones, Reference Sillito and Jones1996; Jones et al., Reference Jones, Grieve, Wang and Sillito2001; Ishikawa et al., Reference Ishikawa, Shimegi, Kida and Sato2010; Hashemi-Nezhad & Lyon, Reference Hashemi-Nezhad and Lyon2012; Henry et al., Reference Henry, Joshi, Xing, Shapley and Hawken2013; Vanni & Casanova, Reference Vanni and Casanova2013; Nurminen & Angelucci, Reference Nurminen and Angelucci2014). Currently the effect of surround suppression by collinear lines is viewed in terms of efficient, sparse coding, or information maximization principle (Series et al., Reference Series, Lorenceau and Fregnac2003; Zhu & Rozell, Reference Zhu and Rozell2013; Nurminen & Angelucci, Reference Nurminen and Angelucci2014). This approach postulates that the brain has intrinsic mechanisms minimizing informational redundancy so that a neural population uses as few active units as possible to represent a stimulus. Thus, a luminance border would be deemphasized on the most part of its course—with the exception of its ends, while surround facilitation by cross-oriented stimuli may be a mechanism to emphasize junctions and corners of geometrical shapes (Jones et al., Reference Jones, Wang and Sillito2002). This mechanism likely comprises an important early computational stage leading to image de-texturizing, figure-ground segregation, second-order feature encoding, and increasing salience of behaviorally relevant image features (Vanni & Casanova, Reference Vanni and Casanova2013; Gheorghiu et al., Reference Gheorghiu, Kingdom and Petkov2014; Hallum & Movshon, Reference Hallum and Movshon2014; Nurminen & Angelucci, Reference Nurminen and Angelucci2014), thus creating an informationally effective “optimized” code of the original retinal image (Nurminen & Angelucci, Reference Nurminen and Angelucci2014) ready for further analysis. The critical step of object contour detection per se is known to happen later in the pathway of visual processing and primarily depends upon LOC (Brighina et al., Reference Brighina, Ricci, Piazza, Scalia, Giglia and Fierro2003; Murray & Herrmann, Reference Murray and Herrmann2013; Shpaner et al., Reference Shpaner, Molholm, Forde and Foxe2013).
Acknowledgments
The study was implemented in the framework of the Basic Research Program at the National Research University Higher School of Economics (HSE) in 2015.
The authors would like to acknowledge the invaluable contribution of Dr. Elena I. Evina and Dzerassa E. Goyaeva in conducting the experiments, and of Anna N. Kravchenko in part of data processing. We also greatly appreciate very instructive advice on data processing from Dr. Alexei E. Ossadtchi and Anna V. Butorina.
Abbreviations
- ANOVA
-
analysis of variance
- EEG
-
electroencephalogram
- ERP
-
event-related potential
- fMRI
-
functional magnetic resonance imaging
- IC
-
illusory contour
- LOC
-
lateral occipital complex
- MEG
-
magnetoencephalogram
- MRI
-
magnetic resonance imaging
- MT
-
middle temporal area
- PET
-
positron emission tomography
- RMS
-
root mean square
- ROI
-
region of interest
- SPM
-
statistical parametric map
- TFCE
-
threshold-free cluster enhancement
- V1/V2
-
lower order visual areas