Introduction
Major depressive disorder (MDD) is a disabling psychiatric disorder characterized by mood, psychomotor, cognitive and vegetative symptoms. Evidence suggests that an altered interplay among multiple brain areas is associated with the symptom heterogeneity present in this disorder (Northoff et al. Reference Northoff, Wiebking, Feinberg and Panksepp2011). Furthermore, recent reports have emphasized the role of altered functional coupling within brain circuits even at rest (Greicius et al. Reference Greicius, Flores, Menon, Glover, Solvason, Kenna, Reiss and Schatzberg2007; Sheline et al. Reference Sheline, Price, Yan and Mintun2010; Berman et al. Reference Berman, Peltier, Nee, Kross, Deldin and Jonides2011), and not only during emotional and cognitive tasks (Anand et al. Reference Anand, Li, Wang, Wu, Gao, Bukhari, Mathews, Kalnin and Lowe2005; Vasic et al. Reference Vasic, Walter, Sambataro and Wolf2009).
Studies in healthy individuals have helped in the identification of functional connectivity within brain networks during the so-called ‘resting state’, which is defined as an experimental setting in which the participant is not required to perform any goal-directed tasks. Interestingly, spatially distinct regions of the brain show a high synchronicity between low-frequency fluctuations (LFFs; f < 0.08 Hz) in the blood oxygen-level dependent (BOLD) signal, indicating functional connectivity in several networks at rest, including the default mode network (DMN). They are thought to be caused by spontaneous neuronal activity and to reflect the intrinsic wiring of the brain (Auer, Reference Auer2008). The few studies that have investigated LFFs in individuals with MDD have found mixed results in patients (Anand et al. Reference Anand, Li, Wang, Wu, Gao, Bukhari, Mathews, Kalnin and Lowe2005; Yao et al. Reference Yao, Wang, Lu, Liu and Teng2009; Guo et al. Reference Guo, Liu, Xue, Yu, Ma, Tan, Sun, Chen, Liu, Xiao, Chen and Zhao2011) and this could be due to artefacts from physiological noise. A more reliable index, the fractional amplitude of LFFs fALFF), has been recently introduced (Zou et al. Reference Zou, Zhu, Yang, Zuo, Long, Cao, Wang and Zang2008) and used to demonstrate altered prefronto-limbic function in MDD (Liu et al. Reference Liu, Guo, Liu, Long, Ma, Xue, Wang, Li, Hu, Zhang, Du, Zeng, Liu, Wooderson, Tan, Zhao and Chen2013).
The brain regions with the highest amplitude of LFFs at rest span across a large-scale system of the brain, the so-called DMN (Raichle et al. Reference Raichle, MacLeod, Snyder, Powers, Gusnard and Shulman2001). The DMN includes a set of brain regions with greater activity during an experimentally defined ‘rest’ or ‘baseline’ relative to a goal-directed behaviour (Raichle et al. Reference Raichle, MacLeod, Snyder, Powers, Gusnard and Shulman2001). The DMN is thought to mediate several functions including emotional and self-referential processing, memory, internal mentation, and the allocation of attentional resources for cognitive processing (Broyd et al. Reference Broyd, Demanuele, Debener, Helps, James and Sonuga-Barke2009; Andrews-Hanna et al. Reference Andrews-Hanna, Reidler, Sepulcre, Poulin and Buckner2010; Sambataro et al. Reference Sambataro, Murty, Callicott, Tan, Das, Weinberger and Mattay2010b ). Notably, all of these functions are altered in individuals with MDD (Murrough et al. Reference Murrough, Iacoviello, Neumeister, Charney and Iosifescu2011). Anatomically, the DMN includes both midline areas, one more anterior that includes the medial prefrontal cortex (mPFC) and one more posterior entailing the posterior cingulate cortex (PCC) and the precuneus, as well as lateral areas encompassing bilateral inferior temporo-parietal cortexes and medial temporal lobes (Andrews-Hanna et al. Reference Andrews-Hanna, Reidler, Sepulcre, Poulin and Buckner2010). Functional neuroimaging studies in individuals with MDD at rest have found widespread alterations in the DMN. Increases in task activations in the medial anterior regions of the DMN including the subgenual cingulated cortex (sgCC), perigenual cingulated cortex (pgCC), ventral mPFC and mPFC/orbitofrontal cortex have been reported (Enzi et al. Reference Enzi, Duncan, Kaufmann, Tempelmann, Wiebking and Northoff2012), whereas few studies have found increased task deactivations in the posterior regions, such as the PCC and the precuneus (for a review, see Broyd et al. Reference Broyd, Demanuele, Debener, Helps, James and Sonuga-Barke2009). More ventrally, alterations in the hippocampus and parahippocampus have been also reported (Price & Drevets, Reference Price and Drevets2010).
Most notably, however, recent studies in monkeys and humans have challenged the notion of a unitary DMN system and suggested that its architecture can be further subdivided into smaller anatomical–functional subsystems (Andrews-Hanna et al. Reference Andrews-Hanna, Reidler, Sepulcre, Poulin and Buckner2010). The interplay among subsystems within the DMN is thought to be crucial for the physiological function of this system (Damoiseaux et al. Reference Damoiseaux, Prater, Miller and Greicius2012). Alterations of the interaction between the DMN and task-related networks have been reported in several psychiatric disorders including MDD, but the extent to which altered function of different DMN subsystems can contribute to the pathophysiology of MDD is not known. BOLD activity in one network can influence the BOLD activity of another network both at rest and during a goal-directed task (Stevens et al. Reference Stevens, Pearlson and Calhoun2009). The network-to-network interaction can be evaluated using the temporal dependence among different networks (Jafri et al. Reference Jafri, Pearlson, Stevens and Calhoun2008; Stevens et al. Reference Stevens, Pearlson and Calhoun2009) and defined in terms of causality, thus providing measures of effective connectivity across networks. Recently, Hamilton et al. (Reference Hamilton, Chen, Thomason, Schwartz and Gotlib2011) investigated effective connectivity using Granger causality between several brain regions in patients with MDD at rest. They found alterations of this measure across the hippocampus, anterior cingulated cortex (ACC), ventral and dorsal mPFC, PCC and dorsolateral PFC. Nonetheless, the effective connectivity between specific anatomical–functional subsystems of the DMN remains unexplored.
In this study, we analysed resting-state functional connectivity in MDD by characterizing LFFs, functional changes within distinct DMN subsystems and the functional interplay between these subsystems. We tested the hypothesis that activity and effective connectivity in the DMN subsystems are altered in individuals with MDD. Furthermore, we hypothesized that these network changes would be associated with depression severity.
Method
Participants
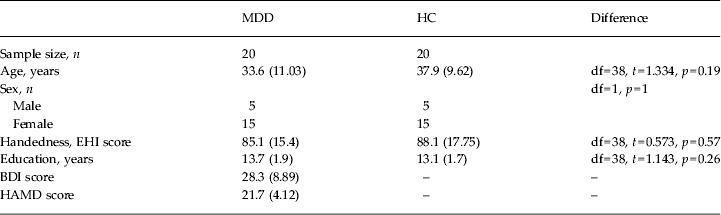
A total of 20 patients with MDD and 20 healthy controls, matched for age, gender and handedness, participated in this study (Table 1. Handedness was assessed with the Edinburgh Questionnaire (Oldfield, Reference Oldfield1971). Exclusion criteria included past history or the presence of any medical or neurological disorders, presence of drug or alcohol abuse, and past head trauma with loss of consciousness. Normal controls were excluded if they presented a past history or a current diagnosis of psychiatric disorders, or of drug and alcohol abuse or dependence as documented by Structured Clinical Interview for DSM-IV (SCID-IV) or drug treatment (except birth control pills in young women). Diagnostic assessments using the German versions of the SCID-IV Axis I and II disorders were performed by clinically trained raters (R.C.W. and N.D.W.) for patients and controls. In addition to a detailed interview conducted by an experienced clinical psychiatrist, case notes were reviewed to corroborate a definitive diagnosis of MDD and exclude any co-occurrent Axis I or II disorders. Depression severity was evaluated using the Beck Depression Inventory (BDI) and the 21-item Hamilton Rating Scale for Depression (HAMD). In all, 14 patients were on a psychotropic treatment at the time of the scan (see online Supplementary Table S1). To evaluate potential effects of drugs in patients, we reanalysed the imaging data with non-parametric statistics after excluding patients on psychotropic drugs at the time of the data acquisition. Patients were recruited from the in- and out-patients treated at the Department of Psychiatry and Psychotherapy III, University of Ulm, Germany. No patient was recruited through study-specific advertising. All participants gave written informed consent, approved by the Institutional Review Board of the University of Ulm, to take part in the experiment.
Demographics and clinical variables

MDD, Major depressive disorder; HC, normal healthy controls; df, degrees of freedom; EHI, Edinburgh Handedness Inventory; BDI, Beck Depression Inventory; HAMD, Hamilton Rating Scale for Depression.
Data are given as mean (standard deviation).
Imaging acquisition
Magnetic resonance imaging (MRI) data were acquired on a 3-T MAGNETOM Allegra (Siemens, Germany) head MRI system at the Department of Psychiatry and Psychotherapy III at the University of Ulm, Germany. A total of 180 BOLD T2-weighted images were acquired using echo-planar imaging. Each functional image consisted of 33 3-mm thick axial slices covering the entire brain [repetition time (TR) = 2000 ms; echo time (TE) = 30 ms; field of view = 192 mm; flip-angle = 80°; matrix = 64 × 64; gap = 1 mm]. For the 6-min resting state, scanning was carried out in darkness, and the participants were instructed to relax without falling asleep, to keep their eyes closed, not to think about anything special and to move as little as possible. All individuals were specifically scanned for the main purpose of this project, which was to investigate DMN subsystem connectivity at rest. Thus, the scanning procedure did not involve any experimental tasks prior to or after the resting-state scan, nor were participants asked to perform any cognitive tasks offline. A high-resolution structural scan was also acquired after the BOLD data using a three-dimensional magnetization-prepared rapid gradient-echo (3D-MPRAGE) sequence (TE = 3.93 ms; TR = 2080 ms; TI = 1100 ms; FOV = 256; resolution = 1.0 × 1.0 × 1.0 mm; number of slices = 256).
Imaging processing
All the imaging data were preprocessed using AFNI (Cox, Reference Cox1996) and FSL (www.fmrib.ox.ac.uk) with the 1000 Functional Connectomes Project scripts (www.nitrc.org/projects/fcon_1000, see online Supplementary material).
Independent component analysis (ICA)
A group of spatial ICA was performed on preprocessed data using the Group ICA of fMRI Toolbox (GIFT 2.0e; http://icatb.sourceforge.net) as described elsewhere (Sambataro et al. Reference Sambataro, Murty, Callicott, Tan, Das, Weinberger and Mattay2010b ). Following recent reports of low dimensionality of resting-state data, we set the number of components to 20 (Smith et al. Reference Smith, Fox, Miller, Glahn, Fox, Mackay, Filippini, Watkins, Toro, Laird and Beckmann2009; Biswal et al. Reference Biswal, Mennes, Zuo, Gohel, Kelly, Smith, Beckmann, Adelstein, Buckner, Colcombe, Dogonowski, Ernst, Fair, Hampson, Hoptman, Hyde, Kiviniemi, Kotter, Li, Lin, Lowe, Mackay, Madden, Madsen, Margulies, Mayberg, McMahon, Monk, Mostofsky, Nagel, Pekar, Peltier, Petersen, Riedl, Rombouts, Rypma, Schlaggar, Schmidt, Seidler, Siegle, Sorg, Teng, Veijola, Villringer, Walter, Wang, Weng, Whitfield-Gabrieli, Williamson, Windischberger, Zang, Zhang, Castellanos and Milham2010; Zuo et al. Reference Zuo, Kelly, Adelstein, Klein, Castellanos and Milham2010). The dimensionality of functional data for each subject was reduced with two consecutive steps of principal component analysis alternated with temporal concatenation, resulting in one aggregate mixing matrix for the entire sample. ICA decomposition was performed using the Infomax algorithm and resulted in 20 independent components (ICs) consisting of group spatial maps and related time courses (TCs), which were included in the mixing matrix. Group estimated ICs were then back-reconstructed using a dual regression approach (Beckmann et al. Reference Beckmann, Mackay, Filippini and Smith2009). Individual subject IC maps were then calibrated using Z scores for between-participant comparisons. Finally, all ICs were screened for reliability as indicated by a coefficient of stability (Iq) of > 0.95 calculated by 100 bootstrapped permutated estimations of the ICs (ICASSO) and for artefactual patterns defined by those ICs with a spatial correlation R 2 > 0.02 with white matter, R 2 > 0.05 for cerebrospinal fluid and R 2 < 0.001 with grey matter. After this screening, 12 ICs with high spatial correlation (R 2 > 0.02) with the DMN resting-state labeller templates provided with GIFT (Sambataro et al. Reference Sambataro, Fazio, Taurisano, Gelao, Porcelli, Mancini, Sinibaldi, Ursini, Masellis, Caforio, Di Giorgio, Niccoli-Asabella, Popolizio, Blasi and Bertolino2013) were selected for further analyses. For each participant, an IC spatial map includes voxel-wise IC loadings that represent local strength of functional connectivity and reflect the correspondence between the estimated TCs in each voxel for each individual and the average TC of the aggregate network itself.
Fractional amplitude of low frequency fluctuations
Voxel-wise spectral power density was computed using a fast Fourier transformation. In a preprocessed time series, fALFF was computed as the ratio between the sum of amplitudes within the low-frequency range (0.01–0.1 Hz) and the total sum of amplitudes across the entire frequency range for each voxel (Zou et al. Reference Zou, Zhu, Yang, Zuo, Long, Cao, Wang and Zang2008). Individual fALFF maps in native space were eventually Z-transformed and registered to the Montreal Neurological Institute (MNI) space.
Group-level imaging analyses
Each subject's IC and fALFF maps were entered into SPM8 (Wellcome Department of Cognitive Neurology, UK; http://www.fil.ion.ucl.ac.uk) and analysed using second-level random-effects analyses. One-way analyses of variance, masked by the main effect map of each DMN-IC and fALFF for all subjects (p < 0.001) with diagnosis as the between-subjects variable, were used to assess the effect of MDD on brain connectivity and LFFs, respectively. The extent of the region-of-interest mask was for IC-3 = 468 ml, for IC-5 = 406 ml, for IC-16 = 555 ml, for IC-18 = 549 ml, and for fALFF = 440 ml, respectively. Although age was not significantly different across groups (p = 0.19), to exclude any effect of this variable on our results we reanalysed diagnosis effects with analyses of covariance with age as a nuisance variable. The first eigenvariate of the connectivity strength measured by IC loadings and of the fALFF values extracted from significant clusters as well as the power amplitude within the low-frequency bin of DMN subsystem ICs were correlated with MDD severity measured using the BDI and HAMD. Significant clusters were identified using an uncorrected voxel-wise threshold of p < 0.001. To correct for multiple comparisons with a family-wise rate at p < 0.05, a minimum cluster size of 15, 20, 19, 15 and 15 contiguous voxels was estimated for the whole brain for IC-3, IC-5, IC-16, IC-18 and fALFF, respectively. These cluster extent thresholds were estimated with 10 000 iterations of a Monte Carlo simulation using Clustsim (http://afni.nimh.nih.gov/pub/dist/doc/program_help/3dClustSim.html). All coordinates are reported in the MNI system.
Functional network connectivity (FNC)
In ICA of functional MRI data, Granger causality can be used to infer that the time series of one IC causes or influences the activity of another IC. Here, we used the generalized partial direct coherence method (GDPC; Baccala et al. Reference Baccala, Takahashi and Sameshima2007) as implemented in the Functional Network Connectivity Toolbox (FNC2.3; http://mialab.mrn.org/software/fnc/index.html) to estimate Granger causality within frequency domains. This method allows robust variance stabilization of the frequency domain representation of Granger causality with improved reliability of the decision error rate of this measure. Multivariate vector autoregressive (MAR) models were fitted for the bandfiltered (0.01 < f < 0.24 Hz) TCs of the four DMN subsystems estimated after back-reconstruction for each subject separately. The order of selection of the MAR models for the entire group was estimated using the Bayesian information criterion on the time series across all subjects. Each subject's GDPC was then calculated on the MAR model coefficients for each frequency for each pair of DMN subsystem time series following Baccala et al. (Reference Baccala, Takahashi and Sameshima2007). Randomization of group labels was performed 10 000 times, thus creating the null distribution of the test statistic. One-sample t tests and two-sample t tests were used to evaluate the significance of the GDPC within and between diagnostic groups, respectively. Multiple comparison testing significance was assessed using false discovery rate (FDR) correction with α = 0.05 against the null distribution.
Results
Identification of DMN subsystems
Four ICs spanned across the DMN regions and were defined as part of this network through spatial correlation with the DMN templates (p < 0.0001): IC-3 (posterior DMN, r = 0.26); IC-5 (ventral DMN, r = 0.15); IC-16 (anterior DMN, r = 0.49); and IC-18 (core DMN, r = 0.19) (online Supplementary Fig. S1).
Effect of diagnosis on DMN subsystems
Spatial maps
Patients with MDD had greater IC loadings in the PCC within the posterior DMN (BA 31; x, y, z = −12, −42, −27, Z = 4.00, k = 23; Fig. 1 a). Within the ventral DMN, patients with MDD had greater IC loadings in the right hippocampus (x, y, z, = 27, −33, −6, Z = 4.35, k = 20; Fig. 1 b). Within the core DMN, MDD patients had greater IC loadings in the sgCC (BA25; x, y, z = 3, 30, −18, Z = 4.01, k = 27; Fig. 1 c), retrosplenial PCC (BA30; x, y, z = 15, −54, 6, Z = 4.04, k = 19; Fig. 1 c) and the right lateral temporo-parietal cortex (BA39/19; x, y, z = 39, −69, 21, Z = 3.77, k = 19). We did not find any diagnosis effect for the anterior DMN. We found similar differences when covarying out the effect of age (see online Supplementary Fig. S3), and when we limited our analyses to drug-free patients (see online Supplementary Fig. S4 and Table S3).
Effect of diagnosis on functional connectivity within default mode network (DMN) subsystems. Patients with major depressive disorder had increased connectivity strength in the posterior cingulate (a) within the posterior DMN, in the right hippocampus (b) within the ventral DMN, and the subgenual and retrosplenial posterior cingulate (c) within the core DMN relative to healthy controls. Sagittal projections of the T-maps of DMN connectivity differences are thresholded with a voxel-wise p = 0.001 and corrected for multiple comparisons at the level of cluster (p < 0.05) and overlaid on the Montreal Neurological Institute (MNI) brain template. Colour bars indicate T scores.

Spectral analysis
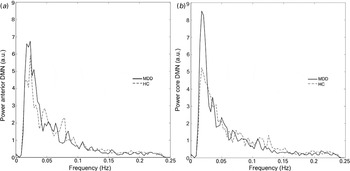
We found increased LFFs (f < 0.04 Hz bin) in the anterior DMN in patients with MDD (t 38 = 2.128, p = 0.03) relative to normal controls (Fig. 2 a). A similar trend was also found in the core DMN (t 38 = 1.646, p = 0.1; Fig. 2 b). No differences were found in the LFFs of other components (online Supplementary Fig. S5 and Fig. S6). Furthermore, in MDD patients we found a negative correlation between the amplitude of the LFFs bin of the anterior DMN (r = −0.49, p = 0.03 uncorrected; online Supplementary Fig. S7a), the core DMN (r = −0.44, p = 0.05 uncorrected; online Supplementary Fig. S7b), the ventral DMN (r = −0.43, p = 0.05 uncorrected; online Supplementary Fig. S7c) and BDI scores.
Effect of diagnosis on default mode network (DMN) subsystem spectra. Patients with major depressive disorder (MDD) had greater low-frequency fluctuations (LFFs) (f < 0.04 Hz, p = 0.04) in the anterior DMN (a) and a marginal increase in LFFs in the core DMN (b) (p = 0.1) relative to normal healthy controls (HC). a.u., Arbitrary units.

DMN subsystems' FNC
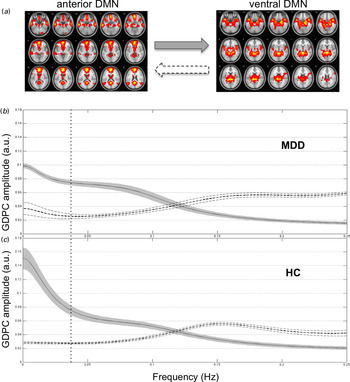
One-sample t tests revealed that the DMN subsystems were significantly connected (p < 0.05, FDR-corrected) with the following directionality in both patients and healthy controls (online Supplementary Fig. S8): anterior DMN→ventral DMN; anterior DMN→posterior DMN; anterior DMN→core DMN; core DMN→ventral DMN; and core DMN→posterior DMN. In contrast, the posterior DMN→ventral DMN connection was significant only in the MDD group (p < 0.001, FDR-corrected). In patients with MDD, the Granger causality between the anterior and ventral DMN (Fig. 3 a) was significantly reduced (p = 0.005, FDR-corrected; Fig. 3 b, c) within the low-frequency domain range (f < 0.04 Hz).
Effect of diagnosis on functional network connectivity (FNC) within default mode network (DMN) subsystems. Patients with major depressive disorder (MDD) had reduced (p < 0.05, false discovery rate-corrected) FNC measured using Granger partial direct coherence (GDPC) from the anterior DMN to the ventral DMN (a). GDPC was reduced in MDD subjects (b) relative to healthy controls (HC) (c) in the low frequency range (f < 0.04 Hz). The dotted line indicates f = 0.04 Hz. The solid line and grey confidence interval (CI) bands represent GDPC from the anterior DMN to the ventral DMN; the dashed line and white CI bands represent GDPC from the ventral DMN to the core DMN. a.u., Arbitrary units.

LFFs
To evaluate neural differences in the brain regions (including DMN subsystems) associated with LFFs, we used the fALFF approach. fALFF maps encompassed the precuneus, PCC, caudal and rostral cingulate, bilateral putamen, superior parietal cortex, lateral frontal and temporal cortices (online Supplementary Fig. S9). Patients with MDD had a significantly greater fALFF in the pgCC (x, y, z = −6, 42, −12, Z = 4.05, k = 16; online Supplementary Fig. S10a) relative to normal controls. fALFF showed a trend towards significance for the correlation with BDI scores (r = −0.38, p = 0.09; online Supplementary Fig. S10b).
Discussion
In this study, we investigated the function of multiple DMN subsystems at rest and their effective connectivity in individuals with MDD. Three main findings emerged. First, our results showed a widespread increase of DMN connectivity in the sgCC, right hippocampus, right lateral temporo-parietal cortex and PCC in MDD patients. Second, the spectral power in the low-frequency band in the anterior DMN, core DMN and in the pgCC was increased in individuals with MDD relative to controls. Third, Granger causality within the low-frequency range from the anterior to the ventral subsystem of the DMN was reduced in individuals with MDD compared with controls.
Previous imaging studies have reported functional differences in several medial and lateral brain regions within the DMN in patients with MDD at rest (Broyd et al. Reference Broyd, Demanuele, Debener, Helps, James and Sonuga-Barke2009). In this regard, while the DMN has been traditionally thought to represent a unitary neural system, recent studies have challenged this idea by showing that the DMN is fractionated into distinct subsystems with different anatomical and functional specificities (Andrews-Hanna et al. Reference Andrews-Hanna, Reidler, Sepulcre, Poulin and Buckner2010). Although DMN subsystems show some anatomical overlap, they are thought to have different functions (Andrews-Hanna et al. Reference Andrews-Hanna, Reidler, Sepulcre, Poulin and Buckner2010) whose alterations could be differentially relevant to MDD. Different fractionations of the DMN have been proposed (Uddin et al. Reference Uddin, Kelly, Biswal, Xavier Castellanos and Milham2009; Andrews-Hanna et al. Reference Andrews-Hanna, Reidler, Sepulcre, Poulin and Buckner2010; Sambataro et al. Reference Sambataro, Blasi, Fazio, Caforio, Taurisano, Romano, Di Giorgio, Gelao, Lo Bianco, Papazacharias, Popolizio, Nardini and Bertolino2010a , Reference Sambataro, Murty, Callicott, Tan, Das, Weinberger and Mattay b , Reference Sambataro, Fazio, Taurisano, Gelao, Porcelli, Mancini, Sinibaldi, Ursini, Masellis, Caforio, Di Giorgio, Niccoli-Asabella, Popolizio, Blasi and Bertolino2013; Whitfield-Gabrieli et al. Reference Whitfield-Gabrieli, Moran, Nieto-Castanon, Triantafyllou, Saxe and Gabrieli2011; Damoiseaux et al. Reference Damoiseaux, Prater, Miller and Greicius2012). Most studies have identified multiple subsystems including anterior, posterior, ventral and core subsystems. The midline core includes two widespread connected hubs (the mPFC and the PCC) with a non-specific role in self-referential processing, as well as separate subsystems. Within the core DMN, our data show increased connectivity in the anterior regions (sgCC) as well as in posterior regions (the PCC and the right middle temporal cortex). The sgCC plays an important role in the regulation of affect and visceromotor function, and in the experience of negative emotion (Price & Drevets, Reference Price and Drevets2010). Connectivity of the sgCC has been related to the length of depressive episodes (Siegle et al. Reference Siegle, Thompson, Carter, Steinhauer and Thase2007) and with illness severity (Sheline et al. Reference Sheline, Price, Yan and Mintun2010; Hamilton et al. Reference Hamilton, Chen, Thomason, Schwartz and Gotlib2011). In particular, increased sgCC connectivity with the PCC at rest has been shown to be associated with specific core symptoms of the disorder (Berman et al. Reference Berman, Peltier, Nee, Kross, Deldin and Jonides2011), and in particular rumination and brooding, but not reflection. The anterior hub of the DMN is also strongly connected with the lateral temporo-parietal cortex that has been implicated in autobiographical memory, theory of mind and prospection (Buckner et al. Reference Buckner, Andrews-Hanna and Schacter2008). We also found increased engagement of the lateral temporo-parietal cortex, and this could reflect alterations of these functions. The posterior system also has a role in cognitive and emotional processing, in familiarity and in autobiographical memory (Buckner et al. Reference Buckner, Andrews-Hanna and Schacter2008). We found increased engagement of the PCC. Increased task-induced deactivation in the PCC predicts depression severity in MDD (Grimm et al. Reference Grimm, Boesiger, Beck, Schuepbach, Bermpohl, Walter, Ernst, Hell, Boeker and Northoff2009). The ventral DMN subsystem, which encompasses the hippocampal formation, retrosplenial posterior cingulate, inferior parietal lobules and ventral mPFC, is preferentially recruited while envisioning the future (Andrews-Hanna et al. Reference Andrews-Hanna, Reidler, Sepulcre, Poulin and Buckner2010). The hippocampus has been implicated in MDD. Morphometric changes in the hippocampus have been extensively investigated in MDD, with a general finding of decreased volume in patients relative to normal controls (Price & Drevets, Reference Price and Drevets2010). Increased hippocampal response to sad faces (Surguladze et al. Reference Surguladze, Brammer, Keedwell, Giampietro, Young, Travis, Williams and Phillips2005), altered hippocampal activation during memory paradigms (increased activation during incorrect items relative to reduced activation during correctly remembered items; Fairhall et al. Reference Fairhall, Sharma, Magnusson and Murphy2010) as well as decreased responses have been also reported in MDD. At rest, increased cerebral blood flow (Videbech et al. Reference Videbech, Ravnkilde, Pedersen, Hartvig, Egander, Clemmensen, Rasmussen, Andersen, Gjedde and Rosenberg2002) along with increased nodal centrality in the hippocampus have been reported in MDD (Price & Drevets, Reference Price and Drevets2010; Zhang et al. Reference Zhang, Wang, Wu, Kuang, Huang, He and Gong2011), thus suggesting altered activity and connectivity of this brain region. Consistently, we found increased engagement of the right hippocampus in patients relative to normal controls within the ventral DMN subsystem. Hippocampal dysfunction could be associated with episodic memory impairments found in MDD (Fairhall et al. Reference Fairhall, Sharma, Magnusson and Murphy2010), a hypothesis that deserves further testing.
The current findings of the LFFs of the DMN at rest support the role of the anterior DMN subsystems in MDD. We found increased LFFs in brain regions (pgCC) and networks (anterior DMN and core DMN) implicated in MDD. Increased activity in the pgCC at rest has been reported in patients with MDD and correlates with rumination (Zhu et al. Reference Zhu, Wang, Xiao, Liao, Zhong, Wang and Yao2012) and the length of depressive episode (Greicius et al. Reference Greicius, Flores, Menon, Glover, Solvason, Kenna, Reiss and Schatzberg2007). Brain responses in the pgCC associated with emotional regulation and emotional judgment tasks are also increased in patients with MDD and correlate with the feeling of hopelessness (Grimm et al. Reference Grimm, Boesiger, Beck, Schuepbach, Bermpohl, Walter, Ernst, Hell, Boeker and Northoff2009). In our study, the anterior DMN subsystem had greater power in the LFF range and its interplay with ventral DMN was reduced in the same frequency domain in patients with MDD relative to normal controls. The precise nature of LFFs is still unknown, but available evidence suggests that they can reflect spontaneous neuronal activity, including non-neural neurovascular physiological mechanisms and noise (Auer, Reference Auer2008). Studies in anaesthetized monkeys have shown that LFFs can be associated with the power of band-limited oscillations, particularly in the γ frequency (Shmuel & Leopold, Reference Shmuel and Leopold2008). In humans, electroencephalogram (EEG)/functional MRI studies have indicated that the core DMN is associated with EEG power variations in the α and β range, whereas the anterior DMN subsystem BOLD signal fluctuations are linked with the γ power, thus suggesting a greater BOLD modulation relative to the rest of the DMN (Mantini et al. Reference Mantini, Perrucci, Del Gratta, Romani and Corbetta2007). Indeed, tonic deactivations are present in the anterior DMN regions relative to more posterior parts of the network (Dosenbach et al. Reference Dosenbach, Visscher, Palmer, Miezin, Wenger, Kang, Burgund, Grimes, Schlaggar and Petersen2006). The increased tonic engagement of the anterior DMN in patients with MDD relative to normal controls can contribute to MDD in two ways: first, by directly mediating depressive symptoms (rumination, brooding) and the severity of the disorder; and second, via an indirect route of reduced modulation of ventral DMN function that plays a role in cognitive symptoms and negative prospective thinking. Also, exploratory analyses in patients with MDD showed that a negative correlation of LFF in the pgCC as well as in the anterior and core DMN predicted depression severity. This association also supports the view of altered DMN subsystem interplay in MDD patients where lower LFF in the anterior and core DMN could not reduce limbic hyperactivity at rest, which ultimately results in greater depression severity as previously shown (Videbech et al. Reference Videbech, Ravnkilde, Pedersen, Hartvig, Egander, Clemmensen, Rasmussen, Andersen, Gjedde and Rosenberg2002).
Overall, our findings contribute to the extant literature on an altered engagement model of DMN in depression extending to DMN subsystems and their interplay. Previous studies have suggested that the modulation of the DMN is altered in MDD (Johnson et al. Reference Johnson, Nolen-Hoeksema, Mitchell and Levin2009; Sheline et al. Reference Sheline, Barch, Price, Rundle, Vaishnavi, Snyder, Mintun, Wang, Coalson and Raichle2009; Hamilton et al. Reference Hamilton, Chen and Gotlib2013). In patients the DMN activity, particularly anterior, is tonically increased during rest and reduced during affective processing compared with normal controls, thus suggesting the engagement of this network to be dependent more on spontaneous fluctuations (as suggested also by LFF findings) rather than on self-referential thinking (Hamilton et al. Reference Hamilton, Chen and Gotlib2013). In particular, altered engagement of the anterior and ventral DMN during non-self-referential processing could result in rumination (Johnson et al. Reference Johnson, Nolen-Hoeksema, Mitchell and Levin2009) and cognitive impairment (Wagner et al. Reference Wagner, Sinsel, Sobanski, Kohler, Marinou, Mentzel, Sauer and Schlosser2006), and in memory changes (Fairhall et al. Reference Fairhall, Sharma, Magnusson and Murphy2010), respectively. Our findings support this model and further specify how aberrant interplay between the anterior and ventral DMN could trigger the hyperactivity of limbic and paralimbic regions, thus contributing to MDD symptoms. We found reduced effective connectivity from the anterior to the ventral DMN in patients with MDD. The anterior DMN subsystem is connected to the ventral system via two different pathways: a direct route located lateral to the amygdala, and an indirect system via the fornix (Carmichael & Price, Reference Carmichael and Price1995), the latter of which has been implicated in a murine model of depression (Airan et al. Reference Airan, Meltzer, Roy, Gong, Chen and Deisseroth2007). Projections from the rostral cingulate send afferent fibres to the perirhinal and lateral entorhinal cortex that are connected with hippocampal CA1 regions via the uncinate fasciculus. In addition, the ACC is connected with the hippocampus via the anterior limb of the internal capsule (Gutman et al. Reference Gutman, Holtzheimer, Behrens, Johansen-Berg and Mayberg2009). Decreased modulation from the anterior DMN to the ventral DMN is consistent with increased hippocampal activity and further expands the findings of increased hippocampal to ventral ACC reports in animal (Airan et al. Reference Airan, Meltzer, Roy, Gong, Chen and Deisseroth2007) and human (Hamilton et al. Reference Hamilton, Chen, Thomason, Schwartz and Gotlib2011) studies on depression. While previous studies indicated that increased activity in the mPFC at rest would directly alter hippocampal function in MDD, thus resulting in rumination and impaired associative conditioning that are core psychopathological features associated with negative mood (Bar, Reference Bar2009), our data also suggest a role of altered effective connectivity between these subsystems. Interestingly, our findings could also contribute to explaining the effects of deep brain stimulation in patients with MDD. Lozano et al. (Reference Lozano, Mayberg, Giacobbe, Hamani, Craddock and Kennedy2008) stimulated via implanted electrodes in the white matter surrounding the ventral ACC of patients with treatment-resistant depression, with a dramatic reduction of depressive symptoms that was associated with a reduction of ventral ACC activity. A modulation of the ventral ACC could lead to a clinical improvement in MDD via a direct modulation of the anterior DMN subsystem to which it belongs, or indirectly through interplay with the ventral DMN, thus normalizing the activity of these brain networks, which are implicated in the pathogenesis of MDD.
We acknowledge an important limitation of this study. While all MDD patients were matched for demographics, some were taking antidepressant drugs at the time of the scan. Comparisons between a small cohort of off-drug patients and normal controls matched for demographics and clinical characteristics yielded similar significant findings compared with the MDD sample as a whole. Although this exploratory analysis suggests a limited effect of drug treatment on our results, larger studies are needed to exclude the effects of drug treatment.
Physiological noise could affect the estimation of functional connectivity during the resting state. A powerful approach to remove the effects of this source of noise is to perform a retrospective correction for cardiac and respiratory signals (Birn, Reference Birn2012). Alternatively, group ICA can robustly separate LFFs from DMN ICs when estimated using the ICASSO centrotype technique with only a slight impact on the estimation of connectivity in the posterior regions of the DMN (Starck et al. Reference Starck, Remes, Nikkinen, Tervonen and Kiviniemi2010). Our scanning protocol did not include the measurement of cardiac and respiratory signals, and thus we cannot completely exclude some contribution of these signals to our results.
Also, the MDD sample was relatively young (the lower age range for MDD onset) and without co-morbid disorders, thus allowing a more reliable estimation of functional connectivity differences associated with MDD. On the other hand, these clinical features reduce the generalizability of our results to the whole MDD population.
In conclusion, our findings indicate an important role of the altered engagement of DMN subsystems in MDD, and in particular of the alterations of brain connectivity within several DMN subsystems as well as between the anterior and the ventral DMN subsystems. Further studies are needed to ascertain the physiological and clinical relevance of the interplay between DMN subsystems and task-related networks in MDD, as well as the relevance of DMN subsystem-specific responses for clinical interventions in MDD.
Supplementary material
For supplementary material accompanying this paper, please visit http://dx.doi.org/10.1017/S0033291713002596.
Acknowledgements
This work was supported by Marie Curie Reintegration grants (no. FP7-256448 to M.P. and no. FP7-276981 to F.S.). We thank Natalia Nedelsky for editing of this manuscript. M.P. received research support from Siena Biotech, Italy. All the authors report no biomedical financial interests or potential conflicts of interest relevant to this paper.