




No CrossRef data available.
Article contents
Leishmania infantum possesses a complex family of histone H2A genes: structural characterization and analysis of expression
Published online by Cambridge University Press: 09 October 2003
Abstract
We have studied the genomic organization and transcription of the histone H2A genes in the protozoan parasite Leishmania infantum. In the parasite genome 2 gene clusters exist, each containing 3 H2A gene copies. Sequence analysesNucleotide sequence data reported in this paper are available in the GenBank™, EMBL and DDBJ databases under the accession numbers AJ419625, AJ419626 and AJ419627. showed the existence of significant sequence divergence among the H2A genes, mainly in their 5′- and 3′-untranslated regions (UTRs). Also, the existence of allelic alternatives has been evidenced. Based on the divergence in the 3′UTR regions, we have defined 3 classes of H2A transcripts, which are present at different levels in L. infantum promastigotes. However, transcription of the 3 classes of H2A genes occurs at similar levels, as measured by nuclear run-on assays, indicating that their abundance is regulated post-transcriptionally. Also, differences in regulation were observed among the H2A transcripts: the levels of transcripts with 3′-UTR type I and type III are affected by growth phase whereas transcripts with 3′-UTR type II, that are barely detected, remain constant. It is likely that the complexity, in both gene organization and differential expression exhibited by the L. infantum H2A genes, is imposed by the nature of the post-transcriptional mechanisms of regulation operating in this parasite.
Keywords
Information
- Type
- Research Article
- Information
- Copyright
- 2003 Cambridge University Press
INTRODUCTION
Histones are structural proteins that play an important role in DNA organization and gene regulation in eukaryotes. As a reflection of their fundamental and universal roles in chromatin architecture, histones are among the most conserved proteins (Thatcher & Gorovsky, 1994). Nucleosomes, the basic structural units of chromatin, are constituted by DNA wrapped around a protein core containing 2 molecules of each of the 4 core histones (i.e. H2A, H2B, H3 and H4). Two classes of core histone genes are found in most eukaryotes. The most frequent class contains the replication-dependent histone genes whose expression is cell cycle-regulated, whereas a second, less abundant class includes the genes that encode the histone variants, whose expression occurs at a basal level throughout the cell cycle (Osley, 1991). Multiple mechanisms of control are involved in restricting the synthesis of histones to S phase of the cell cycle. The main mechanisms act at the levels of transcription, pre-mRNA processing, and mRNA stability and their combined effect is the regulation of the histone mRNA abundance (Osley, 1991; Stein et al. 1994).
Phylogenetic analyses suggest that trypanosomes diverged early from the eukaryotic lineage (Sogin, Elwood & Gunderson, 1986) and several novel molecular and biochemical features of trypanosomatids also appear to reflect this divergence (Donelson, Gardner & El-Sayed, 1999). In trypanosomatids, almost all protein-coding genes are transcribed as polycistrons, and trans-splicing leads to the addition of a common 39-nucleotide spliced leader sequence to the 5′ end of every mRNA. Consequently, most of the genes appear to be transcribed constitutively, suggesting the need for a significant regulation of mRNA and/or protein abundance at the post-transcriptional level (Stiles et al. 1999). Histone genes in trypanosomatids constitute excellent models for the study of regulatory pathways of gene expression in these unusual eukaryotes. During the last decade the sequences of genes coding for core histones from the genera Trypanosoma and Leishmania have been deciphered (Genske et al. 1991; Soto et al. 1992, 1994, 1997; García-Salcedo et al. 1994; Puerta et al. 1994; Bontempi et al. 1994; Lukes & Maslov, 2000), showing that this family of protozoa possesses the most divergent histones described to date (reviewed by Galanti et al. 1998). Analyses of histone gene expression point to the existence of similarities and differences between the two genera. With the exception of the lack of transcription of histone genes in the non-replicative forms of T. cruzi, in which a transcriptional regulation has been described (Marañón et al. 1998), the regulation in both the replicative forms of T. cruzi and Leishmania promastigotes is exerted at post-transcriptional levels. Nevertheless, while in Trypanosoma the abundance of histone mRNAs is temporally coupled to DNA synthesis, suggesting a cell-cycle regulation (García-Salcedo et al. 1994; Ersfeld et al. 1996; Marañón et al. 1998, 2000; García-Salcedo, Gijón & Pays, 1999; Recinos, Kirchhoff & Donelson, 2001), the Leishmania histone mRNAs do not decrease in abundance after treatments with inhibitors of DNA synthesis (Genske et al. 1991; Soto et al. 1996, 1997, 2000). Interestingly, the expression of histone genes seems to be linked to DNA replication at the translational level in Leishmania (Soto et al. 2000).
We realized that studies on the number and organization of genes coding for the core histones in Leishmania were incomplete when we were planning an extended analysis of the sequences responsible for regulation of histone expression. It was known that each one of the Leishmania histones, H2A (Soto et al. 1992), H2B (Genske et al. 1991), H3 (Soto et al. 1996) and H4 (Soto et al. 1997), are coded by multiple genes. Furthermore, genes for H2A, H2B and H3 have been found to be distributed in more than one chromosome (Soto et al. 1995; Wincker et al. 1996). In this study, we have carried out a complete characterization of the number and organization of genes coding for histone H2A in L. infantum. We also have determined the sequence, transcription levels and mRNA abundance for the different classes of H2A genes.
MATERIALS AND METHODS
Culture conditions
Promastigotes of L. infantum (MCAN/ES/96/BCN150) were grown at 26 °C in RPMI 1640 medium (Gibco, Paisley, UK) supplemented with 10% (v/v) heat-inactivated foetal calf serum (Flow Laboratories, UK). Experimental cultures were initiated at 1×10⁶ promastigotes/ml and harvested for study in either the logarithmic phase of growth (5–8×10⁶ promastigotes/ml) or the stationary phase of growth (2×10⁷ promastigotes/ml).
Isolation and sequence of H2A genes
A genomic library, constructed in the vector EMBL-3 by using partial Sau3AI-digested L. infantum DNA (Soto et al. 1993), was screened with clone cL71 (Soto et al. 1992). Three positive phages were isolated and named H2Ag2, H2Ag6 and H2Ag7. The SalI-restriction fragments of 5·2 kb (from clone H2Ag2), 5·8 kb (from H2Ag6), and 9 kb (from H2Ag7) were cloned into the pBluescript plasmid, and the resulting clones were termed pSalI-5·2, pSalI-5·8 and pSalI-9, respectively.
Additional subcloning of the pSalI-9 clone was carried out by BamHI+SalI double digestions, resulting in the subclones pB5·4 (5·4 kb BamHI fragment), pSB2·3 (a 2·3 kb SalI–BamHI fragment), and pBS1·4 (an 1·4 kb BamHI–SalI fragment). Clone pB5·4 was completely sequenced using additional subclones and synthetic oligonucleotides. DNA sequences were determined using the ABI PRISM BigDye Terminator Cycle Sequencing Ready Reaction Kit (PE Applied Biosystems, Foster City, CA).
The 2·3 kb SalI–BamHI and 0·5 kb HindIII–SalI fragments from clone pSalI-5·8 were sequenced. Clone pSalI-5·2 was completely sequenced using subclones and synthetic oligonucleotides.
Probes used for detection of H2A RNAs
Clone LiH2A-Ct-Q (Soto et al. 1998), which codes for the carboxyl-terminal 67 amino acids of the L. infantum histone H2A, was used as an H2A coding probe (CDS). Probes specific for the 3 types of 3′UTRs were generated by PCR amplification. The 3′UTR-I was amplified from clone cL71 using the following primers: sense, 5′-CGGGATCCGT CCTCCGGCCT GACAGCGC-3′ (restriction sites included for cloning purposes are underlined), and antisense, 5′-CGGGATCCGT CCGAGCCTAC CTGACTC-3′. The amplification product was digested with BamHI and cloned into pBluescript. The 3′UTR-II was amplified using the following oligonucleotides: sense, 5′-CCATCGATAG ATACCCTTTG GAAGGTTC-3′, and antisense, 5′ GCGTCGACGC ACGCGCACAC ACAGAGGT-3′. The PCR product was digested with ClaI and SalI, and cloned into pBluescript. Finally, the 3′UTR-III was amplified using the following oligonucleotides as primers: sense, 5′-CCATCGATAG AGCACACCTA CCCCTCTC-3′, and antisense, 5′-GCGTCGACAA CATCACTGAG ACAACGAG-3′. The amplification product was digested with ClaI and SalI, and cloned into pBluescript.
Nucleic acid isolation and analyses
L. infantum DNA and RNA were isolated as described previously (Chomczynsk & Sacchi, 1987; Requena et al. 1988). Total DNA was digested with different restriction enzymes, electrophoresed on 0·8% agarose gels and transferred to nylon membranes (Hybond-N, Amersham Corp.) by standard methods (Sambrook, Fritsch & Maniatis, 1989). Total RNA was size-separated on 1% agarose–formaldehyde gels (Lerach et al. 1977) and electrophoresed on to nylon membranes using an LKB system (Pharmacia Biotech Inc.).
DNA probes were labelled by nick translation (Sambrook et al. 1989). Hybridizations, either for DNA or RNA, were performed in 50% formamide, 6×SSC, 0·1% SDS, and 0·25 mg/ml herring sperm DNA at 42 °C overnight. Final post-hybridization washes were performed in 0·1×SSC, 0·2% SDS at 50 °C for 1 h. For re-use, blots were treated with 0·1% SDS for 15 min at 95 °C to remove the previously hybridized probes.
Nuclease S1 protection assays
The following oligonucleotides, complementary to specific regions of H2A mRNAs were used: no. CDS, 5′-ACGGTGCGCG GGTTCAGGCG-3′ (specific for a coding sequence common to all H2A mRNAs); no. 3′UTR-I, 5′-ACGGTGCGCG GGTTCAGGCG-3′ (specific sequence of the 3′UTR-I); no. 3′UTR-II, 5′-CGACTCCCCG TGCGACTCTG-3′ (specific sequence of the 3′UTR-II); and no. 3′UTR-III, 5′-CAGCAACGCA CACACTCCCC-3′ (specific sequence of the 3′UTR-III). Oligonucleotides were labelled at the 5′ end using T4 polynucleotide kinase and gamma-[32P]ATP as described (Quijada et al. 1997 a). The oligonucleotides, in molar excess (0·07 pmol), were mixed with 2 μg of total RNA from logarithmic phase promastigotes and nuclease S1 protection experiments were performed as described elsewhere (Soto et al. 1993). Protection products were analysed on 15% polyacrylamide–7 M urea gels. Autoradiographs were scanned with a densitometer (Image Quant™ version 3.0; Molecular Dynamics), and the relative densities of the bands were determined.
Determination of steady-state levels of specific transcripts using probes generated by reverse transcription
Probes were generated by reverse transcription (RT) of 2 μg of poly-A(+) RNA. In the priming step, poly-A(+) RNA was mixed with 2 μg of oligo-dT primer (5′-CGGAATTCT18-3′) in a total volume of 10 μl. The mixture was placed at 70 °C for 10 min and then chilled on ice. For elongation, the following components were added: 6 μl of 5×First Strand Buffer (Life Technologies); 1 μl 0·1 M DTT; 1·5 μl of a mixture containing dATP, dGTP and dTTP at 20 mM each; 1·5 μl of Reverse Transcriptase (SuperScript™ II RNase H−, Life Technologies, Cat. no. 18064-022); 10 μl of α-32P-dCTP (10 mCi/ml, 3000 Ci/mmol; Amersham Pharmacia Biotech). The mixture was incubated for 90 min at 37 °C. The radio-isotope labelled cDNA was separated from the unincorporated dNTPs by chromatography on a Sephadex G-50 column (Sambrook et al. 1989).
Samples (5 μg) of the plasmids to be tested were linearized, denatured and applied onto Zeta-probe membranes (Bio-Rad) using a vacuum slot-blot apparatus. The membrane was then subjected to hybridization with the RT probe, following the hybridization conditions indicated above. Analysis of intensity of hybridization to individual slot blots was performed using a Phosphorimager (Molecular Dynamics).
Nuclear run-on assays
Nuclei were isolated from promastigotes in the logarithmic growth phase and used to run-on transcription assays following methodologies described elsewhere (Quijada et al. 1997 b).
Use of the PCR to map the 5′UTRs of H2A transcripts
Reverse transcription (RT) of total promastigote RNA was performed using the MuLV reverse transcriptase (Perkin Elmer) and the oligonucleotide 5′-CGGAATTCT18-3′ designed to prime from the poly(A) tail. The RT product was amplified by PCR using Taq DNA polymerase (Roche Diagnostics) and the following oligonucleotides: forward primer, 5′-GCTATATAAG TATCAGTTTC TGTAC-3′ (specific sequence of the Leishmania spliced leader), and reverse primer, 5′-GCTCCGCCGT CAGGTACTC-3′ (reverse and complementary to a coding sequence common to all H2A mRNAs). The amplification product was cloned into vector pSTBlue1 using the Perfectly blunt cloning kit (Novagen).
RESULTS
Genomic organization of the L. infantum genes coding for histone H2A
In order to characterize the organization of the L. infantum H2A genes, a genomic library was screened with the cL71 probe, a cDNA coding for the L. infantum H2A histone (Soto et al. 1992). Three phages were isolated and after characterization by restriction and hybridization analyses, it was deduced that they derived from 2 different genetic loci (Fig. 1). Restriction fragments, which hybridized with the cL71 probe, were subcloned and completely sequenced. The restriction and sequence analyses demonstrated that phages H2Ag6 and H2Ag7 derived from the same locus (named locus 1) while the phage H2Ag2 should be derived from a different locus (named locus 2). Each locus was found to be composed of 3 histone H2A genes (Fig. 1). Following the genetic nomenclature for Trypanosoma and Leishmania, proposed by Clayton et al. (1998), the 6 genes were named: H2A1, H2A2 and H2A3 for those located in locus 1; and H2A4, H2A5 and H2A6 for those located in locus 2 (Fig. 1). The existence of some sequence differences between phages H2Ag7 and H2Ag6 (see below) was interpreted as allelic divergence and the corresponding genes considered as allelic copies were named, consequently, H2A1-1 and H2A1-2 (Fig. 1).

Fig. 1. Schematic representation of the Leishmania infantum H2A loci. The locations of the H2A genes are depicted as closed boxes, in which 5′-UTRs (cross-hatched areas), coding regions (black areas) and 3′-UTRs (blank areas) are indicated. The names of the genes are indicated below the map. The locations of the different 5′-UTRs (I–IV) and 3′-UTRs (I–III) are indicated on the physical maps. The restriction fragments used as probes in subsequent Southern blot analyses are shown above lines with open arrow-heads. Regions in which nucleotide sequences have not been completely determined are denoted with dotted lines. The restriction sites for SalI (S), BamHI (B), SacII (A), HindIII (H) and SacI (C) are shown.
The genomic organization of the H2A genes in L. infantum was analysed by Southern blot. Genomic DNA was digested with several restriction enzymes and hybridized with several probes (Fig. 2). Two SalI bands (9·0 and 5·2 kb), 5 HindIII bands (19·8, 15·9, 8·7, 4·2, and 1·0 kb) and 2 EcoRI bands (19·9 and 12·7 kb) were detected by a probe containing exclusively protein-coding sequence (Fig. 2; panel CDS). Interestingly, the 2 SalI restriction fragments (9·0 and 5·2 kb) were those contained in the genomic clones H2Ag7 and H2Ag2, respectively. This fact was taken as an indication that only 2 H2A loci exist in the genome of L. infantum. This was finally confirmed by the hybridization patterns obtained with other specific-probes. Thus, 2 probes derived from phage H2Ag7, named SB2.3 and 3′UTR-II (Fig. 2), showed that the 8·7 kb and 4·2 kb HindIII genomic fragments belong to the H2A locus 1. Since the 1·0 kb HindIII band was mapped in the insert of phage H2Ag7 (Fig. 1), the histone H2A locus 1 explained 3 out of the 5 HindIII genomic bands hybridizing with the protein-coding probe (Fig. 2). Both probes hybridized with the same 19·9 kb EcoRI and 9·0 kb SalI bands (Fig. 2; panels SB2.3 and 3′UTR-II). In a similar way, the SE1 and 3′UTR-III probes, derived from phage H2Ag2 (Fig. 1), were used to define the genomic bands corresponding to the histone H2A locus 2 (Fig. 2). As expected, both probes hybridized with the same 5·2 kb SalI genomic fragment. Also, in agreement with the existence of EcoRI and HindIII restriction sites separating both probes in phage H2Ag2, it was observed that each one of the probes hybridized with different EcoRI and HindIII bands. Thus, the SE1 probe hybridized with a 19·8 kb HindIII band and a 23·0 kb EcoRI band, and the 3′UTR-III probe hybridized with a 15·9 kb HindIII band and a 12·7 kb EcoRI band. In conclusion, the Southern blots shown in Fig. 2 confirmed that there are 2 histone H2A loci in the L. infantum genome. This finding is in agreement with the existence of 2 H2A gene-bearing chromosomes in Leishmania spp., i.e. Chr21 and Chr29 (Wincker et al. 1996).

Fig. 2. Southern blot analysis of Leishmania infantum genomic DNA hybridized with H2A-specific probes. Two μg of total DNA were digested with the restriction enzymes HindIII (lanes H), SalI (lanes S) and EcoRI (lanes E). As indicated below the blots, the following specific probes are used: CDS (H2A coding region), SB2.3, 3′UTR-II, SE1, and 3′UTR-III. The locations of the probes are shown in Fig. 1. Numbers at the left indicate the size (in kb) and mobility of the restriction fragments for HindIII-digested λ DNA.
Sequence analysis of the two histone H2A loci
Three open reading frames coding for histone H2A were found after sequencing the 5444 bp BamHI DNA fragment that contained locus 1 (Fig. 1). A search for sequence homologies in the EMBL–EBI Leishmania Database showed a significant sequence identity with the following entries: AL161173, AQ850483, AQ846646, AL499623, AL446005 and AL596287. Interestingly, the sequences AL161173, AL446005 and AL596287 derive from cosmids mapping to the L. major Friedlin chromosome 21 (Ivens et al. 1998). In addition, the 5247 bp SalI DNA fragment containing locus 2 (Fig. 1) was sequenced as well, showing another 3 H2A genes. Interestingly, this sequence was found to be highly homologous to the GenBank entry AC129009, a contig assigned to the L. major chromosome 29. Therefore, these data strongly suggest that the H2A locus 1 and locus 2 are located in the Leishmania chromosomes 21 and 29, respectively.
A sequence comparison between the 5444 bp BamHI DNA fragment, which contains locus 1, and the 5247 bp SalI DNA fragment, which contains locus 2, indicated that sequence homology is restricted to the histone H2A coding regions. The upstream and downstream sequences to the H2A gene clusters were found to be divergent between the two loci. Although the endonuclease-restriction pattern shown by the genomic clone H2Ag6 (Fig. 1) was coincident with that of the genomic region containing the histone H2A locus 1, after sequencing a 2434 bp DNA fragment from clone H2Ag6, it was found that the sequence identity with clone H2Ag7 was high (98·85%) but not complete. Since several lines of evidence suggest that Leishmania is mostly diploid (Ravel et al. 1998), we deduced from this finding that each genomic clone contains an allelic alternative.
The coding regions of the H2A genes were found to be extremely conserved (above 96·7%). However, 2 identical coding regions do not exist among the 7 deduced amino acid sequences (Fig. 3). It can be noticed that most of the amino acid changes occur in the carboxyl-terminal region of the protein.

Fig. 3. Alignment of the amino acid sequences deduced from the different Leishmania infantum H2A genes. Amino acid positions that are non-identical in all proteins are indicated by asterisks.
Major sequence differences among the L. infantum H2A genes were found in the UTRs. In order to define the 5′ ends of the H2A mRNAs, cDNA was synthesized using an oligo(dT) primer and amplified using a forward primer derived from the mini-exon sequence and a reverse primer complementary to a coding sequence common to all H2A genes (see ‘Materials and Methods’ section). Thus, after sequencing 12 clones, the splice acceptor sites could be experimentally defined for genes H2A1-2, H2A2-2 and H2A4; the remaining were deduced from sequence comparison and theoretical considerations. From a multiple sequence alignment (Fig. 4), the existence of 4 types of 5′UTRs became evident. A 5′UTR type I (or 5′UTR-I) is present in both alleles of gene H2A1, a 5′UTR-II is shared by genes H2A2 (both alleles), H2A3 and H2A5, a 5′-UTR-III is found in the gene H2A4, and a 5′-UTR-IV is found in the gene H2A6 (Fig. 1). The 5′UTRs types I and II are similar in sequence, but they are of a different size. Also, the 5′UTRs types III and IV are related, since they present a remarkable sequence conservation in a 33-nucleotide fragment located upstream from the ATG initiation codon (Fig. 4). A common feature for all 5′UTRs is the presence of polypyrimidine tracts.

Fig. 4. Comparison of the 5′-UTR sequences of the different H2A genes. Alignment for maximal identity was done using the CLUSTALW program, available at the European Bioinformatics Institute server (http://www.ebi.ac.uk/). The AG dinucleotide acceptor sites for spliced leader addition and the ATG initiation codons are underlined. Hyphens represent introduced gaps for the optimum alignment. Nucleotide residue numbering is shown at the end of each line. Conserved sequences in all the 5′-UTRs are indicated by asterisks.
In previous work, we isolated and sequenced 2 cDNAs clones (named cL71 and cL72) coding for L. infantum histone H2A (Soto et al. 1992). We noticed at that time that both sequences diverged in their 5′UTRs but were highly conserved in their coding and 3′UTRs sequences. Now, sequence comparison with the genomic clones allowed us to deduce that those cDNAs correspond to the mRNAs of genes H2A1-1 (cDNA cL72) and H2A4 (cDNA cL71). As previously reported, the 3′UTRs of the 2 cDNAs differ only in a single nucleotide, a difference also observed in the corresponding genomic sequences. For simplicity, we grouped these 3′UTR as type I (or 3′UTR-I). Aside from genes H2A1-1 and H2A4, the 3′UTR-I was found to be present in the genes H2A1-2 and H2A2-1 (Fig. 1). At present, we have not defined the 3′ end of the 3′UTR for the remaining genes. Nevertheless, it was found that the sequences downstream from the termination codon in genes H2A3, H2A5 and H2A6 are absolutely divergent compared to the 3′UTR-I sequence. Immediately downstream from the termination codon, genes H2A5 and H2A6 share 99·1% of sequence identity in a 228 bp fragment, suggesting that this is the size of the 3′UTR for these genes. Thus, in summary, it can be concluded that, in addition to the 3′UTR-I found in genes H2A1 (both alleles), H2A2 and H2A4, two other types of 3′UTRs exist: a 3′UTR-II in the gene H2A3 and a 3′-UTR-III in the genes H2A5 and H2A6 (Fig. 1).
Relative steady-state levels of the different L. infantum H2A mRNAs
As summarized in Fig. 1, the 6 H2A genes present in the L. infantum genome are heterogeneous in sequence, mainly within their 5′- and 3′-UTRs. In order to analyse whether the sequence divergences were associated with differences in the steady-state levels of H2A mRNAs, Northern blots containing L. infantum promastigote RNA were probed with the 3 different 3′-UTRs. Transcripts were detected with each of the probes; however, it was not possible to establish with this technique the relative abundance since the transcripts showed the same size. In order to quantify the relative levels of the different transcripts, we designed a nuclease S1 protection assay using specific oligonucleotides for each of the 3′-UTRs. Figure 5 A shows the result of a representative experiment in which poly-A+ RNA extracted from parasites growing at logarithmic phase was used. Densitometric analyses of the autoradiographs from 3 independent experiments showed that transcripts with 3′UTR-I are 7- and 130-fold more abundant than those containing the 3′UTR-III and the 3′-UTR-II, respectively. As an alternative method to evaluate the relative levels of expression of the 3 types of H2A transcripts, poly-A+ RNA was used as a template to prepare an α-32P-labelled total cDNA probe that was then hybridized to a membrane containing the different 3′UTRs (Fig. 5B). After quantification of the hybridization signals, it was calculated that the 3′UTR-I containing transcripts are 7- and 200-fold more abundant than those containing the 3′UTR-III and the 3′UTR-II, respectively. In summary, these 2 independent approaches indicated that transcripts with 3′UTR-I account for the majority of the H2A transcripts in logarithmic-phase growing parasites, and that the steady-state level of the 3′UTR-II-containing transcripts is extremely low.

Fig. 5. Analysis of the expression levels of Leishmania infantum H2A RNAs. (A) The steady-state levels of the different H2A transcripts were determined by S1 protection analysis using 5′-labelled oligonucleotides, reverse and complementary to specific regions of the 3′UTR-I (no. 3′UTR-I), the 3′UTR-II (no. 3′ UTR-II), or the 3′UTR-III (no. 3′UTR-III). Oligonucleotides were hybridized in molar excess (0·07 pmol) with 2 μg of poly(A)+ RNA from logarithmic promastigotes. After 3 h of hybridization, samples were incubated with 40 units of S1 nuclease for 15 min. The S1 products were analysed on 15% polyacrylamide–7 M urea gels. Three independent experiments were made and the autoradiographs were quantified by densitometric scanning (panel on the right). Densitometric measures were normalized to the protection signal values for the 3′UTR-I oligonucleotide (taken arbitrarily as 100). (B) L. infantum poly(A)+ RNA was used as template to synthesize α-32P-labelled cDNA probe, which was hybridized to linearized plasmid DNA (5 μg/slot) immobilized on a membrane. Plasmids were pBluescript (pBls) containing the 3 types of H2A 3′UTRs: 3′UTR-I, 3′UTR-III and 3′UTR-II. Hybridization signals were quantitated using a Phosphorimager. After subtracting the unspecific hybridization value (pBls slot), the data were normalized to the hybridization value for the 3′UTR-I plasmid (set arbitrarily as 100). (C) Analysis of the H2A gene transcription by nuclear run-on assays. Run-on transcription was performed with nuclei from L. infantum logarithmic promastigotes. The run-on transcripts were hybridized to linearized plasmid DNA (5 μg/slot) immobilized on a nylon filter. Plasmids contain inserts for different regions of the H2A genes: the coding region (CDS), the 3′UTR-I, the 3′UTR-III and the 3′UTR-II. Also plasmids containing a Trypanosoma cruzi α-tubulin cDNA (Soares et al. 1989) (α-tub.) or a fragment of the L. infantum 24Sα rDNA gene (Quijada et al. 1997 b) (rRNA) were used. The slot marked as pBls contains the Bluescript plasmid. The panel on the right shows the quantification of relative transcription rates for the different genes after densitometric analysis of the autoradiographs from 3 independent experiments. Data were normalized to the transcription rate of the rRNA genes (taken as 100).
To determine whether the abundance of the different H2A transcripts is regulated at the transcriptional or post-transcriptional levels, we quantified the relative rates of transcription for the different H2A genes by nuclear run-on transcription analysis (Fig. 5C). The rate of transcription of each gene (or group of genes) was normalized to the rate of rRNA transcription. The results of 3 independent experiments showed that transcription of the different H2A genes occurred at approximately the same rate. Therefore, the differences in the steady-state levels for the different H2A transcripts must be due to post-transcriptional processes.
The expression of H2A genes is regulated by growth phase in L. infantum promastigotes
In a previous report, we described that the levels of histone H2A mRNAs are affected by growth rate in Leishmania promastigotes (Soto et al. 1992). Indeed, as shown in Fig. 6 (panel CDS), the total amount of H2A mRNAs is significantly lower in stationary phase promastigotes than in logarithmic phase promastigotes. When Northern blots were probed with the different 3′-UTRs, it was observed that the steady-state levels of transcripts with either 3′UTR-I or 3′UTR-III were lower at the stationary phase of growth than at the logarithmic phase (Fig. 6). It was interesting to note that both types of H2A transcripts were down-regulated by a mechanism regulated by growth phase, despite the fact that they contain highly divergent UTR sequences. In contrast, the levels of the 3′UTR-II transcripts were found to be similar in both logarithmic or stationary promastigotes (Fig. 6, panel 3′UTR-II), as occurs with the α-tubulin transcripts (Fig. 6, panel α-tub). However, given the relative low level of this H2A transcript (Fig. 5), the physiological relevance of this finding remains unanswered.

Fig. 6. Expression of the different H2A mRNAs in logarithmic and stationary phases of growth. Northern blots containing 5 μg of total RNA from Leishmania infantum promastigotes during logarithmic (L) or stationary (S) phase of growth were hybridized to specific probes for the H2A coding region (panel CDS), the 3′UTR-I (panel 3′UTR-I), the 3′UTR-III (panel 3′UTR-III), the 3′UTR-II (panel 3′UTR-II), or the Trypanosoma cruzi α-tubulin (panel α-tub.). The ethidium bromide staining of the agarose gel is shown (panel rRNA). The sizes of hybridization bands (in kb) are indicated.
Since there are numerous examples of Leishmania multicopy genes in which their differential expression is determined post-transcriptionally by sequences located in the 3′UTRs (Ramamoorthy et al. 1995; Charest, Zhang & Matlashewski, 1996; Coulson et al. 1996; Quijada et al. 2000; Boucher et al. 2002), we analysed whether the 3′UTRs could mediate the differential accumulation of the 3 types of H2A transcripts (Fig. 5). A series of constructs were prepared in which the different H2A 3′UTRs were cloned downstream of the CAT gene in plasmid pX63NEO. The constructs were electroporated into L. infantum promastigotes and stable transfectants were obtained. However, the levels of the CAT RNAs were found to be similar in the transfectants (data not shown), indicating that sequences other than the 3′UTRs (either alone or acting in conjunction with the 3′UTRs) must be responsible for the differential expression levels shown by the different H2A genes (Fig. 5).
DISCUSSION
In this work we describe the organization and the steady-state expression levels of the H2A genes in L. infantum. The genome of this parasite contains 6 H2A genes distributed in 2 gene loci (each with 3 clustered genes), located on different chromosomes. Sequence analysis has indicated that 2 identical H2A genes do not exist. Major sequence differences are located in both 5′- and 3′-UTRs, although changes also occur in the deduced amino acid sequences (see below). The gene complexity could be even higher if allelic divergence is taken into account, since we have obtained evidence that gene alleles located in homologous chromosomes also accumulate sequence differences. Allelic differences in the 5′UTRs are significant, since they affect either the AG acceptor site (H2A1 alleles) or the length of the 5′UTRs (H2A2 alleles). This is not an unusual finding, several examples of allelic differences have been described in Leishmania and other trypanosomatids (Revelard, Lips & Pays, 1993; Bhatia et al. 1998; Göpfert et al. 1999; Landfear, 2001; Machado & Ayala, 2001). Interestingly, it has been shown in some studies that one of the alternative alleles is expressed at higher levels than the other allele, which is located on the homologous chromosome (Revelard et al. 1993; Bhatia et al. 1998). At present, experiments are being designed to analyse whether expression differences exist between the allelic alternatives of L. infantum H2A genes.
In this work, we have analysed differences in expression levels of H2A genes based on the sequence divergence of the 3′UTRs. Nuclear run-on experiments have indicated that all H2A genes are transcribed at similar rates, although the different H2A mRNAs accumulate at very different steady-state levels. Thus, transcripts with 3′UTR-I are the most abundant in logarithmic phase promastigotes, transcripts with 3′UTR-III have an intermediate level and transcripts with 3′UTR-II are expressed at a very low level. Also, it has been found that steady-state levels of transcripts with either 3′UTR-I or 3′UTR-III decrease when promastigotes reach the stationary phase of growth, whereas the low levels of transcripts with 3′UTR-II are similar in both growth phases. Based on studies from other Leishmania genes, in which it has been demonstrated that sequences located in the 3′UTRs are directly involved in post-transcriptional regulatory mechanisms (Ramamoorthy et al. 1995; Charest et al. 1996; Coulson et al. 1996; Quijada et al. 2000; Boucher et al. 2002), we analysed the effect of the 3 distinct H2A 3′UTRs on the transcript levels of a CAT reporter gene (data not shown). The results indicated that the different steady-state levels of the H2A-3′UTR-I, H2A-3′UTR-II and 3′UTR-III transcripts in Leishmania promastigotes are not determined by the 3′UTR alone. It is worth mentioning that the work of García-Salcedo et al. (1999) that showed that the decrease of H2B mRNAs in T. brucei induced by hydroxyurea is not a direct effect of the 3′UTR.
Although major differences among the Leishmania H2A genes are located in the UTRs, it should be noted that the 7 deduced amino acid sequences from the H2A genes differ from each other in a few residues. Thus, it would be interesting to analyse whether these minor differences could have a functional role, taking into account that they are mainly located in the carboxyl-terminal region. The C-terminal domain of histone H2A is a flexible region of the protein postulated to be involved in the nucleosome disassembly and reassembly during the transcription process (Usachenko et al. 1994).
An interesting question arising from this work concerns the significance of such a gene organization. Two possibilities exist to explain why Leishmania possesses 6 markedly different H2A genes: (a) they are the result of stochastic gene duplications and genetic drift without functional meaning; (b) they are the result of an evolutionary pressure on these loci to ensure a variety of cis-acting sequences involved in the post-transcriptional regulation of the H2A transcripts in different development stages and in different metabolic conditions. Although studies are needed to ascertain the functional role of the different UTRs (both 5′ and 3′) in the regulation of H2A mRNAs, the fact that multi-copy genes with different UTRs are common in the Leishmania genome (reviewed by Stiles et al. 1999) favours the existence of a regulatory role for these sequences. Thus, this complex gene structure and organization could be envisaged as a strategy to regulate gene expression, designed by a parasite lacking transcriptional regulation mechanisms. Well-characterized examples, in which genes with different UTRs are expressed differentially, are the glucose transporter genes of L. mexicana (Burchmore & Landfear, 1998), the surface protease Gp63 genes in L. chagasi (Ramamoorthy et al. 1992), and the β-tubulin genes in L. major (Coulson et al. 1996).
In summary, the structural characterization of the L. infantum H2A genes and the analysis of their transcripts described here, constitute a reliable starting point to undertake the study of the regulatory mechanisms involved in the histone expression of trypanosomatids. The fact that the 3′UTRs per se did not show any effect on the transcripts derived from CAT-H2A 3′UTR chimeric genes points to the existence of a high complexity in the mechanisms regulating the translation of Leishmania H2A transcripts.
This work was supported by grants from Promoción General del Conocimiento (PB98-0098) and Comisión Interministerial de Ciencia y Tecnología (98-0064). In addition, both an institutional grant and direct support to the project from Fundación Ramón Areces are acknowledged.
References
REFERENCES
BHATIA, A.,
SANYAL, R.,
PARAMCHUK, W. &
GEDAMU, L.
(1998).
Isolation, characterization and disruption of the casein kinase II alpha subunit gene of Leishmania chagasi.
Molecular and Biochemical Parasitology 92, 195–206.CrossRefGoogle Scholar
BONTEMPI, E. J.,
PORCEL, B. M.,
HENRIKSSON, J.,
CARLSSON, L.,
RYDAKER, M.,
SEGURA, E. L.,
RUIZ, A. M. &
PETERSSON, U.
(1994).
Genes for histone H3 in Trypanosoma cruzi.
Molecular and Biochemical Parasitology 66, 147–151.CrossRefGoogle Scholar
BOUCHER, N.,
WU, Y.,
DUMAS, C.,
DUBE, M.,
SERENO, D.,
BRETON, M. &
PAPADOPOULOU, B.
(2002).
A common mechanism of stage-regulated gene expression in Leishmania mediated by a conserved 3′-untranslated region element.
Journal of Biological Chemistry 277,
19511–19520.CrossRefGoogle Scholar
BURCHMORE, R. J. S. &
LANDFEAR, S. M.
(1998).
Differential regulation of multiple glucose transporter genes in Leishmania mexicana.
Journal of Biological Chemistry 273,
29118–29126.CrossRefGoogle Scholar
CHAREST, H.,
ZHANG, W. W. &
MATLASHEWSKI, G.
(1996).
The developmental expression of Leishmania donovani A2 amastigote-specific genes is post-transcriptionally mediated and involves elements located in the 3′-untranslated region.
Journal of Biological Chemistry 271,
17081–17090.CrossRefGoogle Scholar
CHOMCZYNSK, P. &
SACCHI, M.
(1987).
Single-step method of RNA extraction by acid guanidinium thiocyanathe-phenol-chloroform extraction.
Analytical Biochemistry 162,
156–159.Google Scholar
CLAYTON, C.,
ADAMS, M.,
ALMEIDA, R.,
BALTZ, T.,
BARRET, M.,
BASTIEN, P.,
BELLI, S.,
BEVERLEY, S.,
BITEAU, N.,
BLACKWELL, J.,
BLAINEAU, C.,
BOSHART, M.,
BRINGAUD, F.,
CROSS, G.,
CRUZ, A.,
DEGRAVE, W.,
DONELSON, J.,
EL-SAYED, N.,
FU, G.,
ERSFELD, K.,
GIBSON, W.,
GULL, K.,
IVENS, A.,
KELLY, J.,
LAWSON, D.,
LEBOWITZ, J.,
MAJIWA, P.,
MATTHEWS, K.,
MELVILLE, S.,
MERLIN, G.,
MICHELS, P.,
MYLER, P.,
NORRISH, A.,
OPPERDOES, F.,
PAPADOPOULOU, B.,
PARSONS, M.,
SEEBECK, T.,
SMITH, D.,
STUART, K.,
TURNER, M.,
ULLU, E. &
VANHAMME, L.
(1998).
Genetic nomenclature for Trypanosoma and Leishmania.
Molecular and Biochemical Parasitology 97,
221–224.CrossRefGoogle Scholar
COULSON, R. M.,
CONNOR, V.,
CHEN, J. C. &
AJIOKA, J. W.
(1996).
Differential expression of Leishmania major beta-tubulin genes during the acquisition of promastigote infectivity.
Molecular and Biochemical Parasitology 82,
227–236.CrossRefGoogle Scholar
DONELSON, J. E.,
GARDNER, M. J. &
EL-SAYED, N. M.
(1999).
More surprises from Kinetoplastida.
Proceedings of the National Academy of Sciences, USA 96,
2579–2581.CrossRefGoogle Scholar
ERSFELD, K.,
DOCHERTY, R.,
ALSFORD, S. &
GULL, K.
(1996).
A fluorescence in situ hybridisation study of the regulation of histone mRNA level during the cell cycle of Trypanosoma brucei.
Molecular and Biochemical Parasitology 81,
201–209.CrossRefGoogle Scholar
GALANTI, N.,
GALINDO, M.,
SABAJ, V.,
ESPINOZA, I. &
TORO, G. C.
(1998).
Histone genes in Trypanosomatids.
Parasitology Today 14,
64–70.CrossRefGoogle Scholar
GARCÍA-SALCEDO, J. A.,
GIJÓN, P. &
PAYS, E.
(1999).
Regulated transcription of the histone H2B of Trypanosoma brucei.
European Journal of Biochemistry 264,
717–723.CrossRefGoogle Scholar
GARCÍA-SALCEDO, J. A.,
OLIVER, J.,
STOCK, R. P. &
GONZALEZ, A.
(1994).
Molecular characterization and transcription of the histone H2B gene from the protozoan parasite Trypanosoma cruzi.
Molecular Microbiology 13, 1033–1043.CrossRefGoogle Scholar
GENSKE, J. E.,
CAIRNS, B. R.,
STACK, S. P. &
LANDFEAR, S. M.
(1991).
Structure and regulation of histone H2B mRNAs from Leishmania enriettii.
Molecular and Cellular Biology 11, 240–249.CrossRefGoogle Scholar
GÖPFERT, U.,
GOEHRING, N.,
KLEIN, C. &
ILG, T.
(1999).
Proteophosphoglycans of Leishmania mexicana: molecular cloning and characterization of the Leishmania mexicana ppg2 gene encoding the proteophosphoglycans aPPG that are secreted by amastigotes and promastigotes.
The Biochemical Journal 344,
787–795.CrossRefGoogle Scholar
IVENS, A. C.,
LEWIS, S. M.,
BAGHERZADEH, A.,
ZHANG, L.,
CHAN, H. M. &
SMITH, D. F.
(1998).
A physical map of the Leishmania major Friedlin genome.
Genome Research 8,
135–145.CrossRefGoogle Scholar
LANDFEAR, S. M.
(2001).
Molecular genetics of nucleoside transporters in Leishmania and African trypanosomes.
Biochemical Pharmacology 62,
149–155.CrossRefGoogle Scholar
LERACH, H.,
DIAMOND, D.,
WOZNEY, J. M. &
BOEDTKER, H.
(1977).
RNA molecular weight determinations by gel electrophoresis under denaturing conditions, a critical reexamination.
Biochemistry 16,
4743–4751.CrossRefGoogle Scholar
LUKES, J. &
MASLOV, D. A.
(2000).
Unexpectedly high variability of the histone H4 gene in Leishmania.
Parasitology Research 86,
259–261.Google Scholar
MACHADO, C. A. &
AYALA, F. J.
(2001).
Nucleotide sequences provide evidence of genetic exchange among distantly related lineages of Trypanosoma cruzi.
Proceedings of the National Academy of Sciences, USA 98, 7396–7401.CrossRefGoogle Scholar
MARAÑÓN, C.,
PUERTA, C.,
ALONSO, C. &
LÓPEZ, M. C.
(1998).
Control mechanisms of the H2A genes expression in Trypanosoma cruzi.
Molecular and Biochemical Parasitology 92,
313–324.CrossRefGoogle Scholar
MARAÑÓN, C.,
THOMAS, M. C.,
PUERTA, C.,
ALONSO, C. &
LÓPEZ, M. C.
(2000).
The stability and maturation of the H2A histone mRNAs from Trypanosoma cruzi are implicated in their post-transcriptional regulation.
Biochimica et Biophysica Acta 1490,
1–10.CrossRefGoogle Scholar
OSLEY, M. A.
(1991).
The regulation of histones synthesis in the cell cycle.
Annual Review of Biochemistry 60,
827–861.CrossRefGoogle Scholar
PUERTA, C.,
MARTÍN, J.,
ALONSO, C. &
LÓPEZ, M. C.
(1994).
Isolation and characterization of the gene encoding histone H2A from Trypanosoma cruzi.
Molecular and Biochemical Parasitology 64,
1–10.CrossRefGoogle Scholar
QUIJADA, L.,
MOREIRA, D.,
SOTO, M.,
ALONSO, C. &
REQUENA, J. M.
(1997 a).
Efficient 5′-End labelling of oligonucleotides containing self-complementary sequences.
Biotechniques 23,
658–660.Google Scholar
QUIJADA, L.,
SOTO, M.,
ALONSO, C. &
REQUENA, J. M.
(1997 b).
Analysis of post-transcriptional regulation operating on transcription products of the tandemly linked Leishmania infantum hsp70 genes.
Journal of Biological Chemistry 272,
4493–4499.Google Scholar
QUIJADA, L.,
SOTO, M.,
ALONSO, C. &
REQUENA, J. M.
(2000).
Identification of a putative regulatory element in the 3′-untranslated region that controls expression of HSP70 in Leishmania infantum.
Molecular and Biochemical Parasitology 110,
79–91.CrossRefGoogle Scholar
RAMAMOORTHY, R.,
DONELSON, J. E.,
PAETZ, K. E.,
MAYBODI, M.,
ROBERTS, S. C. &
WILSON, M. E.
(1992).
Three distinct RNAs for the surface protease gp63 are differentially expressed during development of Leishmania donovani chagasi promastigotes to an infectious form.
Journal of Biological Chemistry 267,
1888–1895.Google Scholar
RAMAMOORTHY, R.,
SWIHART, K. G.,
McCOY, J. J.,
WILSON, M. E. &
DONELSON, J. E.
(1995).
Intergenic regions between tandem gp63 genes influence the differential expression of gp63 RNAs in Leishmania chagasi promastigotes.
Journal of Biological Chemistry 270,
12133–12139.CrossRefGoogle Scholar
RAVEL, C.,
DUBESSAY, P.,
BLACKWELL, J. M.,
IVENS, A. C.,
BASTIEN, P. &
THE LEISHMANIA GENOME NETWORK
(1998).
The complete chromosomal organization of the reference strain of the Leishmania genome project, L. major ‘Friedlin’.
Parasitology Today 14,
301–303.CrossRefGoogle Scholar
RECINOS, R. F.,
KIRCHHOFF, L. V. &
DONELSON, J. E.
(2001).
Cell cycle expression of histone genes in Trypanosoma cruzi
.
Molecular and Biochemical Parasitology 113,
215–222.CrossRefGoogle Scholar
REQUENA, J. M.,
LÓPEZ, M. C.,
JIMENEZ-RUIZ, A.,
DE LA TORRE, J. C. &
ALONSO, C.
(1988).
A head to tail organization of hsp70 genes in Trypanosoma cruzi
.
Nucleic Acids Research 16,
387–395.Google Scholar
REVELARD, P.,
LIPS, S. &
PAYS, E.
(1993).
Alternative splicing within and between alleles of the ATPase gene 1 locus of Trypanosoma brucei.
Molecular and Biochemical Parasitology 62,
93–102.CrossRefGoogle Scholar
SAMBROOK, L.,
FRITSCH, E. F. &
MANIATIS, T.
(1989).
Molecular Cloning: a Laboratory Manual,
2nd Edn.
Cold Spring Harbor Laboratory, Cold Spring Harbor NY.
SOARES, C. M. A.,
DE CARVALHO, E. F.,
URMENYI, T. P.,
CARVALHO, J. F. O.,
DE CASTRO, F. T. &
RONDINELLI, E.
(1989).
α- and β-tubulin mRNAs of Trypanosoma cruzi originated from a single multicistronic transcript.
FEBS Letters 250,
497–502.CrossRefGoogle Scholar
SOGIN, M. L.,
ELWOOD, H. J. &
GUNDERSON, J. H.
(1986).
Evolutionary diversity of eukaryotic small-subunit rRNA genes.
Proceedings of the National Academy of Sciences, USA 83,
1383–1387.CrossRefGoogle Scholar
SOTO, M.,
QUIJADA, L.,
ALONSO, C. &
REQUENA, J. M.
(2000).
Histone synthesis in Leishmania infantum is tightly linked to DNA replication by a translational control.
The Biochemical Journal 346,
99–105.CrossRefGoogle Scholar
SOTO, M.,
REQUENA, J. M.,
GARCÍA, M.,
GÓMEZ, L. C.,
NAVARRETE, I. &
ALONSO, C.
(1993).
Genomic organization and expression of two independent gene arrays coding for two antigenic acidic ribosomal proteins of Leishmania.
Journal of Biological Chemistry 268,
21835–21843.Google Scholar
SOTO, M.,
REQUENA, J. M.,
GÓMEZ, L. C.,
NAVARRETE, I. &
ALONSO, C.
(1992).
Molecular characterization of a Leishmania donovani infantum antigen identified as histone H2A.
European Journal of Biochemistry 205,
211–216.CrossRefGoogle Scholar
SOTO, M.,
REQUENA, J. M.,
MORALES, G. &
ALONSO, C.
(1994).
The Leishmania infantum histone H3 posseses an extremely divergent N-terminal domain.
Biochimica et Biophysica Acta 1219,
533–535.CrossRefGoogle Scholar
SOTO, M.,
REQUENA, J. M.,
MOREIRA, D. &
ALONSO, C.
(1995).
Assignment of genes to Leishmania infantum chromosomes: karyotipe and ploidy.
FEMS Microbiology Letters 129,
27–32.Google Scholar
SOTO, M.,
REQUENA, J. M.,
QUIJADA, L. &
ALONSO, C.
(1996).
Organization, transcription and regulation of the Leishmania infantum histone H3 genes.
Biochemical Journal 318,
813–819.CrossRefGoogle Scholar
SOTO, M.,
REQUENA, J. M.,
QUIJADA, L. &
ALONSO, C.
(1997).
Molecular cloning and analysis of expression of the Leishmania infantum histone H4 genes.
Molecular and Biochemical Parasitology 90,
439–447.CrossRefGoogle Scholar
SOTO, M.,
REQUENA, J. M.,
QUIJADA, L. &
ALONSO, C.
(1998).
Multicomponent chimeric antigen for serodiagnosis of canine visceral leishmaniasis.
Journal of Clinical Microbiology 36,
58–63.Google Scholar
STEIN, G. S.,
STEIN, J. L.,
VAN WIJNEN, A. J. &
LIAN, J. B.
(1994).
Histone gene transcription: a model for responsiveness to an integrated series of regulatory signals mediating cell cycle control and proliferation/differentiation interrelationships.
Journal of Cellular Biochemistry 54,
393–404.CrossRefGoogle Scholar
STILES, J. K.,
HICOCK, P. I.,
SHAH, P. H. &
MEADE, J. C.
(1999).
Genomic organization, transcription, splicing and gene regulation in Leishmania.
Annals of Tropical Medicine and Parasitology 93,
781–807.CrossRefGoogle Scholar
THATCHER, T. H. &
GOROVSKY, M. A.
(1994).
Phylogenetic analysis of the core histones H2A, H2B, H3 and H4.
Nucleic Acids Research 22,
174–179.CrossRefGoogle Scholar
USACHENKO, S. I.,
BAVYKIN, S. G.,
GAVIN, I. M. &
BRADBURY, E. M.
(1994).
Rearrangement of the histone H2A C-terminal domain in the nucleosome.
Proceedings of the National Academy of Sciences, USA 91,
6845–6849.CrossRefGoogle Scholar
WINCKER, P.,
RAVEL, C.,
BLAINEAU, C.,
PAGES, M.,
JAUFFRET, Y.,
DEDET, J.-P. &
BASTIEN, P.
(1996).
The Leishmania genome comprises 36 chromosomes conserved across widely divergent human pathogenic species.
Nucleic Acids Research 24,
1688–1694.CrossRefGoogle Scholar

Fig. 1. Schematic representation of the Leishmania infantum H2A loci. The locations of the H2A genes are depicted as closed boxes, in which 5′-UTRs (cross-hatched areas), coding regions (black areas) and 3′-UTRs (blank areas) are indicated. The names of the genes are indicated below the map. The locations of the different 5′-UTRs (I–IV) and 3′-UTRs (I–III) are indicated on the physical maps. The restriction fragments used as probes in subsequent Southern blot analyses are shown above lines with open arrow-heads. Regions in which nucleotide sequences have not been completely determined are denoted with dotted lines. The restriction sites for SalI (S), BamHI (B), SacII (A), HindIII (H) and SacI (C) are shown.
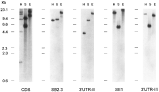
Fig. 2. Southern blot analysis of Leishmania infantum genomic DNA hybridized with H2A-specific probes. Two μg of total DNA were digested with the restriction enzymes HindIII (lanes H), SalI (lanes S) and EcoRI (lanes E). As indicated below the blots, the following specific probes are used: CDS (H2A coding region), SB2.3, 3′UTR-II, SE1, and 3′UTR-III. The locations of the probes are shown in Fig. 1. Numbers at the left indicate the size (in kb) and mobility of the restriction fragments for HindIII-digested λ DNA.
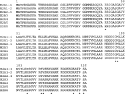
Fig. 3. Alignment of the amino acid sequences deduced from the different Leishmania infantum H2A genes. Amino acid positions that are non-identical in all proteins are indicated by asterisks.

Fig. 4. Comparison of the 5′-UTR sequences of the different H2A genes. Alignment for maximal identity was done using the CLUSTALW program, available at the European Bioinformatics Institute server (http://www.ebi.ac.uk/). The AG dinucleotide acceptor sites for spliced leader addition and the ATG initiation codons are underlined. Hyphens represent introduced gaps for the optimum alignment. Nucleotide residue numbering is shown at the end of each line. Conserved sequences in all the 5′-UTRs are indicated by asterisks.
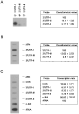
Fig. 5. Analysis of the expression levels of Leishmania infantum H2A RNAs. (A) The steady-state levels of the different H2A transcripts were determined by S1 protection analysis using 5′-labelled oligonucleotides, reverse and complementary to specific regions of the 3′UTR-I (no. 3′UTR-I), the 3′UTR-II (no. 3′ UTR-II), or the 3′UTR-III (no. 3′UTR-III). Oligonucleotides were hybridized in molar excess (0·07 pmol) with 2 μg of poly(A)+ RNA from logarithmic promastigotes. After 3 h of hybridization, samples were incubated with 40 units of S1 nuclease for 15 min. The S1 products were analysed on 15% polyacrylamide–7 M urea gels. Three independent experiments were made and the autoradiographs were quantified by densitometric scanning (panel on the right). Densitometric measures were normalized to the protection signal values for the 3′UTR-I oligonucleotide (taken arbitrarily as 100). (B) L. infantum poly(A)+ RNA was used as template to synthesize α-32P-labelled cDNA probe, which was hybridized to linearized plasmid DNA (5 μg/slot) immobilized on a membrane. Plasmids were pBluescript (pBls) containing the 3 types of H2A 3′UTRs: 3′UTR-I, 3′UTR-III and 3′UTR-II. Hybridization signals were quantitated using a Phosphorimager. After subtracting the unspecific hybridization value (pBls slot), the data were normalized to the hybridization value for the 3′UTR-I plasmid (set arbitrarily as 100). (C) Analysis of the H2A gene transcription by nuclear run-on assays. Run-on transcription was performed with nuclei from L. infantum logarithmic promastigotes. The run-on transcripts were hybridized to linearized plasmid DNA (5 μg/slot) immobilized on a nylon filter. Plasmids contain inserts for different regions of the H2A genes: the coding region (CDS), the 3′UTR-I, the 3′UTR-III and the 3′UTR-II. Also plasmids containing a Trypanosoma cruzi α-tubulin cDNA (Soares et al. 1989) (α-tub.) or a fragment of the L. infantum 24Sα rDNA gene (Quijada et al. 1997 b) (rRNA) were used. The slot marked as pBls contains the Bluescript plasmid. The panel on the right shows the quantification of relative transcription rates for the different genes after densitometric analysis of the autoradiographs from 3 independent experiments. Data were normalized to the transcription rate of the rRNA genes (taken as 100).

Fig. 6. Expression of the different H2A mRNAs in logarithmic and stationary phases of growth. Northern blots containing 5 μg of total RNA from Leishmania infantum promastigotes during logarithmic (L) or stationary (S) phase of growth were hybridized to specific probes for the H2A coding region (panel CDS), the 3′UTR-I (panel 3′UTR-I), the 3′UTR-III (panel 3′UTR-III), the 3′UTR-II (panel 3′UTR-II), or the Trypanosoma cruzi α-tubulin (panel α-tub.). The ethidium bromide staining of the agarose gel is shown (panel rRNA). The sizes of hybridization bands (in kb) are indicated.
 You have
Access
- 12
- Cited by