





Undernutrition, characterised by inadequate food intake and protein-deficient diets, remains a pervasive global issue that affects millions of individuals, particularly pregnant women, young children and older adults(Reference Ibrahim, Zambruni and Melby1). Defined as inadequate or imbalanced nutrient intake, malnutrition poses significant health risks and contributes to several adverse outcomes. Notably, undernutrition substantially increases the susceptibility of children to infectious diseases, leading to a higher risk of mortality, with undernutrition estimated as the underlying cause of 45 % of global deaths in children under the age of 5 years(Reference Rytter, Kolte and Briend2,Reference Tette, Sifah and Nartey3) . Numerous studies have highlighted the role of nutrition in immune suppression and increased susceptibility to infectious diseases(Reference Tette, Sifah and Nartey3,Reference Costa, Morais and Pedrosa4) . The relationship between undernutrition and impaired immune function has been extensively studied. In undernourished children, immune suppression and disease susceptibility are associated with thymic involution and increased immune apoptosis(Reference Rytter, Namusoke and Ritz5,Reference Santos, Oliveira and Silva6) . Studies have demonstrated correlations among thymus size, infectious disease severity and indicators of nutritional status in children with severe acute undernutrition(Reference Rytter, Kolte and Briend2,Reference Nabukeera-Barungi, Lanyero and Grenov7) .
Experimental animal models have been pivotal in investigating lymphoid atrophy and its underlying mechanisms across age groups(Reference Ortiz, Cortés and Pérez8). The lactation period is critical for growth and development, with undernutrition exerting more severe effects than in adults(Reference Gonzalez-Gutierrez, Ortiz-Muniz and Garcia-Rodriguez9). Studies using a mouse model of experimental Zn deficiency have demonstrated that deficiencies in Zn and protein-calorie intake lead to increased glucocorticoid production and thymocyte apoptosis(Reference Wessels, Rolles and Slusarenko10). High rates of apoptosis in the double-negative thymocyte subpopulation have been observed in rats undernourished during lactation(Reference Ortiz, Cortés and Cortés11). The involution of the thymus and increased apoptosis have been observed, suggesting that the thymus is a target organ of undernutrition(Reference Savino, Duraes and Maldonado-Galdeano12). Understanding alterations in apoptosis during undernutrition is crucial for elucidating the mechanisms underlying immune suppression in undernourished organisms.
The thymus, a primary lymphoid organ, plays a vital role in the maturation of T cell precursors derived from the bone marrow, establishing a T cell pool during prenatal and early postnatal life, and providing a unique microenvironment that promotes thymocyte development through various interactions(Reference Xing, Wang and Jameson13,Reference Thapa and Farber14) . Differentiation of T lymphocyte precursors involve the sequential expression of membrane markers, rearrangement of T cell receptor genes and acquisition of CD4 and CD8 markers(Reference Savino, Duraes and Maldonado-Galdeano12).
Apoptosis is a fundamental process in thymocyte selection during T cell development. The decision to initiate apoptotic signalling relies on the balance between survival and death(Reference Lutes, Steier and McIntyre15). Caspase activation is crucial for the apoptotic cascade, which leads to genomic DNA cleavage and cell fragmentation(Reference Ruiz Perez, Vandenabeele and Tougaard16).
This study aimed to investigate the effects of undernutrition on caspase activation and thymocyte apoptosis to elucidate the mechanisms underlying immune suppression in undernourished organisms. Specifically, we evaluated changes in the activation pattern of caspases 8 and 9 in apoptotic thymocytes and examined the relationship between caspase activation and cell cycle phases. Furthermore, we assessed mitochondrial function in thymocytes from undernourished rats and explored alterations in thymocyte subpopulations. By elucidating the roles of caspase activation, mitochondrial dysfunction and thymocyte development in undernutrition-induced immune suppression, this study aimed to enhance understanding of the immune response to undernutrition and identify therapeutic targets to mitigate its detrimental effects.
Materials and methods
Animals
Wistar rats from a closed breeding colony at the Universidad Autónoma Metropolitana-Iztapalapa were housed under a 12-h light/12-h dark cycle at 22–25 °C and 45 % relative humidity. Nursing mothers were fed a balanced rodent diet (Teklad Global 2018S, Harland) during pregnancy and lactation, as detailed in the supplementary materials, and provided with filtered water ad libitum. Experiments were performed in accordance with the guidelines of the Universidad Autónoma Metropolitana(17,Reference Vargas-Miranda, Ambriz-García and Navarro-Maldonado18) and the Official Mexican Guidelines(19).
Rats were housed in acrylic cages with metal mesh lids and provided with glass drinking bottles fitted with food-grade rubber stoppers and stainless-steel drinking tubes. No polycarbonate or bisphenol-containing materials were used. Bedding consisted of natural, sieved pine sawdust subjected to ultra-violet sterilisation. Water was filtered (to remove sediment and activated carbon) and UV-treated prior to use. These housing conditions were selected to minimise exposure to potential endocrine-disrupting chemicals.
All animal experiments were approved by the Ethical Committee and the Divisional Council of Life and Health Sciences Division of the Metropolitan Autonomous University, Iztapalapa, through agreement 3/84.22 on 21 December 2022, by the CBS Divisional Council(20). The research protocol was reviewed and approved prior to study commencement to ensure the highest animal welfare standards, including the management of unexpected animal suffering and the establishment of humane endpoints. All experiments complied with relevant national and international laws and regulations. The experiments conducted in accordance with the ARRIVE guidelines are described below(Reference Kilkenny, Browne and Cuthill21).
Experimental undernutrition
Experimental undernutrition was induced by competitive suckling(Reference Ortiz, Cortés and Pérez8,Reference Gonzalez-Gutierrez, Ortiz-Muniz and Garcia-Rodriguez9) . One-day-old rats from different litters were randomly assigned to an experimental undernourished group in which the nursing dams suckled sixteen pups. In contrast, dams in the control group suckled only six to eight pups. Pups in the experimental group could not be fed adequately due to competition for milk, even when the dam was adequately fed(Reference Ortiz, Cortés and Cortés11). The distribution of male and female rats was equal in each litter. Pups were weighed daily from the first day until weaning (1–21 d after birth). In accordance with the classification used for children with a 40 % or greater weight deficit, two undernourished animals were selected from each experimental litter(Reference Gomez Santos22). Sparse hair, bone fragility and low activity levels were additional characteristics of undernourished rats. Conversely, two well-nourished pups were selected from each of the three control litters. Three independent experiments were conducted with three male and three female malnourished rats and three male and three female well-nourished rats; in total, 12 rats were used.
Obtaining the thymus
After exposure to CO2, rats were euthanised by cervical dislocation, and the thymus was dissected. Cells were obtained as described by Ortiz et al.(Reference Ortiz, Cortés and Cortés11) by sieving the tissue through a nylon screen and resuspending it in phosphate-buffered saline (pH = 7·4; Microlab).
Mitochondrial permeability assay
The mitochondrial membrane potential (Δψm) was determined by staining thymocytes with the cationic mitochondrial dye kit MitoPT JC-1 (Immunochemistry Technologies) according to the manufacturer’s protocol. Cells (1·0 × 106) were incubated in 0·5 ml of 1× MitoPT solution at 37 °C for 15 min, washed twice in assay buffer and resuspended in 1 ml of assay buffer. A total of 10 000 cells were analysed using a flow cytometer (FACScan model; Becton Dickinson).
Cell surface antigen staining
Commercially available conjugated anti-rat antibodies, APC anti-CD4 and phycoerythrin anti-CD8 (BD Pharmingen), were used. Briefly, 100 µL of cell suspension was incubated with 5 µL of a fluorescently conjugated antibody for 30 min at 4 °C. After incubation, cells were washed with 1 % bovine serum albumin (BSA) prepared in phosphate-buffered saline. The cells were subsequently subjected to a caspase activity assay.
Caspase activity assays
Cells were incubated with FLICA, a fluorescent caspase inhibitor targeting polycaspases, caspase 8 or caspase 9. Briefly, 1 × 10⁶ cells at a density of 5 × 10⁵ cells/100 μL were incubated for 1 h at 37 °C and 5 % CO2 with 30× FLICA solution at a ratio of 1:30 (volume of 30× FLICA solution: volume of cell suspension). Cells were washed with phosphate-buffered saline, and 50 μL of 7-AAD (7-aminoactinomycin D; 10 μg/mL) was added. The cells were then incubated for 10 min.
Evaluation of the cell cycle and caspases
Cells were treated with FLICA polycaspases as previously described. Subsequently, cells were fixed with 1 % paraformaldehyde to allow 7-AAD to enter the nucleus and stain the DNA.
Flow cytometry analysis
Flow cytometry assays were performed using a FACSCalibur flow cytometer (BD Biosciences). At least 10 000 events were collected for each sample, and data were analysed using CellQuest software (BDIS). To account for background fluorescence, markers for positive and negative cells were set based on negative controls in all cases.
Statistical analysis
Data normality was assessed with the Shapiro‒Wilk test. Body weight, thymus weight and cell number are expressed as arithmetic means and standard deviations and were analysed using Student’s t test. Results for caspase activity, mitochondrial permeability and cell cycle analyses are expressed as arithmetic means and standard errors. Differences between groups were analysed using the Mann–Whitney U test for unpaired samples. Differences with P values < 0·05 were considered statistically significant.
Results
Undernutrition reduces body weight, thymus weight and cellularity
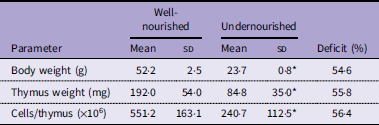
All rats used in this study had similar weights at 1 d of age (6·3 ± 0·8 g). At 21 d of age, the average weight of the WN rats was 52 ± 2·5 g, while the average weight of the undernourished rats was 23·7 ± 0·8 g, corresponding to a weight deficit of 49·9 % ± 1·7. The mean and standard deviation of body weight, thymus weight and the number of cells per thymus for six rats in each group are shown in Table 1. Both parameters were significantly lower in UN rats than in WN rats. These data demonstrate that undernutrition compromises somatic growth and thymic cellularity during early postnatal development.
Body weight, thymic weight and number of cells per organ in well-nourished and undernourished rats

Table 1. Long description
A table comparing body weight, thymus weight, and cell count in well-nourished and undernourished rats. The table has four rows and three columns. The columns are labeled ‘Parameter’, ‘Well-nourished’, and ‘Undernourished’. The ‘Well-nourished’ and ‘Undernourished’ columns are further divided into ‘Mean’, ‘SD’, ‘Mean’, and ‘SD’. The rows are labeled ‘Body weight (g)’, ‘Thymus weight (mg)’, and ‘Cells/thymus (x10^6)’. Row 1: Body weight (g), Well-nourished Mean 52.2, Well-nourished SD 2.5, Undernourished Mean 23.7, Undernourished SD 0.8, Deficit 54.6 percent. Row 2: Thymus weight (mg), Well-nourished Mean 192.0, Well-nourished SD 54.0, Undernourished Mean 84.8, Undernourished SD 35.0, Deficit 55.8 percent. Row 3: Cells/thymus (x10^6), Well-nourished Mean 551.2, Well-nourished SD 163.1, Undernourished Mean 240.7, Undernourished SD 112.5, Deficit 56.4 percent.
A significant difference was observed between well-nourished and undernourished untreated rats. The mean and standard deviation for each group was recorded for six rats. The Shapiro–Wilk test was applied to verify the normality of the data, and the Student’s t test was used to assess statistical differences, *P < 0·05.
Undernutrition alters thymocyte subset distribution
The thymocyte subpopulations are shown in Figure 1. Compared with the WN group (8·9 ± 2·2 %), the UN group had a higher CD4-CD8- thymocyte ratio (15·5 ± 3·8 %), and also the proportion of CD4+ CD8+ thymocytes was greater in the UN group (70·6 ± 4·4 % v. 64·8 ± 3·4 %). Additionally, the prevalence of single-positive CD4+ and CD8+ thymocytes was lower in the UN group (7·2 ± 1·7 % and 7·2 ± 2·1 %, respectively) than in the WN group (11·9 ± 3·2 % and 14·0 ± 2·2 %, respectively), indicating that undernutrition disrupts the normal balance of thymocyte maturation stages, with a relative accumulation of immature populations.
Effect of suckling undernutrition on Wistar rat thymocyte subpopulations. Thymocyte subsets in well-nourished (WN, n 6) and undernourished (UN, n 6) rats. The analysis was in thymocytes gate in FSC v. SSC graph, and the subpopulations were identified in CD4+ v. CD8+ dot plot. The horizontal lines represent the median. The Shapiro–Wilk test was applied to verify the normality of the data. The Mann–Whitney test was used to assess statistical differences between experimental groups; ∗P < 0·05 was considered significant. FSC, forward scatter; SSC, side scatter.

Undernutrition increases global thymocyte apoptosis
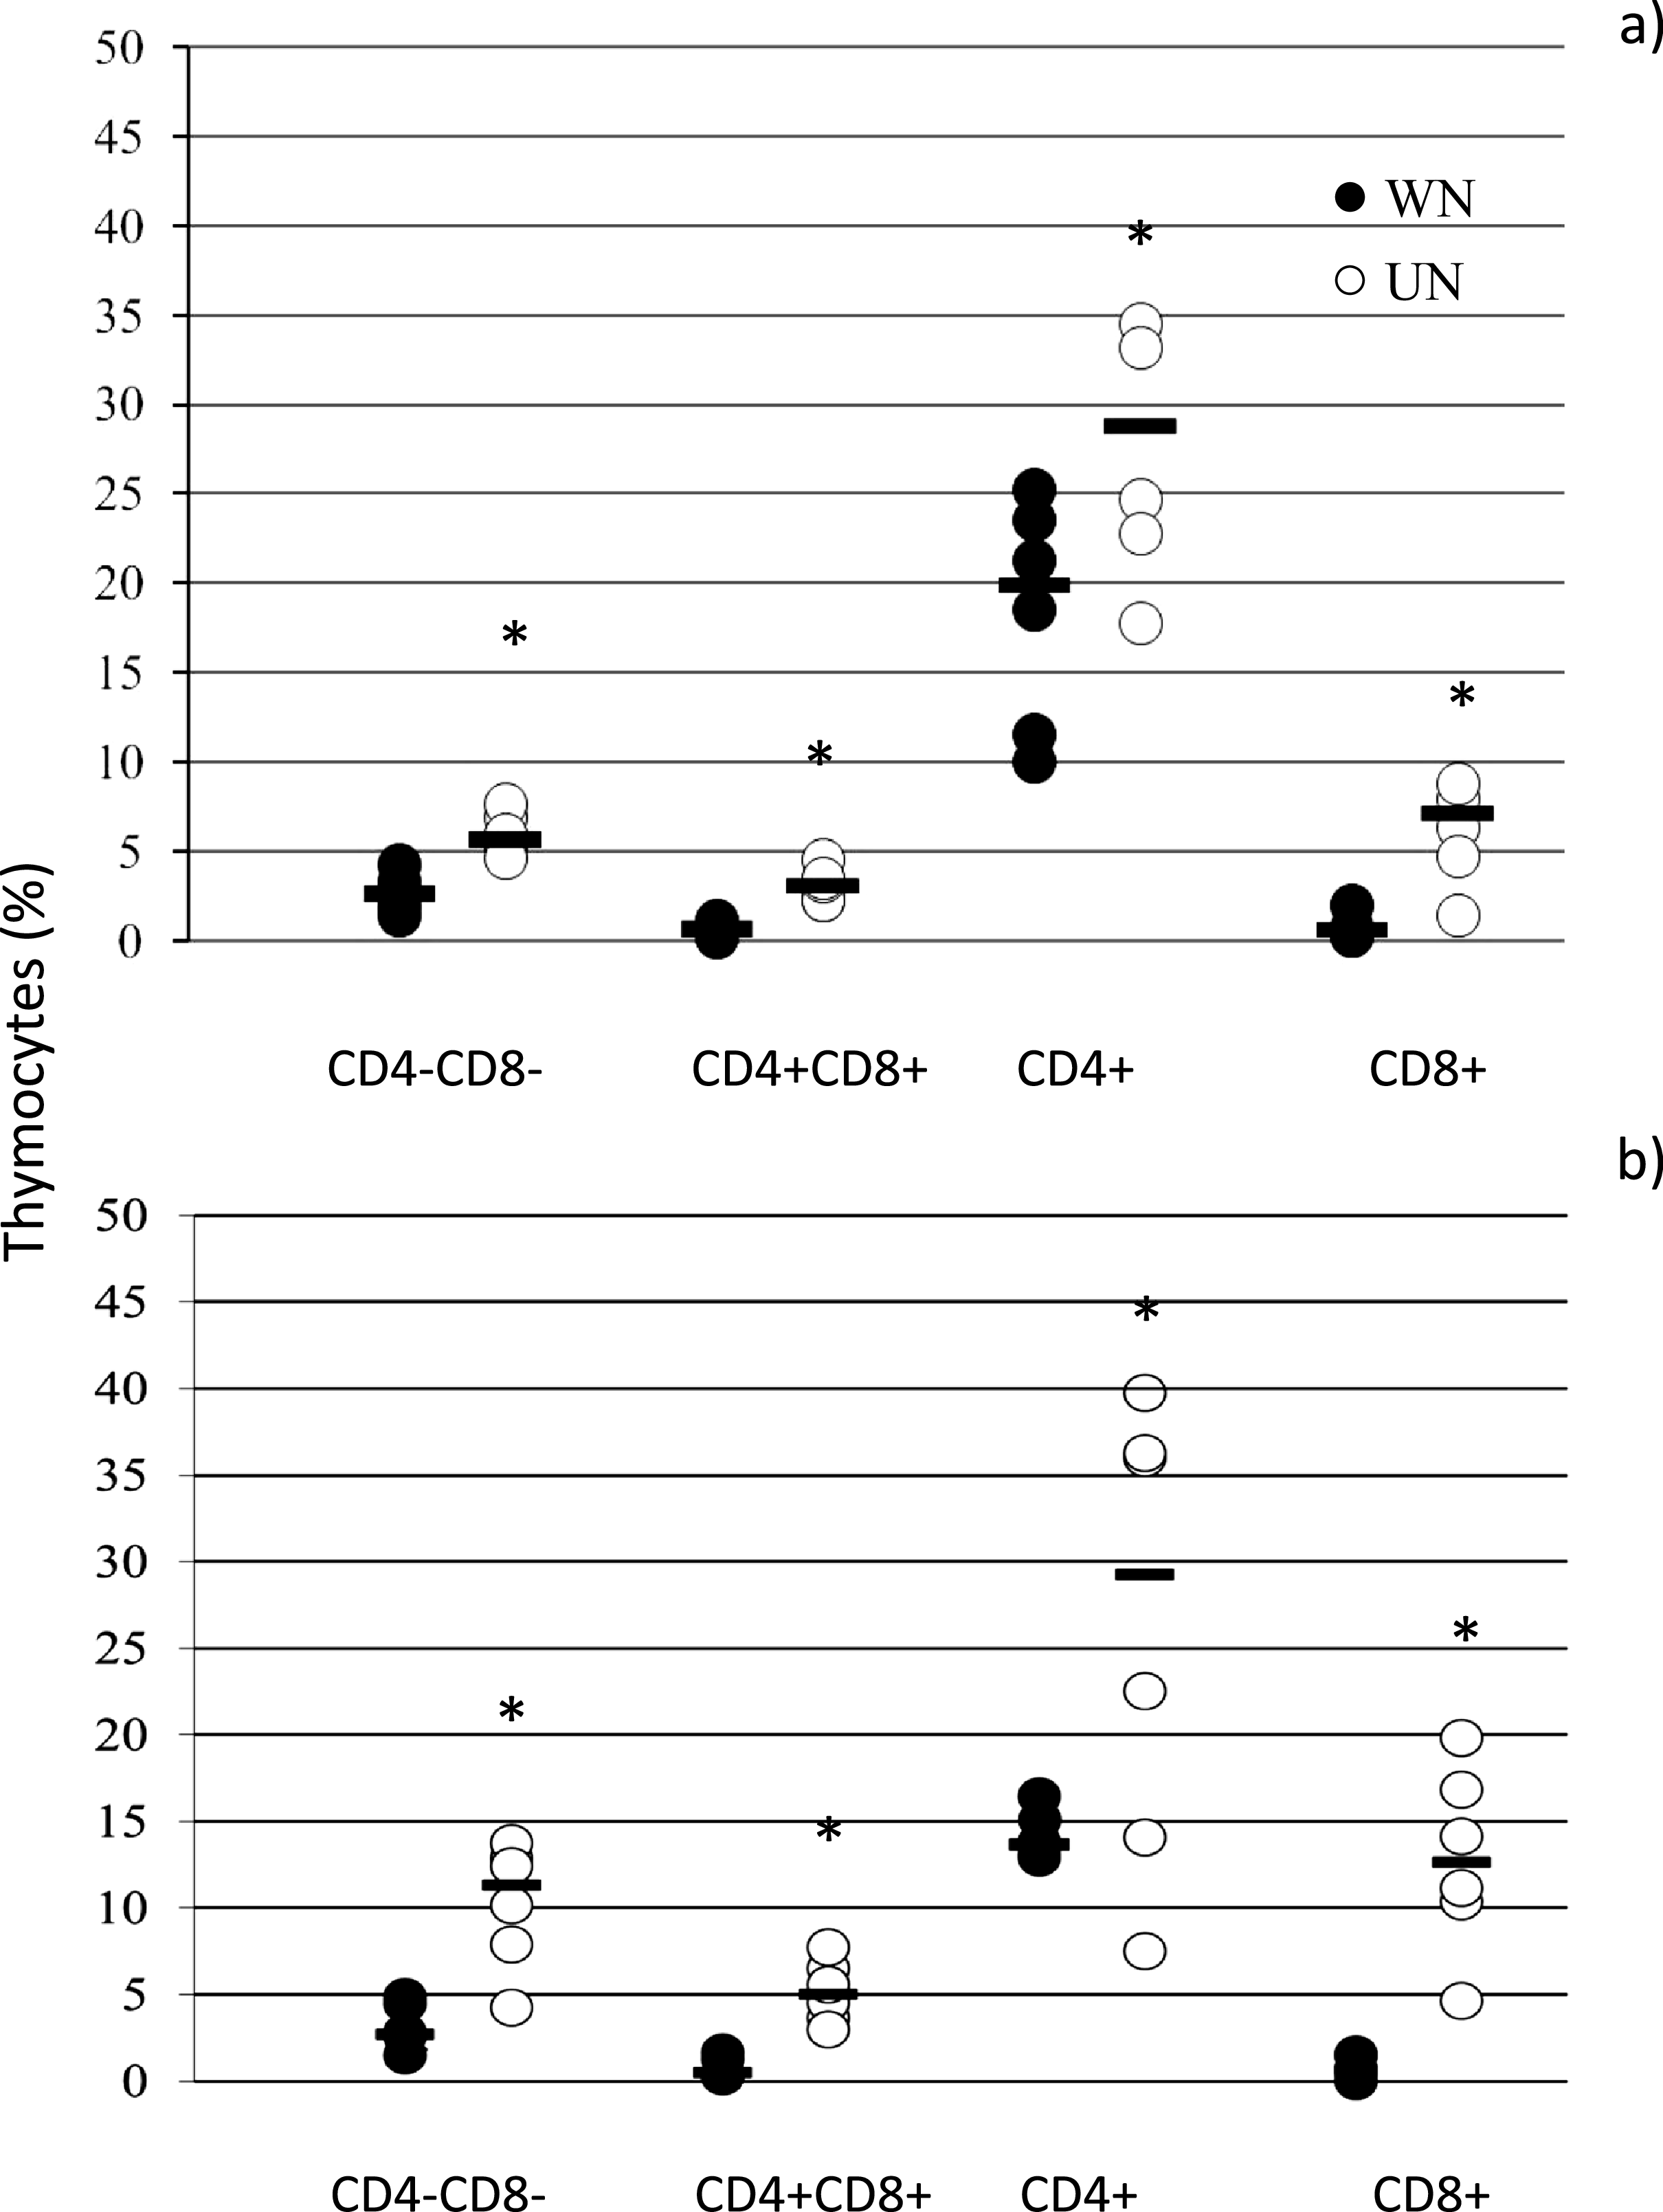
The regions used to analyse polycaspase activity in thymocytes are shown in Figure 2a and 2b. Undernourished rats had fewer live thymocytes (83·8 ± 1·3 %) than well-nourished rats (93·6 ± 2·2 %). Additionally, the percentage of early and late apoptotic thymocytes was greater in the undernourished group (7·5 ± 3·9 % and 8·5 ± 3·5 %, respectively) than in the well-nourished group (2·7 ± 2·0 % and 0·7 ± 0·6 %, respectively). There was no difference in the proportion of necrotic cells between groups (UN: 1·0 ± 0·7 % v. WN: 0·7 ± 0·6 %) (Figure 2c). These findings show that undernutrition is associated with a marked increase in thymocyte apoptosis, but not a rise in necrotic cell death.
Effect of suckling undernutrition on Wistar rat thymocyte apoptosis. (a) The thymocyte gate is set in forward scatter (FSC) and side scatter (SSC). (b) Representative dot plot of the analysis of caspase activity. (c) Spontaneous apoptosis in thymocytes of well-nourished and undernourished rats. The horizontal lines represent the median. The Shapiro–Wilk test was applied to verify the normality of the data. The Mann–Whitney test was used to assess statistical differences between experimental groups. *P < 0·05 was considered significant. WN, n 6; UN, n 6. FLICA, fluorescent inhibitor of caspases.

Apoptosis is elevated across all thymocyte subsets in undernourished rats
Double-negative (CD4-CD8-) thymocytes
The apoptotic subpopulations of thymocytes are shown in Figure 3a. Compared with WN rats, the proportion of the subpopulation of CD4-CD8- cells undergoing early apoptosis was increased in UN rats (7·1 ± 1·8 % v. 2·9 ± 2·1 %, respectively). Additionally, the percentage of late apoptotic cells was greater in the UN group (27·1 ± 8·7 % v. 7·9 ± 4·2 %). Consequently, the live CD4-CD8- population was lower (64·9 ± 9·7 % v. 89·4 ± 6·1 %).
The percentage of cells in apoptosis in each subpopulation was evaluated by polycaspases and 7-AAD staining. (a) CD4-CD8-; (b) CD4 + CD8+; (c) CD4+; (d) CD8+. The horizontal lines represent the median. The Shapiro–Wilk test was applied to verify the normality of the data. The Mann–Whitney test was used to assess statistical differences between experimental groups; *P < 0·05 was considered significant. WN, n 6; UN, n 6.

Double-positive (CD4 + CD8+) thymocytes
Data on apoptosis in a CD4 + CD8+ subpopulation are shown in Figure 3b. The percentage of early apoptotic cells was greater in UN rats than in WN rats (8·6 ± 2·6 % v. 2·6 ± 2·1 %). The percentage of late apoptotic cells also increased in UN rats (1·2 ± 0·9 v. 0·4 ± 0·2 %). Consequently, the live CD4 + CD8+ population was lower (90·1 ± 3·2 % v. 96·8 ± 1·9 %).
Single-positive CD4 + thymocytes
The percentage of apoptotic CD4+ cells is shown in Figure 3c. Compared with WN rats, UN rats exhibited a higher proportion of CD4+ cells in early apoptosis (12·4 ± 4·8 % v. 2·8 ± 3·0 %, respectively). Additionally, the percentage of CD4+ cells in late apoptosis was increased in UN rats (2·0 ± 1·2 % v. 0·6 ± 0·2 %). The proportion of live CD4+ cells was lower in UN rats (85·5 ± 4·9 % v. 96·5 ± 3·1 %).
Single-positive CD8 + thymocytes
Apoptosis data for the CD8+ cells are shown in Figure 3d. Compared with the WN rats, UN rats showed an increase in the proportion of CD8+ cells in early (7·7 ± 2·5 % v. 3·4 ± 2·4 %) and late (16·6 ± 9·6 % v. 8·0 ± 2·7 %) apoptosis. The proportion of live CD8+ cells was lower in the UN group (75·3 ± 9·9 % v. 88·0 ± 2·7 %).
Taken together, undernutrition induces apoptosis across all thymocyte subsets, affecting both immature and mature populations.
Cell cycle distribution is unaltered
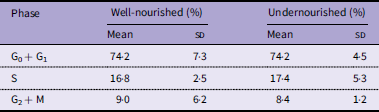
Cell cycle phases were analysed using DNA content as a marker, as determined by 7-AAD fluorescence. ModFit software was used to analyse the proportion of cells in each cell cycle phase. The results are presented in Table 2. Data from the UN group did not differ from those in the WN group.
Distribution of thymocytes in each cell cycle phase. Data for each group are presented as the mean and standard deviation

Table 2. Long description
A table comparing the distribution of thymocytes in cell cycle phases between well-nourished and undernourished groups. The table has three rows and four columns. The columns are labeled ‘Phase’, ‘Well-nourished (%) Mean’, ‘Well-nourished (%) SD’, ‘Undernourished (%) Mean’, and ‘Undernourished (%) SD’. The rows are labeled ‘G0 + G1’, ‘S’, and ‘G2 + M’. Row 1: G0 + G1, Well-nourished (%) Mean: 74.2, Well-nourished (%) SD: 7.3, Undernourished (%) Mean: 74.2, Undernourished (%) SD: 4.5. Row 2: S, Well-nourished (%) Mean: 16.8, Well-nourished (%) SD: 2.5, Undernourished (%) Mean: 17.4, Undernourished (%) SD: 5.3. Row 3: G2 + M, Well-nourished (%) Mean: 9.0, Well-nourished (%) SD: 6.2, Undernourished (%) Mean: 8.4, Undernourished (%) SD: 1.2.
A significant difference was not observed between well-nourished and undernourished rats. The mean and standard deviation for each group was recorded for six rats. The Shapiro–Wilk test was applied to verify the normality of the data, and the Mann–Whitney test was used to assess statistical differences between experimental groups with *P < 0·05.
Apoptosis is enriched in the G0/G1 phase of the cell cycle
The regions selected for analysis are shown in Figure 4a and b, and the distribution of cells in each phase of the cell cycle and apoptosis is shown in Figure 4c. The percentage of apoptotic cells in the G0 + G1 phase was greater in UN rats than in WN rats (G0 + G1:56·7 ± 7·8 % v. 40·9 ± 12·1 %, respectively). The proportion of apoptotic cells in the S phase was lower in UN rats (S: 24·3 ± 4·3 % v. 37·8 ± 11·0 %) than in WN rats. However, no statistically significant difference in the percentage of apoptotic cells in the G2 + M phase was observed between the two groups (18·9 ± 7·0 % v. 21·2 ± 8·9 %). These data indicate that apoptosis in undernourished thymocytes preferentially occurs during the G0/G1 phase.
Cell cycle and apoptosis by polycaspases. (a) The singlet thymocytes gate is set in FL3-Width and FL3-Area; (b) Representative dot plot of the analysis of caspase activity and cell cycle phases; (c) Proportion of apoptotic cells in each cell cycle phase in total of thymocytes. The values are based on flow cytometric analysis of 20 000 events. The horizontal lines represent the median. The Shapiro–Wilk test was applied to verify the normality of the data. The Mann–Whitney test was used to assess statistical differences between experimental groups; *P < 0·05 was considered significant. WN, n 6; UN, n 6. FLICA, fluorescent inhibitor of caspases.

Undernutrition impairs mitochondrial membrane potential
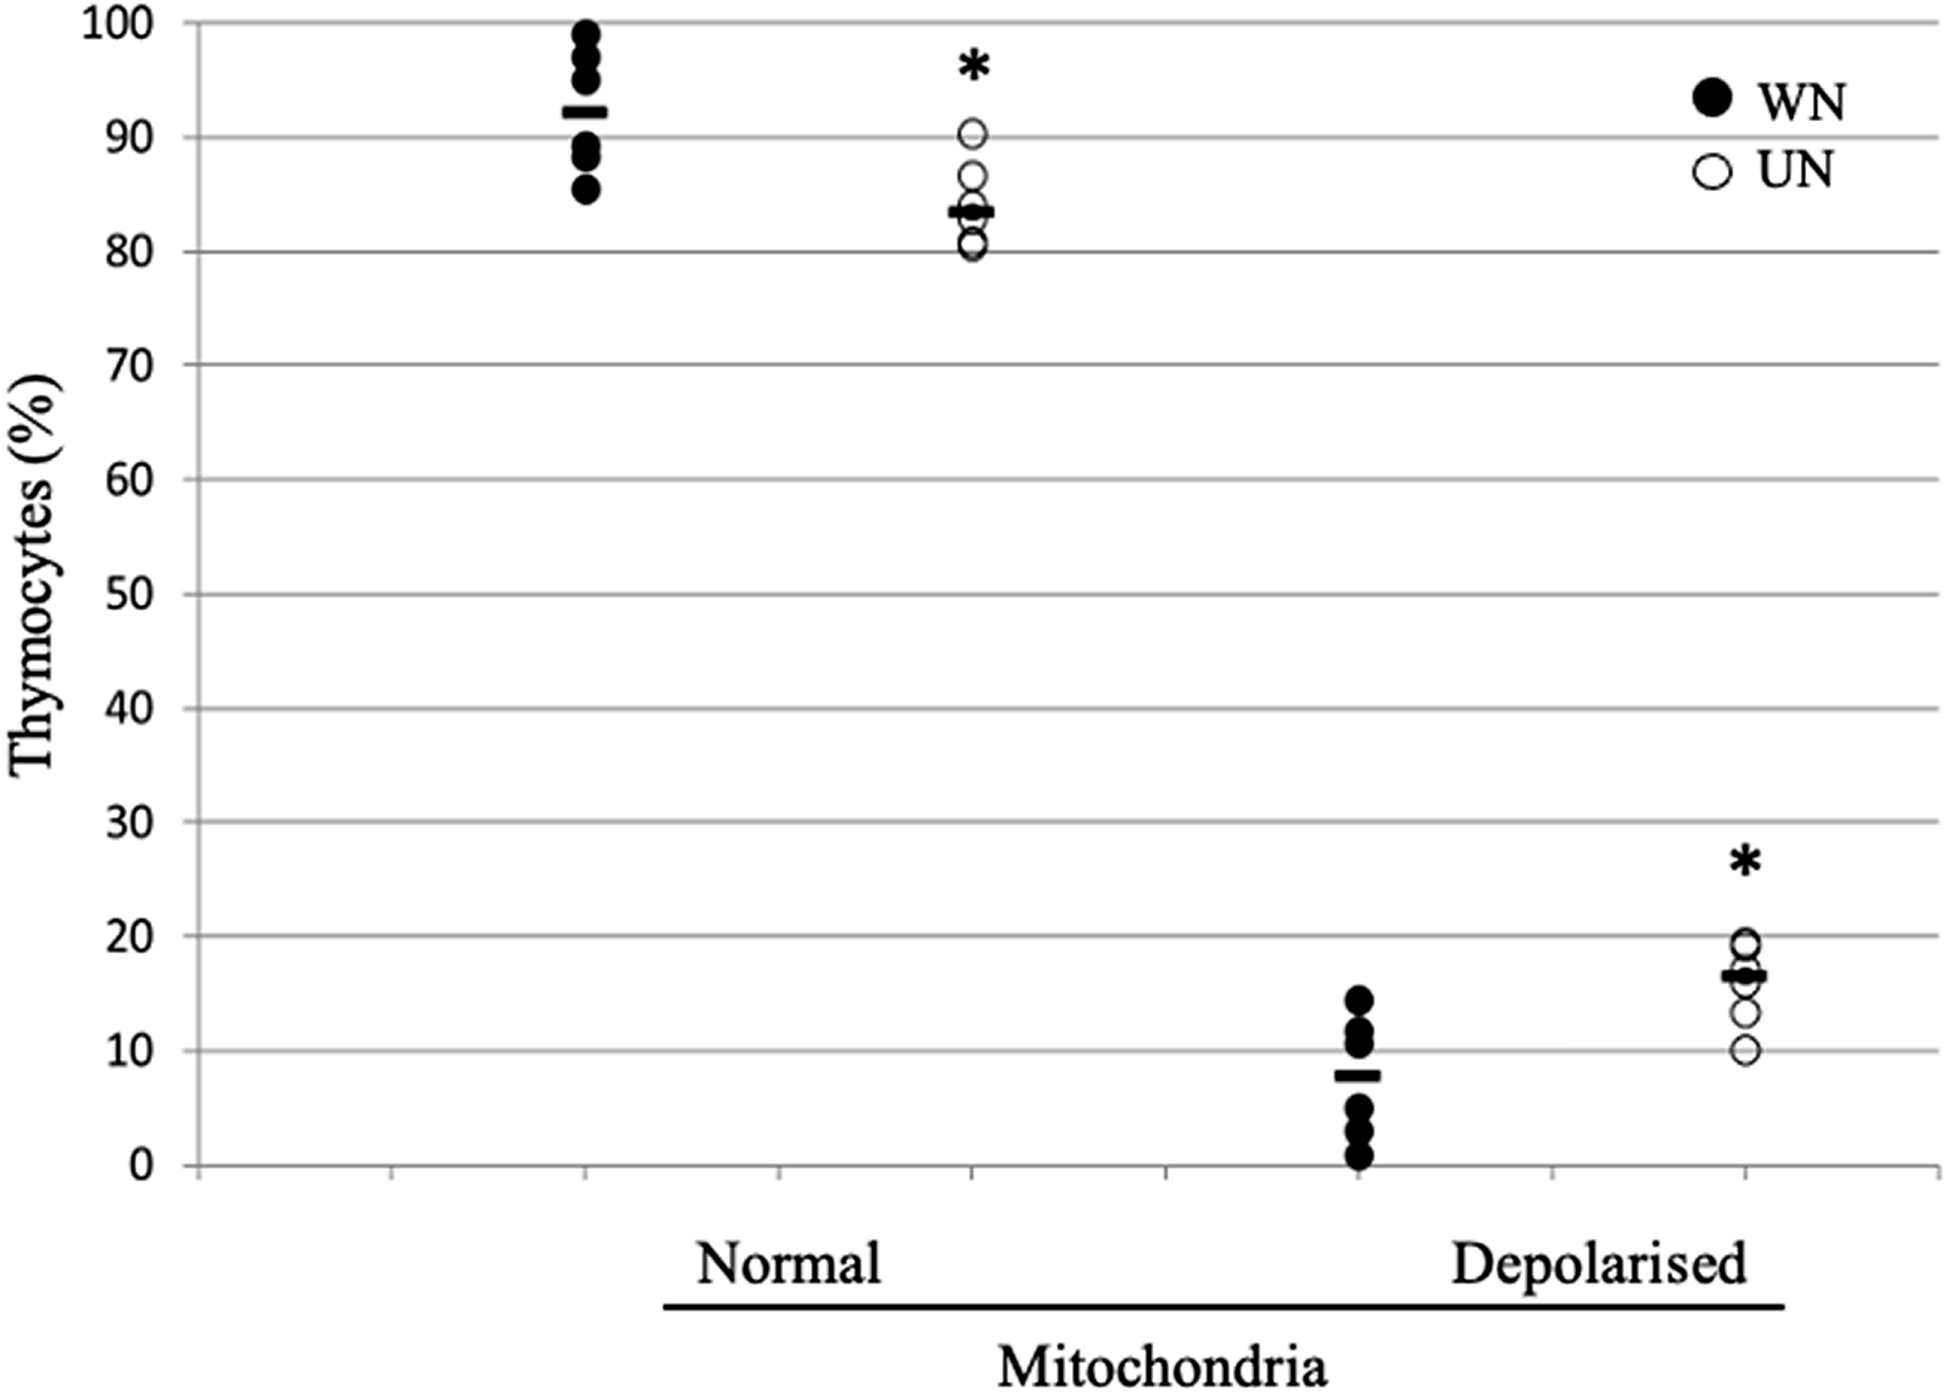
Mitochondrial integrity was evaluated using the cationic mitochondrial dye JC-1. The effects of undernutrition on mitochondria are shown in Figure 5. The percentage of thymocytes with an average mitochondrial membrane potential was significantly lower in UN rats (83·5 % ± 2·1; P < 0·05) than in the WN group (92·1 % ± 2·7), indicating that undernutrition compromises mitochondrial integrity in most thymocytes.
Evaluation of mitochondrial function. The rats in the undernutrition group show fewer cells with functional mitochondria. The monomer is green fluorescent (λ ex 520 nm) at low membrane potential, and the aggregates are red fluorescent (λ ex 520 nm) at high membrane potential. *Statistical difference: WN v. UN, P < 0·05. WN, n 6; UN, n 6. The horizontal lines represent the median. The Shapiro–Wilk test was used to assess the normality of the data. The Mann–Whitney test was used to assess for statistical differences between experimental groups; *P < 0·05 was considered significant.

Undernutrition activates both extrinsic and intrinsic apoptotic pathways
Total thymocytes
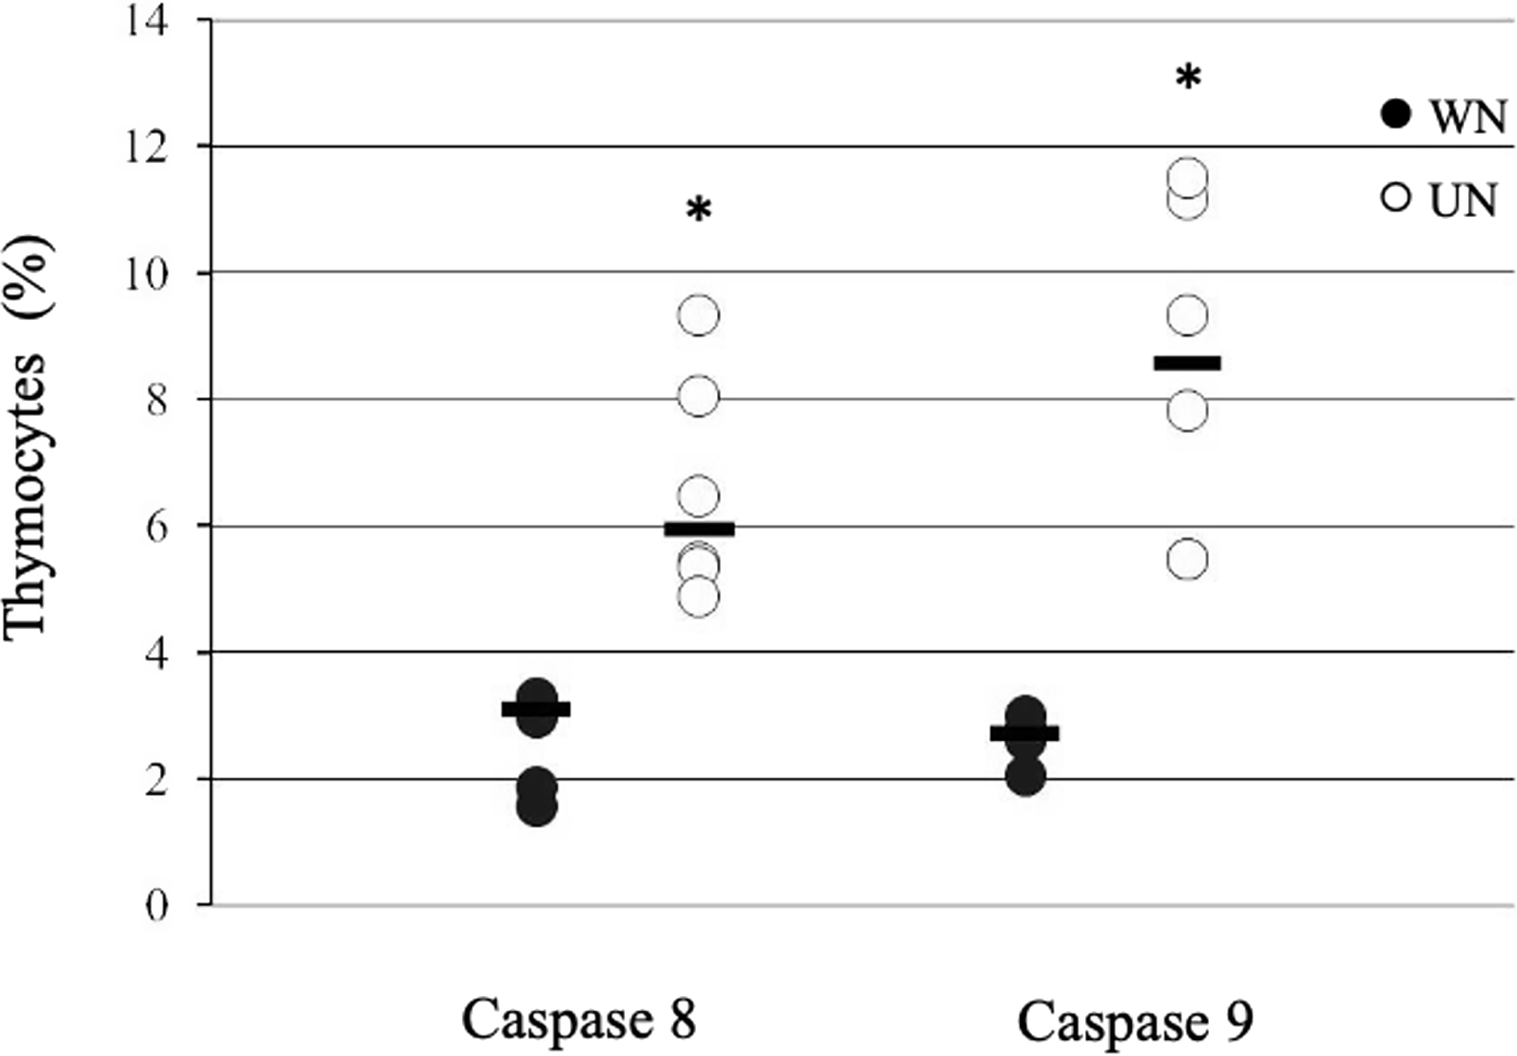
The proportion of thymocytes expressing caspases 8 and 9 during early apoptosis is shown in Figure 6. The proportion of caspase 8-positive thymocytes was higher in undernourished rats compared with well-nourished rats (6·5 ± 1·7 % v. 2·7 ± 0·7 %, respectively), representing a 2·4-fold increase. Caspase 9 levels were also elevated in the UN group compared with the WN group (8·4 ± 2·6 % v. 2·6 ± 0·3 %), 3·2-fold higher.
Thymocytes expressing caspase 8 and caspase 9 in early apoptosis. The horizontal lines represent the median. The Shapiro–Wilk test was applied to verify the normality of the data, and the Mann–Whitney test was used to assess statistical differences between experimental groups; *P < 0·0 was considered significant. WN, n 6; UN, n 6.

Thymocyte subsets
Data for the subpopulations undergoing early apoptosis with caspases 8 and 9 are shown in Figure 7. The percentage of CD4-CD8- cells with caspase 8 expression was 2·1-fold greater in UN rats than in WN rats (5·9 ± 1·1 % v. 2·8 ± 1·2 %). The percentage of cells with caspase 9 expression in the UN group was 3·4-fold greater than that in the WN group (10·2 ± 3·6 % v. 3·0 ± 1·3 %).
Distribution of subpopulations of thymocytes in apoptosis evaluated by caspase 8 (a) and caspase 9 (b). The horizontal lines represent the median. The Shapiro–Wilk test was applied to verify the normality of the data and the Mann–Whitney test to assess statistical differences between experimental groups. *P < 0·05 was considered significant. WN, n 6; UN, n 6.

The percentage of CD4 + CD8+ cells with a positive correlation with caspase 8 expression was 4·3-fold greater in undernourished rats than in well-nourished rats (3·0 ± 0·8 % v. 0·7 ± 0·5 %). The percentage of caspase 9-positive cells was significantly greater in UN rats than in control rats (5·1 ± 1·7 % v. 0·7 ± 0·5 % for UN and WN, respectively).
The percentage of CD4+ caspase 8-positive cells was 1·5-fold greater in the UN group than in the WN group (27·6 ± 6·8 % v. 18·3 ± 6·2 %, respectively). The percentage of CD4+ caspase 9-positive cells was 1·8-fold greater in UN rats than in WN rats (26·0 ± 13·3 % v. 14·1 ± 1·3).
The proportion of caspase 8-positive cells in the CD8+ subpopulation was 8·8-fold greater in undernourished rats than in well-nourished rats (6·2 ± 2·8 v. 0·7 ± 0·6). The percentage of caspase 9-positive cells was 18·3-fold greater in the UN group than in the WN group (12·8 ± 5·3 v. 0·7 ± 0·6).
Therefore, the loss of mitochondrial membrane potential may indicate mitochondrial outer membrane permeabilisation, a pivotal upstream event in the intrinsic apoptotic cascade.
Collectively, these results demonstrate that undernutrition profoundly disrupts thymocyte homeostasis by impairing mitochondrial function and activating both extrinsic and intrinsic apoptotic pathways across all thymocyte developmental stages.
Discussion
This study used a competitive suckling model to induce undernutrition in rats, replicating a scenario relevant to vulnerable populations. The observed decrease in thymus weight and alterations in thymocyte subpopulations reinforce the model’s ability to mimic real-world effects of undernutrition(Reference Ortiz, Cortés and Cortés11,Reference Losada-Barragan, Umana-Perez and Duraes23) .
Although direct morphological analyses of thymocytes were not performed, the pronounced reduction in thymus weight and thymocyte number, together with significant alterations in thymocyte subpopulations and apoptotic signalling, are consistent with thymic atrophy and cortical thymocyte depletion widely reported in undernutrition models. These structural alterations have been extensively documented in experimental and clinical studies and are closely associated with increased thymocyte apoptosis and impaired thymic output.
The reduction in thymus weight and cellularity in undernourished rats aligns with studies highlighting the thymus as a vulnerable organ under undernutritional conditions, affecting its size and histological structure(Reference Rytter, Namusoke and Ritz5). Additionally, undernutrition has been shown to alter chemotactic factors, thereby affecting T lymphocyte migration and the immune response to parasitic diseases such as L. infantum (Reference Losada-Barragan, Umana-Perez and Cuervo-Escobar24). Increased lipid metabolism and tricarboxylic acid cycle proteins are closely associated with decreased proliferation, thereby altering the thymic microenvironment and contributing to thymic atrophy, as observed in various studies(Reference Savino, Duraes and Maldonado-Galdeano12). Nutrients and their metabolites contribute to epigenetic programming in immune cells, which may explain susceptibility to complex diseases such as metabolic syndrome, cancer and immune disorders in organisms with nutritional deficiencies(Reference Carlberg and Velleuer25).
The observed alterations in thymocyte subpopulations, particularly the decrease in single-positive thymocytes, likely translate into a decline in the generation of mature T lymphocytes. Other studies have directly assessed T cell populations in peripheral lymphoid organs to quantify the effects of undernutrition on overall T cell number and functionality. Previous studies have shown decreased CD3+ and CD3 + CD4+ lymphocyte subpopulations in the spleens of rats with moderate and severe undernutrition, as well as a weaker response to mitogens in culture(Reference Cortes-Barberena, Gonzalez-Marquez and Gomez-Olivares26).
The increase in double-negative thymocytes and decrease in single-positive thymocytes suggest a disruption in maturation, potentially reflecting impaired progression through positive and negative selection checkpoints. These processes are highly sensitive to metabolic stress and apoptotic thresholds, and their disruption may reduce thymic output of functionally competent T lymphocytes, thereby contributing to the systemic immunodeficiency observed in undernutrition. This finding is consistent with the finding that the competitive suckling model affects thymocyte subpopulations(Reference Ortiz, Cortés and Cortés11). This observation aligns with previous studies highlighting the thymus as a target organ in undernutrition, with specific alterations observed in models of protein undernutrition and Zn deficiency(Reference Savino, Duraes and Maldonado-Galdeano12). Future research could employ techniques such as single-cell RNA sequencing to better understand changes in gene expression during thymocyte development under undernourished conditions. This approach can reveal specific genes or pathways affected by nutritional deficiency.
The increase in caspase 8 and caspase 9 activation in undernourished rats is critical for understanding how undernutrition affects apoptosis and overall health. Studies in other animal models of malnutrition have also revealed increases in the activity of caspases 8 and 9, as well as caspase 3 and cytochrome c(Reference Liu, He and Zhang27). Increased caspase 8 activation suggests that undernutrition enhances cellular sensitivity to external apoptotic signals, potentially through the up-regulation of death receptors or ligands, such as Fas or TNF-related apoptosis-inducing ligand (TRAIL). The increase in caspase 9 activation indicates that mitochondrial dysfunction and oxidative stress are critical factors in undernutrition-induced apoptosis. Nutrient deficiencies impair mitochondrial function, leading to the release of pro-apoptotic factors and activation of the intrinsic apoptotic pathway. Previous studies have shown increased oxidative damage and altered antioxidant defence(Reference Gavia-Garcia, Gonzalez-Martinez and Miliar-Garcia28). These data suggest that undernutrition activates both the intrinsic and extrinsic apoptotic pathways, leading to a significant increase in thymocyte apoptosis across all subpopulations, with CD8+ cells appearing to be the most susceptible.
The increase in early and late apoptosis, as indicated by polycaspase/7-AAD-based apoptosis assessment, highlights the effect of malnutrition on apoptosis. Previous studies using annexin V and TUNEL assays have reported similar findings, underscoring the importance of apoptosis during thymocyte maturation as cells transition from the double-negative to the double-positive phenotype(Reference Ortiz, Cortés and Cortés11,Reference Ortiz, Cortés and González-Marquez29) . Future research should further explore these mechanisms. In particular, investigating the effects of undernutrition on mitochondrial reactive oxygen species production and exploring potential therapeutic interventions targeting reactive oxygen species scavenging and mitochondrial function may be valuable.
Taken together, these findings indicate that undernutrition affects thymic function through interconnected mechanisms involving mitochondrial dysfunction, dysregulated apoptosis and altered thymocyte maturation, rather than through isolated cellular events.
Undernutrition can induce intrinsic apoptosis through multiple mechanisms. It promotes DNA damage, as evidenced by increased chromosomal aberrations, micronucleus formation and oxidative stress, which, in turn, favour the accumulation of oxidative DNA lesions(Reference Gavia-Garcia, Gonzalez-Martinez and Miliar-Garcia28,Reference Golden and Ramdath30) . Undernutrition-induced DNA damage per se can activate the intrinsic apoptotic pathway by modulating the Bcl-2 family of proteins, leading to Bax and Bak activation and oligomerisation. In parallel, undernutrition disrupts the balance between the production and elimination of free radicals, alters antioxidant defence and promotes excessive lipid peroxidation(Reference Gavia-Garcia, Gonzalez-Martinez and Miliar-Garcia28), processes that compromise mitochondrial membrane integrity. Consistent with these mechanisms, we observed a significant decrease in mitochondrial membrane potential in thymocytes, supporting a mechanistic relationship between malnutrition, mitochondrial dysfunction and the increased apoptosis observed in thymocytes. Mitochondrial dysfunction acts both as a trigger and an execution mechanism of intrinsic apoptosis, culminating in Bax/Bak-mediated mitochondrial outer membrane permeabilisation, release of cytochrome c and other apoptogenic factors, bioenergetic collapse, apoptosome formation and caspase-9 activation, ultimately leading to cell death through the intrinsic apoptotic pathway. Collectively, the alterations observed in undernutrition support the induction of intrinsic apoptosis and link mitochondrial dysfunction to the increased caspase-9 activation observed in this study.
The increased caspase-8 activation observed in undernourished thymocytes suggests an enhanced susceptibility to extrinsic apoptotic cues. Undernutrition is known to alter cytokine balance, hormonal regulation and inflammatory mediators, all of which may lower the threshold for death receptor-mediated apoptosis. Although specific death receptors were not assessed in the present study, the concomitant activation of caspase 8 indicates that extrinsic signals may contribute to thymocyte loss, potentially acting in concert with intrinsic mitochondrial pathways(Reference Savino, Dardenne and Velloso31).
While the current study provides a comprehensive overview of overall undernutrition, it also presents a promising opportunity for future investigations. These studies could explore the specific roles of deficiencies in essential nutrients, such as proteins, Zn and vitamins, and epigenetic programming in thymocyte development and apoptotic pathways, paving the way for targeted dietary interventions to mitigate these effects and improve health outcomes. Studies have demonstrated the influence of maternal nutrition on fetal development(Reference Langley-Evans and Carrington32) and on the programming of altered immune responses during prenatal and postnatal life(Reference Ahmad33); however, studies on the effects of early-life malnutrition on immunological programming throughout life are lacking.
This study underscores the urgent need for therapeutic interventions to address the adverse effects of undernutrition on thymus function. Future studies should explore the potential of nutritional supplementation, immunomodulatory agents or strategies to enhance mitochondrial health, such as the use of silymarin, which is known to protect against oxidative stress and mitochondria and its ability to interfere with apoptotic signalling(Reference Patel, Joseph and Corcoran34), to mitigate the impact of undernutrition on immune function.
In brief, the findings demonstrate that undernutrition impairs thymus and thymocyte development, leading to thymic atrophy, compromised immune function and increased disease susceptibility. Mechanistic evidence includes elevated activation of caspase-8 and caspase-9, indicating extrinsic and intrinsic apoptosis, as well as decreased mitochondrial membrane potential. These results illustrate the importance of nutritional interventions and suggest that therapies targeting apoptosis pathways may mitigate the cellular and immunological effects of malnutrition.
Data availability statement
The data presented in this study are available from the corresponding author upon request.
Acknowledgements
The authors thank Dr Ana González-Gutiérrez for technical support in reviewing bilbiographic sources.
Author contributions
Edith Cortés-Barberena performed the experiments, analysed the data and wrote the manuscript; Donají López-Torres performed the investigation, methodology and formal analysis; Sara Frías and Humberto González-Márquez supervised the experiments and data analysis; and Rocío Ortiz-Muñiz designed and supervised the experiments, formal analysis and coordinated the laboratory work. All authors participated in the reading and review of the manuscript.
Financial support
The authors acknowledge the National Council of Science and Technology (CONAHCYT) for a postgraduate scholarship to DLT (233 533). The Universidad Autónoma Metropolitana Unidad Iztapalapa supported this study through agreement 3/84·22, approved on 21 December 2022, by the CBS Divisional Council.
Competing interests
The authors declare that they have no known competing financial interests or personal relationships that could have influenced the work reported in this paper.




 Open access

