Introduction
Oil crops are vital to global agriculture, providing essential raw materials for human nutrition, industrial applications and renewable energy production. Global oilseed output has expanded significantly in recent decades due to innovations in crop management, breeding and technology (Khan et al., Reference Khan, Awan, Yasin, Ramzan, Cheema and Jan2024). However, domestic oilseed production in Egypt remains insufficient, meeting less than 10% of the country’s demand (Ramadan, Reference Ramadan2017). Such low oilseed yields are attributable to several factors, including excessive diversification in oilseed farming and difficulties associated with low-fertility soils (Zohry and Ouda, Reference Zohry and Ouda2018). In Egypt, approximately 1.5 million ha of desert land have been reclaimed for agriculture since 1990, representing a critical strategy for food security in arid regions. Increasing oilseed production on newly reclaimed soils has become a national priority in addressing this difficulty. While promising for expansion, these soils present challenges due to their poor structure, low organic matter content and nutritional deficiencies. Introducing adaptable and high-yielding oilseed crops, together with improved agronomic practices, can significantly increase productivity and reduce reliance on imports (Sinha et al., Reference Sinha, Kumar, Sohane and Kumar2020).
Canola (B. napus L.) has acquired worldwide credibility as a high-value oilseed crop owing to its superior oil quality, high in unsaturated fatty acids and low in saturated fats (Chmielewska et al., Reference Chmielewska, Kozłowska, Rachwał, Wnukowski, Amarowicz, Nebesny and Rosicka-Kaczmarek2021). Canola oil’s particular composition makes it a popular cooking oil and a valuable feedstock in the biodiesel sector, adding greatly to renewable energy programs (Banaś et al., Reference Banaś, Piwowar and Harasym2023). Canola farming has grown globally due to its resilience to many climates and effective nutrient and water consumption, allowing it to thrive on marginal and reclaimed sites (Nelson et al., Reference Nelson, Nesi, Barrero, Fletcher, Greaves, Hughes, Laperche, Snowdon, Rebetzke and Kirkegaard2022; Panjabi et al., Reference Panjabi, Yadava, Kumar, Bangkim and Ramchiary2019). One key advantage of planting canola is its deep root system, which enhances efficient nutrient and water uptake. Its tolerance to moderate salinity and drought conditions makes it well-suited to growing in reclaimed soils. (Meena et al., Reference Meena, Meena, Shukla, Barman, Meena, Singh and Kumar2016). Despite these advantages, the potential of canola in Egypt remains underexplored, especially in optimising its nutrient requirements to achieve maximum yield and oil quality under reclaimed soil conditions. Research indicates that specific fertilisers can significantly enhance canola performance (Mohammadi and Rokhzadi, Reference Mohammadi and Rokhzadi2012).
Hence, for optimal crop yields and quality, it is essential to manage nutrients effectively, especially in challenging conditions such as newly reclaimed soils, where nutrients may be scarce. Magnesium is an important macronutrient for plant growth and development. It supports photosynthesis as a key component of chlorophyll and is involved in many physiological activities, such as the activation of enzymes and the metabolism of carbohydrates (Tränkner et al., Reference Tränkner, Tavakol and Jákli2018). Studies have indicated that a Mg deficit can considerably hinder the development and yield of oilseed crops, such as canola (Geng et al., Reference Geng, Cakmak, Ren, Lu and Lu2021; Geng et al., Reference Geng, Ye, Ren, Zhang, Li, Cong, Cakmak, Lu and Lu2024). Reduced biomass buildup, poor seed development and decreased seed oil content can result from low Mg levels (Meena et al., Reference Meena, Meena, Shukla, Barman, Meena, Singh and Kumar2016). According to research, for example, a magnesium deficit can reduce canola seed production by as much as 30%, highlighting the need for a sufficient Mg supply for the best crop performance (Guo et al., Reference Guo, Nazim, Liang and Yang2016). Recent developments have improved the availability and efficiency of nutrient absorption in Mg fertiliser formulations. Even in soils with limited nutrient-holding capacity, innovative solutions such as chelated Mg sulphate have been developed to treat shortages more effectively (Ahmed et al., Reference Ahmed, Zhang, Bozdar, Chachar, Rai, Li, Li, Hayat, Chachar and Tu2023). Additionally, it has been demonstrated that including Mg fertilisation in crop management techniques enhances oil quality by raising the amount of unsaturated fatty acids in canola oil (Sachan et al., Reference Sachan, Naimuddin, Patra, Subha, Senthilkumar, Chittibomma, Khan and Prasad2024). This enhances the oil’s nutritional profile and increases the crop’s value in commercial markets.
Zinc although required in smaller amounts, is an essential micronutrient that plays a crucial role in various plant metabolic processes (Nandal and Solanki, Reference Nandal and Solanki2021). It affects enzyme activity, protein synthesis and hormone balance, directly impacting crop growth and oil quality. Zn deficiency can cause poor development, reduced seed yield and lower oil content, emphasising its relevance in oilseed crop production (Halim et al., Reference Halim, Paul, Sarkar, Rashid, Perveen, Mia, Islam and Islam2023). As an illustration of how Zn may improve productivity in Zn-deficient soils, research on sunflower found that a 2.0% Zn foliar spray increased seed output by up to 81.4% and oil content by 43.2% when compared to untreated controls (Crista et al., Reference Crista, Radulov, Imbrea, Manea, Boldea, Gergen, Ienciu and Bănățean Dunea2023; Keerio et al., Reference Keerio, Soomro, Soomro, Siddiqui, Khan, Nizamani, Kandhro, Siddiqui, Khan and Soomro2020). Similarly, studies on oilseed rape showed that applying Zn boosted seed yields and oil quality, with improved physiological features, including photosynthetic rates and chlorophyll concentrations, playing a role in these results (Safdar et al., Reference Safdar, Qamar, Javed, Nadeem, Javeed, Farooq, Głowacka, Michałek, Alwahibi and Elshikh2023). Additionally, Zn-treated cotton plants produced greater seed oil, highlighting the adaptability of Zn administration for a range of oilseed species (Abdelwanis et al., Reference Abdelwanis, Hosni, Abdelhamid, Sulman, Ezoo and Saleh2022). Foliar treatment of Zn has effectively addressed micronutrient deficiencies, particularly in alkaline, calcareous and newly reclaimed soils where Zn availability is often limited (Riaz et al., Reference Riaz, Ayub, Khalid, ul Haq, Rasul, ur Rehman and Ali2020; Sánchez-Palacios et al., Reference Sánchez-Palacios, Henry, Penrose and Bell2023). Furthermore, other studies have demonstrated that foliar spray can improve stress tolerance and metabolic efficiency in oilseed crops, leading to higher yields and enhanced fatty acid profiles in the oil (Ashkiani et al., Reference Ashkiani, Sayfzadeh, Shirani Rad, Valadabadi and Hadidi Masouleh2020; Rad et al., Reference Rad, Ganj-Abadi, Jalili, Eyni-Nargeseh and Safavi Fard2021).
Recent studies on other crops highlighted that combining Zn foliar spraying and Mg fertilisation has significantly improved crop yield and nutrient profiles, especially in resource-constrained settings like newly reclaimed soils. According to recent studies, applying Zn and Mg together enhances plant physiological characteristics, including stomatal conductance and chlorophyll content, while increasing yields in various crops, including oilseeds. Applying plants with Zn and Mg significantly increased plant height and seed output in research on common beans, as increases of up to 80.6% in crop performance measures were documented compared to control treatments (Yeboah et al., Reference Yeboah, Asibuo, Oteng-Darko, Asamoah Adjei, Lamptey, Owusu Danquah, Waswa and Butare2021). Another study found that when Zn treatments are coupled with Mg fertilisation, the latter improves nutrient absorption and increases crops’ overall production and quality, such as wheat (Sadeghi et al., Reference Sadeghi, Rezeizad and Rahimi2021) and rice (He et al., Reference He, Wang, Hao, Wu and Liu2024).
This study investigated the combined effects of different soil-applied Mg fertilisers and Zn foliar applications on the growth, yield and oil quality of canola grown in the challenging conditions of newly reclaimed soils. While previous research has examined the roles of Mg and Zn in plant nutrition separately, few studies on canola have explored their combined effects, especially in oilseed crops. This study fills this gap by analysing the synergistic effects of these nutrients and their impact on canola. The results are expected to provide practical recommendations for increasing oilseed production in Egypt, reducing import dependence and promoting sustainable agricultural practices.
Materials and methods
Experimental site and conditions
Two field experiments were conducted during the successive growing seasons of 2021/2022 and 2022/2023 at the Experimental Farm of the Faculty of Agriculture, Al-Azhar University, Sadat City, Menofya Governorate, Egypt (30°35′N, 31°15′E, elevation 20 m above sea level). This investigation aimed to assess the response of canola cultivar Serw4 to varying rates of Mg fertilisation and Zn foliar applications, with emphasis on plant growth characteristics, yield performance and seed oil quality parameters under newly reclaimed soil conditions. Canola seeds (cultivar Serw4) were obtained from the Agricultural Research Centre, Ministry of Agriculture and Land Reclamation, Giza, Egypt. This cultivar was specifically selected for its adaptation to Egyptian growing conditions and tolerance to marginal soil conditions.
Soil analysis and weather conditions
Before the experiment began, soil samples were collected at a depth of 0–30 cm for physical and chemical analysis. The experimental site’s physical and chemical soil analysis were assessed according to Arnold’s standard methods and were presented in Table 1. Soil chemical analysis was conducted as follows: pH was determined in 1:2.5 soil: water suspension using a digital pH meter; electrical conductivity (EC) was measured in soil saturation extract; organic matter was determined by the Walkley-Black method; available phosphorus was extracted using sodium bicarbonate (Olsen method) and determined calorimetrically; exchangeable potassium was extracted with 1M ammonium acetate and analysed by flame photometry; available magnesium was extracted with 1M ammonium acetate and determined by atomic abs Soil available zinc was determined using DTPA (diethylenetriaminepentaacetic acid) extraction method followed by atomic absorption spectrophotometry (AAS) analysis. Available Zn (DTPA-extractable): 1.2 mg kg−1. Weather data, including monthly precipitation, temperature (maximum and minimum) and relative humidity during both growing seasons, were recorded from the nearest meteorological station (Figure 1).
Physical and chemical properties of the upper 50 cm of the experimental soil sites

CaCo3, calcium carbonate; OM, organic matter; EC, electrical conductivity; HCO3, bicarbonate; Cl, chlorine; So4, sulphate; Ca, calcium; Mg, magnesium; Na, sodium; K, potassium; N, nitrogen; P, phosphorus.
Climatic data for the canola growing seasons (2021/2022 and 2022/2023), showing monthly variations in relative humidity (%), maximum and minimum temperatures (°C) and precipitation (mm).

Experimental design and treatments
The experiment was laid out in a split-plot design with three replications. The main plots were assigned to Mg fertiliser rates (12, 2, 48 and 72 kg/ha), while sub-plots received Zn foliar applications at four levels: control (CK, water spray), 3, 5 and 6 g Zn/L. Magnesium was applied as magnesium sulphate heptahydrate (MgSO4·7H2O, containing 9.6% Mg, analytical grade, purity >99%) dissolved in irrigation water and applied through the drip irrigation system. Zinc was applied as zinc sulphate heptahydrate (ZnSO4·7H2O, containing 22% Zn, analytical grade, purity >99%) as a foliar spray. Each sub-plot measured 10.5 m2 (3 m width × 3.5 m length), consisting of 6 rows with 50 cm between rows and 20 cm between plants within the row. This spacing arrangement (50 cm × 20 cm) provides optimal plant density for canola cultivation, resulting in approximately 24 plants per row and 144 plants per sub-plot, equivalent to a population of approximately 137 plants per hectare.
Cultural practices
During both the 2021/2022 and 2022/2023 agricultural cycles, canola seeds were manually sown on November 15, after maize had been cultivated in the field. Seeds were sown in rows spaced 50 cm apart with 20 cm between hills. After the emergence, plants were thinned to maintain two plants per hill. Magnesium was applied as magnesium sulphate (MgSO4·7H2O, 9.6% Mg), split into three equal applications at 30 (early vegetative stage), 45 (stem elongation stage) and 60 (pre-flowering stage) days after sowing. Foliar applications of zinc sulphate (ZnSO4·7H2O, 22% Zn) were made at three concentrations using a knapsack sprayer, divided into two equal applications at 50 and 70 days after sowing. The experimental field was irrigated using a drip irrigation system throughout the growing season. Basic fertilisation included nitrogen (142.8 kg N/ha as ammonium nitrate 33.5% N), phosphorus (71.4 kg P2O5/ha, applied as 460.65 kg calcium superphosphate 15.5% P2O5) and potassium (57.1 kg K2O/ha, applied as 119 kg potassium sulphate 48% K2O), applied according to the Egyptian Ministry of Agriculture recommendations for canola production. All other agricultural practices, including pest management and weed control, were performed according to the standard recommendations for canola cultivation in newly reclaimed soils.
Data collection and measurements
Growth parameters
Ten representative plants were randomly selected from the middle ridge of each plot at the physiological maturity stage (when 60% of siliques turned from green to yellow-brown colour) to determine the following growth traits:
Plant height (PH, cm): measured from the soil surface to the terminal growing point of the main stem using a metric ruler.
Number of primary branches per plant (NB): the number of productive branches emerging from the main stem that bore pods. Secondary branches were not included in this count.
Yield components
At the same physiological maturity period mentioned above, ten representative plants were randomly selected from the middle ridge of each plot to measure the following yield-related traits:
Number of siliques per plant (NSP): The total number of siliques was counted for each selected plant, excluding aborted or poorly developed siliques.
1000-seed weight (TSW, g): A sample of 1000 seeds was taken from the harvested seeds of each plot and weighed using a precision electronic balance to determine the average weight.
Seed yield per hectare (SY, t/ha): The seed yield from each plot was collected, cleaned and weighed. The yield was then extrapolated to per ha using the plot area.
Biological yield (BY, t/ha): The total aboveground biomass (including seeds, siliques, stems and leaves) from each plot was harvested and weighed. The weight was then converted to tonnage per ha.
Oil content (%): It was determined using the Soxhlet extraction method according to the Association of Official Analytical Chemists protocol (Fletcher, Reference Fletcher1980). Seeds were ground to a fine powder, and the oil was extracted using petroleum ether (60–80°C boiling range) as a solvent. The extraction process was continued for 6 hours at solvent boiling temperature. After extraction, the solvent was evaporated, and the oil content was calculated gravimetrically and expressed as a percentage of seed dry weight using the following equation:
Oil content (%) = (Weight of extracted oil/Weight of seed sample) × 100
Oil yield (kg/ha): the seed yield was multiplied by the corresponding oil content percentage.
Oil quality parameters
Acid value was determined according to the standard method IUPAC (1987) described. The oil acid value (OAV) was measured using the standard methodology outlined by IUPAC’s 1987 standard procedure. The analysis was conducted using 2 g of oil samples, accurately weighed into 250 mL Erlenmeyer flasks. A mixture of ethanol and diethyl ether (1:1 v/v, 25 mL) was added to dissolve the oil, and the solution was then titrated against a standardised 0.1 N potassium hydroxide (KOH) solution using phenolphthalein as an indicator. The titration process continued until a permanent pink colour persisted for 30 seconds. The analysis was conducted as follows:
 $${\rm{Acid \; value \; }}\left( {{\rm{mg \; KOH/g \; oil}}} \right){\rm{ }} = {{{\rm{V\;}} \times {\rm{N\;}} \times 56.1} \over {\rm{W}}}.$$
where V = volume in ml of KOH solution in ml required for neutralisation, N = normality of KOH and W = weight of oil sample in grams.
Refractive index (ORI) was measured using an ABBE refractometer (Model WYA-2S, Shanghai Optical Instrument Factory, China). Measurements were conducted using an ABBE refractometer with a measurement range of 1.3000–1.7000 and a precision of ±0.0002. The instrument was calibrated using distilled water (nD20 = 1.3330) before each measurement session. All measurements were performed at a controlled temperature of 25°C. The instrument was calibrated with distilled water (refractive index = 1.3330), and measurements were recorded after allowing the samples to equilibrate to the specified temperature. Three replicate readings were taken for each sample to ensure measurement precision.
Data analysis
The obtained data were subjected to analysis of variance (ANOVA) according to Steel and Torrie (Reference Steel and Torrie1960), whereas the differences among treatment means were compared using Tukey’s Honestly Significant Difference (HSD) test at a 5% probability level (Abdi and Williams, Reference Abdi and Williams2010), using stats package in RStudio (Rahman et al., Reference Rahman, Abdulla and Moyazzem Hossain2024). A correlation heatmap was generated using the corrplot package, and a scatter plot was created with the ggplot2 package to illustrate relationships between traits. Path analysis was performed using lavaan package to assess direct effects on seed and oil yields. Line plots were developed with the ggplot2 package to examine the combined effects of Zn and Mg levels across two years.
Results
Climatic variations in canola growing seasons
The meteorological data for the canola growing seasons of 2021/2022 and 2022/2023 indicate variations in relative humidity, temperature and precipitation during the winter (Figure 1). In the initial months of the season (November and December), relative humidity in 2022/2023 was greater, with November recording 66.2% versus 63.8% in 2021/2022. The relative humidity gradually declined throughout the season, reaching its lowest point in May. This month, the relative humidity for 2022/2023 was slightly elevated at 51.2% compared to 47.8% for 2021/2022. Temperatures rose from November to May in both seasons. Maximum temperatures at the beginning of the 2022/2023 season were lower, recorded at 24.1°C in November, compared to 26.6°C in the previous season. Additionally, temperatures during April and May were also reduced, with readings of 33.8°C and 33.7°C, respectively, in contrast to 34.2°C and 35.2°C observed in 2021/2022. Minimum temperatures exhibited a comparable pattern, beginning at lower levels in 2022/2023 but converging by May (13°C in 2022/2023 compared to 12.7°C in 2021/2022).
Precipitation levels were low in both seasons, with a notable increase in 2022/2023 during critical early months. In November 2022/2023, rainfall measured 2.1 mm, an increase from 1.23 mm in November 2021/2022. January exhibited a comparable trend. Precipitation completely stopped in April and May for both seasons.
The 2022/2023 season exhibited elevated relative humidity and precipitation in the early stages, which enhanced moisture conditions for crop establishment, while the 2021/2022 season experienced elevated temperatures in its later stages.
Analysis of variance for seasonal effects of Mg and Zn applications on studied traits
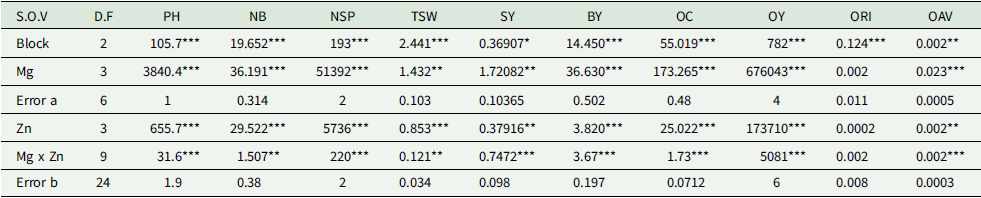
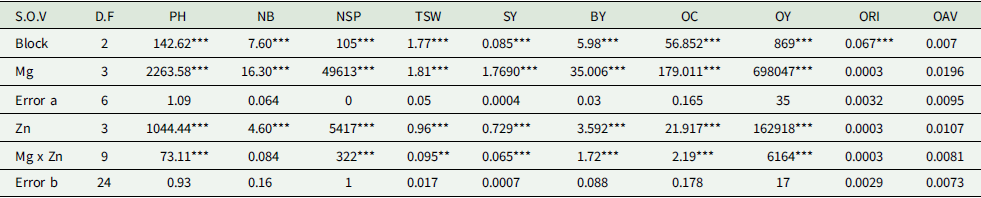
The analysis of variance (ANOVA) for ten growth, yield and quality traits of canola plants across two growing seasons revealed significant effects of Mg, Zn and their interaction, as shown in Tables 2 and 3. In both seasons, applying Mg and Zn had a significant effect on most plant characteristics (P < 0.001). The OAV was significant only in the first season, while the ORI did not demonstrate any statistically significant variation (P > 0.05) across both growing seasons. The interaction between Mg and Zn demonstrated significant effects (P < 0.001) on critical traits, including PH, NSP and OY. The interaction between Mg and Zn for OAV was significant in the first season; however, its effect on ORI was statistically non-significant in both growing seasons. The findings demonstrate the complex relationship between magnesium and zinc in affecting canola plant growth and productivity, highlighting the nuanced role of micronutrient interactions in agricultural systems.
ANOVA for growth parameters, yield components, oil yield and quality traits of canola as influenced by different levels of Zinc (Zn) and Magnesium (Mg) in the first growing season

*, **, *** Significant at P ≤ 0.05, 0.01 and 0.001, respectively. Error a: Main plot error (Block × Mg effect), Error b: Sub-plot error (Block × Mg × Zn interaction effects). PH: Plant Height, NB: Number of Branches, NSP: Number of Siliqua per Plant, TSW: Thousand Seed Weight, SY: Seed Yield, BY: Biological Yield, OC: Oil Content, OY: Oil Yield, ORI: Oil Relative Index, OAV: Oil Acid Value.
ANOVA for growth parameters, yield components and oil yield and quality traits of canola as influenced by different levels of Zinc (Zn) and Magnesium (Mg) in the second growing season

*, **, *** Significant at P ≤ 0.05, 0.01 and 0.001, respectively. Error a: Main plot error (Block × Mg effect), Error b: Sub-plot error (Block × Mg × Zn interaction effects). PH: Plant Height, NB: Number of Branches, NSP: Number of Siliqua per Plant, TSW: Thousand Seed Weight, SY: Seed Yield, BY: Biological Yield, OC: Oil Content, OY: Oil Yield, ORI: Oil Relative Index, OAV: Oil Acid Value.
Comparison of means for growth, yield and oil characteristics under various Mg and Zn levels
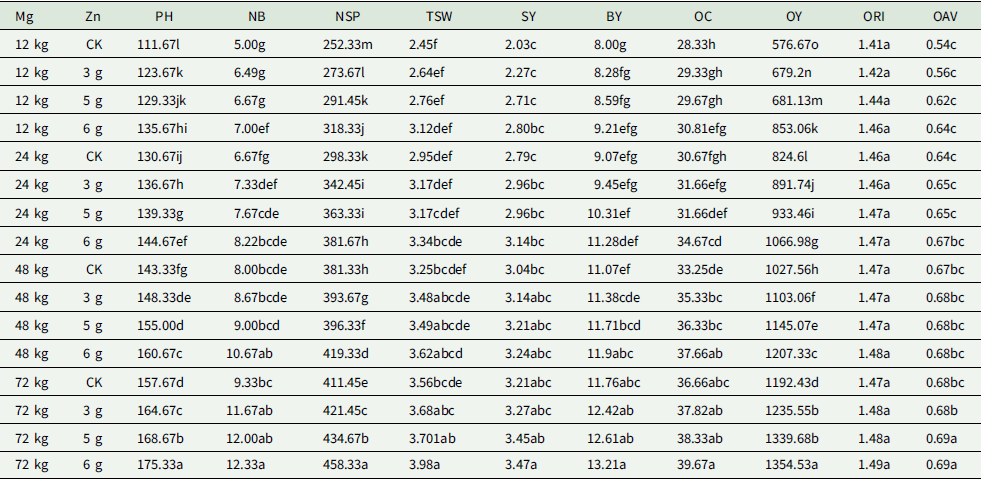
The comparisons among the means of studied traits affected by different combined levels of Mg and Zn revealed significant differences across all measured parameters in the first season. (Table 4). For PH, the increasing levels of Mg and Zn applications resulted in a consistent increase, with the maximum height (175 cm) observed at 72 kg Mg/ha combined with 6 g/L Zn. This increased by 56.9 % over the control treatment (111cm). Similarly, NB showed significant improvement, with the highest value (12.3) recorded under the same treatment combination (72 kg Mg/ha combined with 6 g/L Zn), compared to the minimum value (5.0) observed in the CK. Levels of NSP followed a notable positive trend, ranging from 252 in control to 458 in plots treated with 72 kg Mg/ha + 6 g/L Zn. Also, TSW increased in response to the treatments, with values ranging from 2.45 g in control to 3.98 g under the highest Mg and Zn combination. For SY, there was a marked increase with higher nutrient applications, ranging from 2.03 t/ha in control to 3.47 t/ha at the highest treatment level (72 kg Mg/ha + 6 g/L Zn), representing a 70.9% increase. Similarly, BY exhibited significant growth, increasing from 8.0 t/ha in control to 13.2 t/ha under the highest treatment combination, highlighting the positive impact of Mg and Zn on overall biomass production.
Combined Effects of Zinc (Zn) and Magnesium (Mg) Levels on Agronomic and Oil Quality Traits in the First Season

Means followed by the different letters within a column are significantly different at p ≤ 0.05. PH, plant height; NB, number of branches; NSP, number of siliquae per plant; TSW, total siliqua weight; SY, seed yield; BY, biological yield; OC, oil content; OY, oil yield; ORI, oil refractive index; OAV, oil acid value.
There were incremental but significant improvements in OC levels, increasing from 28.3% in control to 39.6% at the highest Mg and Zn treatment levels. The most dramatic response was shown by OY, with values rising from 576.7 kg/ha in control to 1354 kg/ha under the highest treatment, reflecting a 134% increase. Oil quality parameters, including ORI and OAV, also showed slight enhancements with increasing nutrient levels, ranging from 1.41 to 1.49 and 0.54 to 0.69, respectively.
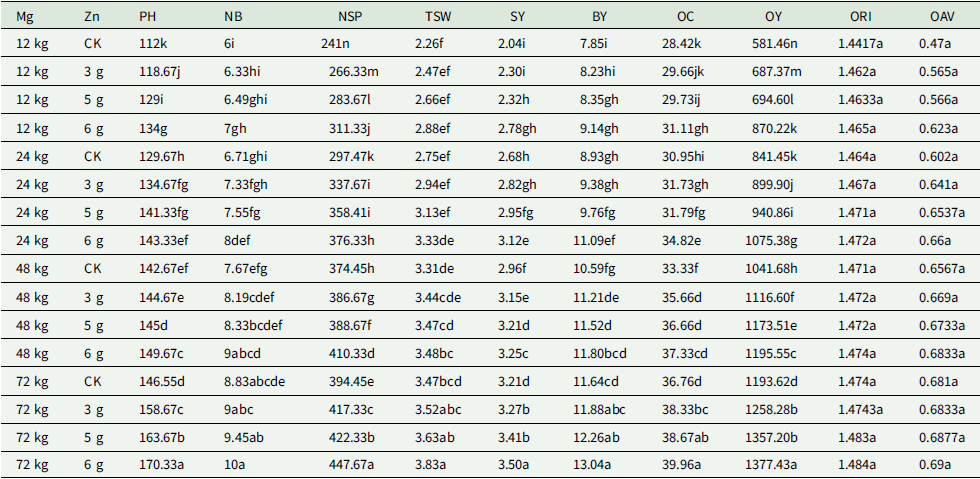
During the second season (Table 5), distinct trends emerged across most measured parameters in response to increasing levels of Mg and Zn application. Levels of PH showed a consistent upward trend, reaching a maximum of 170 cm with the application of 72 kg Mg/ha and 6 g/L Zn, which marked a 52.1% increase over the control treatment (112 cm). NB also improved significantly, with the highest value of 10.0 observed under the same treatment combination, compared to the minimum value of 6.0 in the control. A strong positive trend was noted for NSP, which increased from 241 in control to 447 under the highest Mg and Zn application rates. Similarly, TSW rose from 2.26 g in control to 3.83 g under the highest treatment combination, suggesting enhanced seed development facilitated by nutrient enrichment. SY demonstrated a substantial response, increasing from 2.04 t/ha in control to 3.50 t/ha at the highest nutrient level, representing a 71.6% improvement. BY exhibited a comparable pattern, rising from 7.85 t/ha in control to 13.1 t/ha, highlighting the significant role of Mg and Zn in boosting overall biomass accumulation.
Combined Effects of Zinc (Zn) and Magnesium (Mg) Levels on Agronomic and Oil Quality Traits in the Second Season

PH, plant height; NB, number of branches; NSP, number of siliquae per plant; TSW, total siliqua weight; SY, seed yield; BY, biological yield; OC, oil content; OY, oil yield; ORI, oil refractive index; OAV, oil acid value. Means followed by the different letters within a column significantly differ at p ≤ 0.05.
The levels of OC improved progressively with nutrient application, ranging from 28.4% in control to 39.9% at the highest treatment level. The most pronounced enhancement was observed in OY, which increased by 137%, from 581 kg/ha in control to 1377 kg/ha under the highest Mg and Zn combination. Moreover, oil quality parameters, including ORI and OAV, exhibited modest improvements, with ORI ranging from 1.44 to 1.48 and OAV increasing from 0.47 to 0.68 as nutrient levels rose.
Synergistic effects of Mg and Zn on growth, yield and oil quality parameters averaged across two growing seasons
The effects of the combined application of Mg and Zn on all measured parameters averaged over the two growing seasons of the study are shown in Figure 2a. The response patterns varied among traits. Generally, they showed positive synergistic effects with increasing nutrient levels. PH levels consistently increased with higher nutrient combinations, reaching maximum values at 72 kg Mg/ha combined with 6 g/L Zn. Similarly, NB exhibited a positive response, with the highest values (approximately 11 branches) observed at 72 kg Mg/ha with 5–6 g/L Zn. Also, a remarkable response of NSP to nutrient combinations was recorded, with values increasing from about 250 siliques plant−1 in CK treatment to over 450 siliques plant−1 at the highest nutrient levels. For TSW, moderate improvements ranged from 2.5 to 4.0 g across treatments, with optimal responses at 48–72 kg Mg/ha combined with 5–6 g/L Zn. A strong positive response of BY to increasing nutrient levels was exhibited, with values ranging from approximately 8 t/ha in CK treatment to 12 t/ha at the highest nutrient combination. Similarly, SY followed a similar pattern to BY, showing maximal values (>3.3 t/ha) at higher nutrient combinations, particularly with 48 kg Mg/ha and 5 g/L Zn applications.
Synergistic effects of Mg and Zn applications on agronomic and oil quality parameters (averaged across two growing seasons). (a) The curves indicate the relationship between different Zn levels (CK, 3, 5 and 6 g/L) and four Mg levels (12, 24, 48 and 72 kg/ha). Biological yield (BY, t/ha), number of branches (NB), number of siliques per plant (NSP), oil acid value (OAV), oil content (OC, %), oil refractive index (ORI), oil yield (OY, kg/ha), plant height (PH, cm), seed yield (SY, t/ha) and 1000-seed weight (TSW, g). Error bars represent standard errors of the means. Different-coloured lines represent different Mg application rates, while the x-axis indicates Zn treatment levels. (b) Principal component analysis (PCA) biplot showing the relationships among measured traits and the distribution of different treatment combinations. PC1 and PC2 represented 79.2% and 11.5% of the total variation, respectively. Vectors represent the direction and magnitude of trait contributions to the principal components, while the angles between vectors indicate the degree of correlation between traits.

For oil parameters, OC showed significant improvements with increasing nutrient levels, reaching maximum values (>38%) at 48 kg Mg/ha combined with 6 g/L Zn. This was consequently translated into substantially higher OY, which peaked at levels > 1190 kg/ha under optimal nutrient combinations. Regarding oil quality parameters, OAV exhibited a considerable variation in response to the treatments, with most treatment combinations maintaining relatively stable values except for the CK treatment, which shows a distinctive peak before dropping significantly. Unlike other oil quality parameters, ORI values showed considerable overlap between treatments with no clear superior treatment combination. All treatments started at relatively similar values (around 1.45–1.50) but showed different response patterns across Zn levels.
Principal component analysis (PCA) was employed to elucidate the multivariate relationships between agronomic traits and Mg and Zn fertilisation regimes (Figure 2b). The first two principal components (PCs) accounted for a cumulative variance of 90.7%, with PC1 explaining 79.2% and PC2 contributing 11.5% of the total variation. PC1 exhibited robust positive correlations with all measured agronomic traits: ORI, PH, NSP, OC, NB, SY, BY, OY and TSW. The biplot visualisation revealed distinct clustering patterns among treatment combinations. The CK treatments were distinctly segregated in the upper left quadrant, indicating significantly different responses compared to nutrient-supplemented treatments. Higher Mg and Zn applications demonstrated a pronounced rightward shift along PC1, suggesting enhanced agronomic performance. Treatment differentiation was particularly evident with increasing nutrient concentrations, where higher Mg (48–72 kg/ha) and elevated Zn levels (5–6 g/L) clustered toward the positive axis of PC1, demonstrating synergistic effects on crop performance metrics. This pattern suggests that optimal nutrient management strategies may require a balanced application of both Mg and Zn to maximise canola cultivation agricultural productivity.
Trait associations and path analysis
The interrelationships among measured traits and their direct and indirect effects on SY and OY were investigated through correlation and path coefficient analysis, as shown in Figure 3. The correlation heatmap revealed distinct patterns of association among the studied traits (Figure 3a). The findings showed that ORI exhibited predominantly negative correlations with most traits, particularly showing a strong negative association with oil acid value (OAV). Also, TSW showed moderate positive correlations with yield-related traits (SY, BY, NB, OC). Other findings showed that BY demonstrated substantial positive correlations with NB, OC and PH, suggesting that plants with higher biomass tend to develop more branches and accumulate more oil. NSP showed strong positive correlations with SY and OY, indicating that plants producing more siliques generally produce higher seed and oil. TSW displayed positive associations with BY, suggesting that plants with greater biomass tend to produce heavier seeds. PH showed moderate positive correlations across most traits, indicating that taller plants performed better across multiple yield-related parameters. Oil parameters such as OAV exhibited moderate positive correlations with several characteristics, including TSW, BY and OC, suggesting that these yield-related traits might influence oil quality parameters.
Interrelationships and path analysis of agronomic and quality traits under magnesium and Zn applications. (a) Correlation heatmap showing the strength and direction of relationships among traits: Plant height (PH), number of branches (NB), number of siliques per plant (NSP), 1000-seed weight (TSW), seed yield (SY), biological yield (BY), oil content (OC), oil yield (OY), oil refractive index (ORI) and oil acid value (OAV). Colour intensity indicates correlation strength, with yellow representing strong positive correlations and purple indicating negative correlations. (b) Path analysis diagram illustrating direct effects (represented by arrow thickness and coefficients in red) of key predictor traits on SY and OY. The thicker arrows and higher coefficient values indicate stronger direct effects, with values significant at p < 0.05 (*) and p < 0.01 (**).

Path coefficient analysis was conducted to further explore these interrelationships of the studied traits on two response variables, SY and OY (Figure 3b). The results indicated complex causal relationships affecting both SY and OY. For the effects of the causal variables on the response variable SY, NSP exhibited the strongest direct effect (0.58**) on SY, followed by BY, which showed substantial positive direct influence (0.21*). NB demonstrated a moderate direct effect (0.17*), indicating the importance of the branching pattern in determining final seed yield. The cumulative effect of these traits suggests that plants with higher NSP, supported by adequate BY and NB, were most likely to achieve superior seed yields. For the effects of predictor variables on the response variable OY, the path analysis revealed a more complex network of relationships. For instance, OC displayed the strongest direct effect (0.56**) on OY, followed by NSP, which showed substantial positive direct influence (0.50**). In contrast, BY contributed significantly with a negative direct effect on OY (−0.28*).
Association analysis of yield components and oil-related traits under Zn and Mg levels
Trait associations under varying Zn concentrations
The pairwise correlation analysis revealed complex interrelationships among SY, BY, OC, OY and OAV across different Zn concentrations (Figure 4). Strong positive correlations were observed across multiple trait combinations at the CK treatment. Notably, BY and OC exhibited an exceptionally strong correlation (R = 0.93, p < 9.1 × 10⁻⁶), indicating a robust relationship between total plant biomass and oil content under basal conditions. SY and OAV also demonstrated a significant positive correlation (R = 0.83, p = 0.0008). The 3 g/L Zn treatment induced substantial modifications in trait associations. The most remarkable correlation was between SY and OY, reaching a near-perfect positive correlation (R = 0.96, p < 3.9 × 10⁻⁷), indicating that Zn application at this concentration substantially enhanced the relationship between seed production and oil yield. Similarly, SY and OC showed a strong positive correlation (R = 0.90, p < 6.8 × 10⁻⁵).
Bivariate scatter plot matrix illustrating correlations between agronomic and oil-quality traits under different Zn foliar application rates. The relationships between Seed Yield (SY), Biological Yield (BY), Oil Content (OC), Oil Yield (OY), Oil acid value (OAV) and oil refractive index (ORI) are displayed across different Zn treatments. A distinct colour represents each Zn treatment level: Control/0 g/l (purple dots and regression line), 3 g/l (red dots and regression line), 5 g/l (blue dots and regression line) and 6 g/l (green dots and regression line). Each panel displays corresponding correlation coefficients (R) with a p-value at the top, colour-coded to match their respective Zn treatment levels.

At the 5 g/L Zn concentration, trait associations reached their peak. The pairwise relationship of SY-OY achieved its strongest correlation (R = 0.98, p < 5.3 × 10⁻⁸), representing an almost perfect linear relationship between seed yield and oil production. Correspondingly, SY and OC exhibited an extremely strong correlation (R = 0.95, p < 2.7 × 10⁻⁶), indicating optimal interaction between biomass production and oil accumulation at this Zn level. The 6 g/L Zn treatment showed a slight decline in correlation strengths compared to the 5 g/L treatment, though associations remained significantly positive. The pairwise association of SY-OY remained strong (R = 0.90, p < 7.1 × 10⁻⁵), while some trait relationships showed moderate reductions.
Interestingly, OAV displayed more variable correlations across Zn levels. At the CK level and lower Zn concentrations, OAV maintained moderate positive correlations with SY and BY. However, these correlations generally weakened at higher Zn levels, indicating that Zn application might modulate oil acid value dynamics. Conversely, negative associations were also predominantly observed involving OAV, particularly about OC. Furthermore, ORI presented the most variable correlation patterns, often demonstrating non-significant relationships. Overall, these observed variations in trait correlations across Zn concentrations underscore the complex physiological responses of crops to Zn foliar application. The data suggests an optimal Zn concentration of around 5 g/L, where trait associations achieve maximum coherence and potential synergistic effects on crop productivity and oil quality.
Trait associations under varying Mg concentrations
The correlation analysis revealed significant associations among key studied traits under varying Mg application rates (Figure 5). The pairwise correlation analysis revealed complex interrelationships among SY, BY, OC, OY, OAV and ORI across different Mg application rates, highlighting the nuanced effects of Mg fertilisation on crop physiological parameters. At the 12 kg Mg level, exceptionally strong correlations were observed. The most striking relationship was between SY and OY, achieving an almost perfect positive correlation (R = 0.98, p < 2.4 × 10⁻⁸), suggesting an optimal synchronisation between seed production and oil yield at this Mg rate. Simultaneously, BY and OC demonstrated a robust correlation (R = 0.89, p < 0.001), indicating a strong relationship between total biomass and oil content. The 24 kg Mg treatment revealed more moderate correlation patterns. BY and OC showed a particularly strong association (R = 0.93, p < 8.2 × 10⁻⁶), while SY-OC and OY-OAV relationships were comparatively weaker. The more modest correlations at this level suggest a potential transitional phase in crop nutrient response.
Bivariate scatter plot matrix showing correlations between agronomic and oil-quality traits under different magnesium (Mg) fertilisation rates. The relationships between seed yield (SY), biological yield (BY), oil content (OC), oil yield (OY), oil acid value (OAV) and oil refractive index (ORI) are displayed across different Mg treatments. Each Mg treatment level is represented by a distinct colour: 12 kg Mg/ha (purple dots and regression line), 24 kg Mg/ha (red dots and regression line), 48 kg Mg/ha (blue dots and regression line) and 72 kg Mg/ha (green dots and regression line). Each correlation is accompanied by its corresponding correlation coefficient (R) and P-value displayed at the top of each panel, colour-coded to match their respective Mg treatment levels.

At the 48 kg Mg concentration, trait associations maintained strong positive correlations. BY and OC exhibited a near-perfect correlation (R = 0.94, p < 6.2 × 10⁻⁶), and the SY-OY relationship remained significantly positive (R = 0.89, p < 0.001). This indicates a continued optimisation of biomass production and oil accumulation. The 72kg Mg treatment demonstrated some of the most remarkable correlations, particularly for BY and OC (R = 0.97, p < 1 × 10⁻⁷), representing an almost deterministic relationship between biomass and oil content. The SY-OY correlation remained strong (R = 0.90, p < 7.8 × 10⁻⁵), though slightly reduced compared to the 12 kg treatment.
Discussion
This study examined the dynamics of Mg and Zn nutrients in canola, emphasising seasonal variations and interactions that influence crop productivity and quality. Previous research has demonstrated varied responses to administering both macronutrients and micronutrients, with our findings corroborating and contesting the current study.
The synergistic effects of Mg and Zn observed in this study can be attributed to their complementary roles in essential metabolic pathways, confirming the theoretical framework proposed by Soliman et al. (Reference Soliman, Elsherpiny and Elmahdy2024) regarding nutrient interactions in canola agriculture. Our findings align with Broadley et al. (Reference Broadley, Hammond, King, Astley, Bowen, Meacham, Mead, Pink, Teakle and Hayden2008), who demonstrated that micronutrient combinations often produce non-additive effects on plant performance. However, our study provides mechanistic detail previously lacking in the literature. Magnesium serves as the central atom in chlorophyll molecules and acts as a cofactor for numerous enzymes involved in photosynthesis, including RuBisCO activase and phosphoenolpyruvate carboxylase. Simultaneously, Zn functions as a structural component of carbonic anhydrase, which facilitates CO2 fixation, and as a cofactor in RNA polymerase, essential for protein synthesis. The combined application of 72 kg Mg/ha with 6 g/L Zn resulted in a 56.9% increase in plant height, mechanistically explained by enhanced photosynthetic efficiency leading to increased carbon assimilation and subsequent allocation to structural growth. This magnitude of response exceeds the 35–40% height increases reported by Almutairi et al. (Reference Almutairi, Alharbi, Abdelaziz and Mosa2024) using individual nutrient applications, supporting our hypothesis of synergistic interactions. The significant improvement in number of branches (NB) under optimal Mg-Zn treatment reflects enhanced apical dominance regulation, corroborating findings by Mumivand et al. (Reference Mumivand, Khanizadeh, Morshedloo, Sierka, Żuk-Gołaszewska, Horaczek and Kalaji2021) who reported similar branching responses to micronutrient treatments. Our mechanistic explanation extends their work: Zn plays a crucial role in auxin metabolism, particularly in the biosynthesis and transport of indole-3-acetic acid (IAA), while Mg influences cytokinin activity through its role in adenosyl transferase enzymes. This hormonal interplay promotes lateral bud break and subsequent branch development, creating more reproductive sites and ultimately contributing to yield enhancement. This mechanism was previously hypothesised but not experimentally demonstrated in canola systems.
The seasonal variability observed in Mg-Zn interactions reflects temperature-dependent changes in nutrient uptake kinetics and metabolic enzyme activity, confirming the environmental dependency reported (Abdelwanis et al., Reference Abdelwanis, Hosni, Abdelhamid, Sulman, Ezoo and Saleh2022; Broadley et al., Reference Broadley, Hammond, King, Astley, Bowen, Meacham, Mead, Pink, Teakle and Hayden2008; El-Azeiz and Hamdy, Reference Abd El-Azeiz2023; El-Dissoky et al., Reference El-Dissoky, Al-Kamar and Derar2017). Our findings extend previous work by Ahmed et al. (Reference Ahmed, Zhang, Bozdar, Chachar, Rai, Li, Li, Hayat, Chachar and Tu2023), who observed synergistic effects during high-yielding periods and antagonistic effects during stress periods, but without mechanistic explanation. During high-yielding periods, elevated temperatures increase enzyme activity and nutrient transport rates, facilitating synergistic effects. Conversely, during stress periods, competition for transport proteins and energy resources may create antagonistic interactions. The temperature sensitivity of Mg2+ uptake transporters (MGT family) and Zn2+ transporters (ZIP family) explain why optimal fertilisation strategies must account for seasonal variations. This mechanistic understanding addresses the gap identified by Sajid et al. (Reference Sajid, Haq, Jan, Noor, Ali, Alam, Zaman, Shah, Mosa and Abada2022), who noted seasonal effects without explaining the underlying physiological basis. Environmental factors further modulate nutrient efficacy through their effects on root morphology and soil chemistry, consistent with findings by Abdelghany et al. (Reference Abdelghany, Lamlom and Naser2024) and Ali et al. (Reference Ali, Hussain, Jalal, Khan, Imtiaz, Said, Ismail, Khan, Ali and Hatamleh2023). However, our study provides new insights into the specific mechanisms involved. Soil moisture affects the dissolution and mobility of Mg and Zn, while pH variations influence their availability through changes in ion speciation. The formation of Mg-phosphate and Zn-phosphate complexes under alkaline conditions reduces bioavailability, explaining the variable responses observed across different environmental conditions reported by Ashkiani et al. (Reference Ashkiani, Sayfzadeh, Shirani Rad, Valadabadi and Hadidi Masouleh2020) and Aslam et al. (Reference Aslam, Farhat, Siddiqui, Yasmeen, Khan, Sial and Khan2021).
The notable improvements in SY and BY highlight the beneficial effects of Mg and Zn on canola productivity. The observed increase of 70.9% in SY at the highest treatment levels is particularly noteworthy. This indicates that the combined effects of Mg and Zn improve specific plant characteristics and significantly enhance yield attributes. Previous research has consistently shown that these nutrients are crucial for improving crop yields by supporting essential physiological functions, including photosynthesis and nutrient uptake (Umair Hassan et al., Reference Umair Hassan, Aamer, Umer Chattha, Haiying, Shahzad, Barbanti, Nawaz, Rasheed, Afzal, Liu and Guoqin2020). The current investigation demonstrates that higher nutrient applications significantly increase OC and OY, with an approximately 134.9% rise in OY indicating that optimal Mg and Zn levels can substantially enhance oil production. This finding aligns with existing literature suggesting that these nutrients are essential for oil biosynthesis pathways in plants (Zhang et al., Reference Zhang, Abdelghany, Azam, Qi, Li, Feng, Liu, Feng, Ma and Gebregziabher2023). Such findings reveal that Mg and Zn enhance the quantity and quality of oil produced. Oil quality is a significant factor influencing the market value of canola, with research demonstrating that effective micronutrient management improves oil quality parameters, including acidity and refractive index, which are critical for consumer acceptance and processing efficiency (Al-Saif et al., Reference Al-Saif, Sas-Paszt, Saad, Abada, Ayoub and Mosa2023; Almutairi et al., Reference Almutairi, Sas-Paszt and Mosa2024; Abd El-Azeiz, Reference Abd El-Azeiz2023).
The correlation analysis in this investigation reveals clear patterns of trait associations. The moderate positive correlations between TSW and yield-related traits, including SY, BY, NB and OC, align with previous research showing that TSW significantly influences seed yield under varying environmental conditions (Rajković et al., Reference Rajković, Marjanović Jeromela, Pezo, Lončar, Zanetti, Monti and Kondić Špika2021; Sabaghnia et al., Reference Sabaghnia, Dehghani, Alizadeh and Mohghaddam2010). BY showed significant positive correlations with NB and OC, suggesting that plants with increased biomass will likely produce more branches and accumulate greater oil content. Furthermore, the NSP exhibited strong positive correlations with both SY and OY, indicating that an increase in silique production typically results in enhanced seed and oil production. The observed moderate positive correlations of PH with various traits suggest that taller plants generally exhibit superior performance in yield-related attributes (Rajković et al., Reference Rajković, Marjanović Jeromela, Pezo, Lončar, Zanetti, Monti and Kondić Špika2021). In contrast, ORI showed predominantly negative correlations with most traits, with a particularly significant negative association with OAV, suggesting a potential link between higher ORI and reduced oil quality.
The path coefficient analysis of canola traits elucidates the complex interrelationships among agronomic characteristics and their impacts on SY and OY. This analysis is crucial for comprehending the contribution of various traits to overall seed and oil yield performance and can inform breeding strategies. NSP emerged as the most influential predictor for the response variable SY, highlighting its critical role in boosting seed yield due to its direct correlation with the number of seeds produced. This is consistent with prior research showing that canola plants exhibit greater reproductive success when biomass is increased (Santiago et al., Reference Santiago, Pimentel, Bruzi, Martins, Hein, Lima and Pereira2022). Also, NB exhibited a moderate direct effect, highlighting the significance of branching patterns in optimising seed yield. The combined influence of these traits indicates that canola plants with elevated NSP, in conjunction with sufficient NB, are more likely to attain enhanced seed yields. This relationship aligns with findings from other studies that emphasise the importance of branching and silique production in influencing yield outcomes (Asfour, Reference Asfour2013). Similarly, path analysis revealed a complex network of relationships influencing OY, with OC showing the most significant direct effect. This underscores the importance of increased seed oil content in optimising oil yield. This finding is important for breeding programmes to enhance oil quality and quantity in canola plants (Santiago et al., Reference Santiago, Pimentel, Bruzi, Martins, Hein, Lima and Pereira2022). Furthermore, NSP demonstrated a significant positive direct effect on OY, underscoring its dual function in seed and oil production. It is important to note that BY negatively affected OY (−0.28*). This finding indicates that although biomass contributes positively to seed yield, it may not necessarily enhance oil yield, potentially due to trade-offs in resource allocation between vegetative growth and oil production (Asfour, Reference Asfour2013). This complexity highlights the necessity for a sophisticated strategy to select traits for breeding objectives.
The current study demonstrated that the relationship between the examined traits varied with the foliar application of zinc at different concentrations. This study’s robust and positive correlations among SY, OY and OC at optimal Zn levels indicate a synergistic relationship that can improve crop yields’ quantity and quality. Identifying an optimal foliar Zn concentration, specifically 5 g/L, is essential for maximising seed and oil yields. This concentration promotes improved nutrient absorption and metabolic activities critical for oil production. This is especially important for oilseed crops, as yield and oil quality are essential for market competitiveness. Furthermore, optimising these traits via the foliar application of Zn may enhance the nutritional profiles of harvested products, meeting consumer demands for healthier food options (Lamlom et al., Reference Lamlom, Abdelghany, Ren, Ali, Usman, Shaghaleh, Hamoud and El-Sorady2024). Research indicates that the Zn application improves oil quality by optimising fatty acid profiles, which is essential for compliance with market standards (Açık and Öncan Sümer, Reference Açık and Öncan Sümer2023; Han et al., Reference Han, Sönmez, Qureshi, Güden, Gangurde and Yol2024). Recent studies indicate that appropriate Zn application enhances yield and improves plant health under various stress conditions, reinforcing its essential role in contemporary agriculture (Khan et al., Reference Khan, Akram, Moonmoon, Tarafder, Rahman, Das, Skalicka, Skalicky and Hossain2023; Safdar et al., Reference Safdar, Qamar, Javed, Nadeem, Javeed, Farooq, Głowacka, Michałek, Alwahibi and Elshikh2023). Interestingly, the correlation between OAV and other parameters under increased Zn concentrations highlights the importance of accurate nutrient management. This can indicate that excessive application of Zn can interfere with metabolic pathways related to fatty acid synthesis. This underscores the significance of customised fertilisation approaches that consider both yield potential and the biochemical composition of crops.
Similarly, the relationship between the growth, yield and quality parameters of canola varied noticeably, depending on the levels of Mg application. These findings align with emerging research highlighting the pivotal role of precise management of nutrients in optimising oilseed crop potential (Arabhanvi et al., Reference Arabhanvi, Pujar and Hulihalli2015). The most notable observation is the fluctuation in correlation strengths across Mg application rates, suggesting a dynamic nutritional response mechanism. We observed a noteworthy association between yield and oil parameters at lower to moderate Mg levels, indicating an optimal nutrient utilisation scenario. It means that the application of Mg has a rapidly decreasing marginal utility, which is crucial for precise agricultural management. This supports oilseed crop nutrient usage efficiency research that challenges the linear nutrient response agronomic paradigm. This remarkable finding is significant and needed in canola production, where oil quality and seed yield are paramount economic and agronomic considerations (Geng et al., Reference Geng, Cakmak, Ren, Lu and Lu2021). Such correlations suggest that Mg plays a crucial role beyond mere nutritional supplementation, potentially influencing key metabolic pathways related to photosynthesis, enzyme activation and oil biosynthesis (Kirkby and Mengel, Reference Kirkby and Mengel1976). This strategy is necessary to understand the complex biochemical and metabolic pathways of nutrient absorption, translocation and utilisation in canola production systems.
Conclusion
Our two-year field study demonstrated that combined Mg and Zn applications significantly enhanced canola performance in reclaimed soils. The optimal treatment combination (72 kg Mg/ha + 6 g/L Zn) achieved remarkable improvements: 70.9% increase in seed yield (from 2.03 to 3.47 t/ha), 134 % enhancement in oil yield (from 576.67 to 1354 kg/ha) and substantial improvements in plant morphological characteristics. Principal component analysis revealed that 90.7% of variance was explained by nutrient applications, with path analysis identifying number of siliques per plant (direct effect: 0.58) and oil content (direct effect: 0.56) as primary yield determinants. Future research should focus on long-term sustainability assessment including soil health indicators and nutrient cycling; economic analysis incorporating input costs, yield benefits and market premiums for quality; mechanistic studies investigating enzyme activities, gene expression and metabolic pathways underlying Mg-Zn synergisms and integration with other sustainable practices (cover cropping, organic amendments) for holistic soil management.
Acknowledgements
Not applicable.
Author contributions
Conceptualisation, A.A.S.; methodology, F.A.; validation, A.M.A.; formal analysis, S.F.L.; investigation, M.D.; data curation, A.M.A. writing–original draft preparation, S.F.L., E.SH. and A.M.A.; writing–review and editing, A.M.A. S.F.L. and M.D. supervision, S.F.L. and A.M.A.; project administration, S.F.L. All authors have read and agreed to the published version of the manuscript.
Funding statement
Not applicable.
Competing interests
The authors declare no conflicts of interest.
Ethical standards
Not applicable.
Informed consent statement
Not applicable.
Data availability statement
The original contributions presented in this study are included in the article. Further enquiries can be directed to the corresponding author(s).