





Introduction
Western Amazonia is characterized by chronically low availability of bioaccessible sodium, despite substantial inputs of Andean-derived sediments into soil formation (Dudley et al. Reference Dudley, Kaspari and Yanoviak2012; Stallard and Edmond Reference Stallard and Edmond1983). This is partly due to the high solubility of sodium, which is readily leached from soils by heavy tropical rainfall, resulting in limited long-term retention (McClain and Naiman Reference McClain and Naiman2008). The region’s hydrology and geography further constrain sodium input. Atlantic-derived marine salts transported upriver are progressively diluted with increasing distance inland, while atmospheric inputs from Pacific sea-salt aerosols are negligible due to the Andean mountain range functioning as a barrier (Dudley et al. Reference Dudley, Kaspari and Yanoviak2012; Stallard and Edmond Reference Stallard and Edmond1981). As a result, sodium concentrations in plant tissues are extremely low, imposing a strong dietary constraint on herbivores given its essential role in maintaining physiological homeostasis (Abraham et al. Reference Abraham, Hempson, le Roux, Maré, Taylor, Webster, Duvall, Prys-Jones, Coppock, Ridenour, de Jager, Augustine, Chapman, Fashing, Harfoot, Holdo, Hopcraft, Johnson, van Langevelde, Malhi, Morel, Nguyen, Owen-Smith, Potter, Prins, Rothman, Swedell, Svenning, Thomson, van der Plas, Veldhuis, Pringle, Clauss and Doughty2025; Kaspari Reference Kaspari2020). In response to this chronic sodium deficiency, many herbivores engage in geophagy—the deliberate consumption of soil—at mineral licks (Klaus and Schmid Reference Klaus and Schmid1998; Tobler et al. Reference Tobler, Carrillo-Percastegui and Powell2009). These licks represent rare, discrete landscape features where certain minerals, such as sodium, occur at higher concentrations than in surrounding soils (Emmons and Stark Reference Emmons and Stark1979; Griffiths et al. Reference Griffiths, Jin, Griffiths and Gilmore2023). In western Amazonia, where sodium scarcity is extreme, mineral supplementation is widely considered a primary driver of mammalian geophagy at mineral licks (Dudley et al. Reference Dudley, Kaspari and Yanoviak2012; Griffiths et al. Reference Griffiths, Hansbrough, Griffiths, Valderrama and Gilmore2024).
Recognition of sodium attraction in herbivores is well documented in pastoral and ranching systems, where salt supplements are deliberately provided to livestock to improve body condition and increase productivity (O’Connor et al. Reference O’Connor, Hawke, Waller, Rotherham and Coulter2000, Phillips et al. Reference Phillips, Youssef, Chiy and Arney2016). Salt provisioning has also been adopted in hunting contexts, where they are used to attract game and concentrate animals in predictable locations (Suzuki et al. Reference Suzuki, Mori and Yamagawa2024). In a similar manner, hunters in western Amazonia take advantage of naturally occurring mineral licks, as these sites function as predictable congregation points for a wide variety of wildlife (Gilmore et al. Reference Gilmore, Griffiths and Bowler2020; Montenegro Reference Montenegro2004). More recently, artificial mineral licks have been experimentally established in a limited number of conservation contexts, most notably within protected areas in Malaysia (Razali et al. Reference Razali, Mansor, Farinordin, Ahmad Zaini, Atiqah Razali, Abdul Patah, Mod Husin, Shah Redza Hussein and Nor2025). These sites were created by repeatedly depositing salt and other minerals into shallow excavations and were primarily intended to supplement limiting nutrients for wildlife (Magintan et al. Reference Magintan, Rahmah, Ismail, Jawing, Rasdi and Mohd Sanusi2015). Experimental tests of artificial salt licks have not yet been conducted in Amazonian forests. As a result, it remains unclear which species preferentially use sodium-enriched soils and how strongly these sites are selected relative to unsupplemented substrates.
Here, we present the first controlled field experiment of artificial salt licks, comparing animal visitation at paired salt-enriched pits and untreated control pits. We also monitored two natural mineral licks simultaneously as an ecological reference. This design allows us to quantify species-specific and community-level preferences for sodium-enriched soils, evaluate the consistency of responses across sites, and assess whether attraction persists after supplementation ceases. Together, these results aim to provide experimental insight into sodium’s role in geophagy and inform the potential application of artificial salt licks as a conservation tool.
Methods
Study area
The study was conducted at Los Amigos Biological Station (12°34′S, 70°06′W; ∼270m a.s.l.) in Madre de Dios, southeastern Peru. The station is situated within lowland tropical rainforest and encompasses a mosaic of terra firme and seasonally flooded floodplain habitats. The regional climate is characterized by a mean annual temperature of approximately 26°C and mean annual rainfall of ∼2,700 mm, with a pronounced wet season extending from November to April. The landscape contains several naturally occurring mineral licks, two of which were monitored during this study.
Experimental design
We conducted a paired, controlled field experiment to assess wildlife responses to experimental salt deposits. A total of five pit pairs (n = 10 pits) were established across the study area, with each pair consisting of one artificial salt lick and one control pit (Figure 1). Within each pair, pits were spaced approximately 15 m apart to ensure similar local habitat conditions while allowing animals to discriminate between treatments. To promote spatial independence among pairs, artificial salt licks were separated by at least 500 m.
Map of the study area showing the locations of the experimental sites and the natural mineral licks.

Figure 1. Long description
Panel A: A map of South America highlighting the study area in western Amazonia. The inset shows a zoomed-in view of the study area with the Madre de Dios River and Los Amigos River labeled. Panel B: A detailed map of the study area with markers indicating locations of salt, control, and natural mineral licks. The elevation gradient is shown with a color scale ranging from 200 to 400 meters above sea level. The study area boundary is outlined in green.
All pits were constructed in February 2025. Each pit measured approximately 1 × 1 m in surface area and was excavated to a depth of ∼0.5 m (Figure 2). One side of each pit was shaped into a gradual slope (∼30–40°) to facilitate access by wildlife. Aside from salt supplementation, experimental and control pits were identical in size and shape.
Construction of experimental pits (left) and application of salt to the artificial salt lick (right).

The pits were monitored over a six-month period from March to August 2025 and were subject to three sequential experimental phases. During Phase 1 (months 1–3), approximately 20 L of water was poured weekly into each pit. In salt-enriched pits, 2 kg of coarse salt was manually dispersed across the pit floor and walls prior to water addition, whereas control pits received no salt. This initial phase included weekly water addition because we considered it unlikely that animals would detect salt added directly to dry soil; instead, we hypothesized that animals visiting the pits were more likely to detect dissolved sodium in water while drinking, thereby facilitating initial detection of the salt-enriched pits. During Phase 2 (months 4–5), we continued supplementing 2 kg of coarse salt to the salt-enriched pits, but we no longer added water. Control pits also no longer received water. This phase was intended to evaluate whether animals shifted from drinking sodium-enriched water to directly consuming sodium-enriched soil through geophagy. During Phase 3 (month 6), no water or salt was added to either pit type, allowing assessment of animal visitation following cessation of supplementation.
In addition to the experimental pit pairs, two naturally occurring mineral licks within the study area were monitored throughout the same six-month period to provide an ecological reference. These natural licks were not manipulated and did not form part of the experimental treatment comparisons. Camera traps at natural licks were deployed using the same camera models, placement height, orientation, and recording settings as those used at experimental pits. Data from natural licks were used descriptively to contextualize the diversity of wildlife visitation observed at artificial mineral licks, but were not included in any statistical models.
Camera-trap monitoring
Each pit was monitored by two camera-traps (Garder Pro A3), resulting in a total of 20 cameras deployed across the 10 pits. Cameras were mounted on trees or wooden stakes approximately 30 cm above ground level and oriented towards the centre of the pit (Figure 3).
Screenshot of a camera trap video displaying a second camera trap recording a white-lipped peccary consuming soil at an artificial salt lick.

Cameras were programmed to record 15-s video clips upon activation, with a 1-s minimum trigger interval between consecutive recordings. This configuration was chosen to document detailed behaviours such as drinking and geophagy. Camera traps operated continuously throughout the monitoring period. Cameras were checked weekly during pit provisioning visits to ensure proper functioning and to replace batteries and SD cards as needed. All camera placements and settings were standardized across pit types and experimental phases to ensure comparability of detection rates and behavioural observations.
Video annotation and taxonomic grouping
All camera-trap videos were manually reviewed and labelled to the lowest taxonomic level that could be reliably identified from the footage. Species identification was based on external morphology, body size, and pelage colouration. However, because identification certainty varied according to image quality, illumination, and species similarity, some taxa were pooled into broader analytical groups to minimize misclassification errors.
In particular, the two brocket deer species present at the study site, red brocket deer (Mazama americana) and brown brocket deer (Passalites nemorivagus), could not always be reliably distinguished in nocturnal videos, which represented the majority of detections for this taxon. These species were therefore pooled and analysed as “brocket deer”. Similarly, armadillo detections could not be consistently assigned to either nine-banded armadillo (Dasypus novemcinctus) or western long-nosed armadillo (Dasypus pastasae) and were therefore grouped as Dasypus spp. All tinamou species were combined into a single ‘tinamou’ category, while all pigeons and doves were pooled into a broader ‘Columbidae’ group. Small-bodied rodents (smaller than agoutis, Dasyprocta spp.) and small opossums (smaller than Didelphis marsupialis) were grouped into a broader ‘small rodents and opossums’ category.
These grouping decisions reduced taxonomic resolution but increased classification consistency across the dataset. Consequently, results for pooled categories should be interpreted as representing responses at the genus or functional-group level rather than species-specific responses. Potential ecological differences among species within pooled groups will therefore not be detectable in the analyses.
Data processing and analytical units
The raw dataset was processed to derive biologically meaningful visitation events and standardized temporal sampling units. Detections were aggregated into independent visitation events using a 30-minute temporal threshold. Specifically, consecutive detections of the same species at the same pit separated by less than 30 minutes were considered part of the same visit. Importantly, this definition represents an operational criterion to reduce temporal redundancy rather than a strict assumption of independence, which was explicitly evaluated in subsequent analyses (see Sensitivity analyses below).
Visitation events were then aggregated into a weekly dataset at the pit × species level, which served as the primary analytical unit. Each observation corresponds to the number of independent visits recorded for a given species at a given pit during a given week. Weeks were defined using calendar weeks (starting on Monday), ensuring consistent temporal structure across sites. Sampling effort was explicitly quantified as the number of active camera-trap days per pit per week (effort_days). Cameras operated continuously throughout the study period, with minimal downtime during battery replacement; therefore, effort was assumed to be homogeneous within active periods. Partial weeks were retained and quantified, and effort was incorporated into all models as a log-offset to standardize visitation rates. Experimental phases were defined based on treatment chronology: Phase 1 corresponded to the initial period with combined water and salt supplementation, Phase 2 to the period with salt-only supplementation, and Phase 3 to the post-treatment period. These phases were included as categorical predictors in all models.
Statistical analyses
We analysed visitation rates using a hierarchical modelling framework designed to account for the nested spatial structure of the experiment and heterogeneous responses among species. All analyses were conducted using generalized linear mixed models with a negative binomial error distribution given that visitation counts exhibited strong overdispersion relative to Poisson expectations. This is characterized by a high proportion of zero observations and occasional high counts associated with repeated use of specific pits by certain species. Under these conditions, Poisson models would underestimate variance and inflate Type I error rates. The negative binomial formulation allows variance to increase with the mean, providing a more appropriate representation of camera-trap count data.
Weekly visitation counts were modelled using a log-link function under the following general formulation:
 $Y_{ijkt}\sim {\rm NegBin}\left(\mu _{ijkt},\theta \right)$
where Y ijkt is the number of visits for species k at pit j within site i during week t, μ ijkt is the expected visitation rate, and θ is the dispersion parameter of the negative binomial distribution.
The expected visitation rate μ ijkt was modelled as:
 $\begin{align}log \left(\mu _{ijkt}\right)=& \beta _{0}+\beta _{1}{\rm Treatment}_{ij}+\beta _{2}{\rm Phase}_{t}+log \left({\rm effort}_{ijt}\right)+u_{i} \\& +v_{ij}+w_{k}\end{align}$
where β 0 is the intercept, β 1and β 2 are fixed effects for treatment (salt vs. control) and experimental phase, respectively, log(effort ijt ) is an offset accounting for sampling effort. All models included random intercepts for site u i ∼ N(0,σ 2 site), pit nested within site v ij ∼ N(0,σ 2 pit), and species w k ∼ N(0,σ 2 species), accounting for hierarchical spatial structure and repeated observations across taxa.
Based on this general formulation, alternative models were constructed by modifying the fixed and random components (Table 1). We first defined a null model including only random effects to capture baseline variation among sites, pits, and species (Null). We then fitted a treatment-only model to assess whether salt supplementation explained variation beyond this background structure (m_ treatment), followed by a model including both treatment and experimental phase to test for temporal shifts in visitation rates (m_tp). A more complex model incorporating a treatment × phase interaction was used to evaluate whether treatment effects varied across experimental phases (m_t*p). To explore heterogeneity in species responses, we fitted an extended additive and interactive model including species-specific random slopes for treatment (m_tp_spp and m_full), allowing the magnitude of the salt effect to vary among taxa.
Summary of candidate models used to evaluate the effects of salt supplementation on visitation rates. Models are organized according to their analytical level, representation of species-level variation, and treatment of temporal structure. The core model set includes hierarchical species-level models with increasing complexity in fixed effects and random structure, followed by community-level formulations that aggregate visitation across species. Temporal autocorrelation was evaluated using auto-regressive models of order 1 (AR1), which account for dependence among repeated weekly observations within pits or within pit × species combinations. The sensitivity analysis (m_sens) is a set of six models to assess the influence of alternative definitions of independent visitation events, including varying temporal thresholds (15, 30, and 60 minutes) and independence criteria. Models fitted to subsets of species (≥10 visits) were used to ensure stable estimation of species-level parameters

Table 1. Long description
A table comparing different models used to evaluate the effects of salt supplementation on visitation rates. The table has 11 rows and 6 columns. The columns are labeled Model, Analytical level, Temporal structure, Species structure, Fixed effects, and Purpose/expectation. Row 1: Model, Null; Analytical level, Species x pit x week; Temporal structure, Static; Species structure, Random intercept (species); Fixed effects, Intercept only; Purpose/expectation, Capture baseline spatial and taxonomic variation in visitation rates. Row 2: Model, m_treatment; Analytical level, Species x pit x week; Temporal structure, Static; Species structure, Random intercept (species); Fixed effects, Treatment; Purpose/expectation, Test whether salt supplementation increases visitation rates beyond baseline variation. Row 3: Model, m_tp; Analytical level, Species x pit x week; Temporal structure, Static; Species structure, Random intercept (species); Fixed effects, Treatment + Phase; Purpose/expectation, Evaluate additive effects of treatment and temporal dynamics. Row 4: Model, m_tp_spp; Analytical level, Species x pit x week; Temporal structure, Static; Species structure, Random intercept + slope (species); Fixed effects, Treatment x Phase; Purpose/expectation, Evaluate heterogeneity in species-specific responses to salt supplementation. Row 5: Model, m_t*p; Analytical level, Species x pit x week; Temporal structure, Static; Species structure, Random intercept (species); Fixed effects, Treatment x Phase; Purpose/expectation, Test whether treatment effects vary across experimental phases. Row 6: Model, m_full; Analytical level, Species x pit x week; Temporal structure, Static; Species structure, Random intercept + slope (species); Fixed effects, Treatment x Phase; Purpose/expectation, Evaluate combined effects of temporal variation and species-specific heterogeneity. Row 7: Model, m_comm_static; Analytical level, Community x pit x week; Temporal structure, Static; Species structure, Species pooled; Fixed effects, Treatment + Phase; Purpose/expectation, Estimate overall community-level response ignoring species identity. Row 8: Model, m_comm_ar1; Analytical level, Community x pit x week; Temporal structure, AR(1) within pit; Species structure, Species pooled; Fixed effects, Treatment + Phase; Purpose/expectation, Assess robustness of community-level effects to temporal autocorrelation. Row 9: Model, m_species_static; Analytical level, Species x pit x week (≥10 visits); Temporal structure, Static; Species structure, Random intercept (species); Fixed effects, Treatment + Phase; Purpose/expectation, Estimate species-level effects using reduced dataset with sufficient observations. Row 10: Model, m_species_ar1; Analytical level, Species x pit x week (≥10 visits); Temporal structure, AR(1) within pit x species; Species structure, Random intercept (species); Fixed effects, Treatment + Phase; Purpose/expectation, Evaluate robustness of species-level inference to temporal dependence. Row 11: Model, m_sens (set); Analytical level, Species x pit x week; Temporal structure, Static; Species structure, Random intercept (species); Fixed effects, Treatment + Phase; Purpose/expectation, Evaluate sensitivity of results to alternative definitions of independent visitation events.
Because repeated observations within pits may exhibit temporal dependence, we fitted alternative models incorporating an auto-regressive correlation structure (AR(1)) among weekly observations within pits (m_comm_ar1), and within pit × species combinations (m_species_ar1) and compared these to their corresponding static formulations (m_comm_static, m_species_static). These auto-regressive structures of order 1 AR(1) models explicitly account for temporal dependence by modelling correlations between successive observations and are commonly used in ecological time-series and repeated-measures data to model correlation between successive observations, where correlation is expected to decline with temporal lag (Bolker et al. Reference Bolker, Brooks, Clark, Geange, Poulsen, Stevens and White2009; Zuur et al. Reference Zuur, Ieno, Walker, Saveliev and Smith2009). Finally, to evaluate the influence of the temporal threshold used to define independent visitation events, we conducted a sensitivity analysis (m_sens) comprising six model realizations. These correspond to combinations of three alternative thresholds (15, 30, and 60 minutes) and two independence criteria: (1) a rolling window based on the time since the last detection and (2) a fixed window based on the time since the first detection within an event. Together, this hierarchical set of models allowed us to disentangle treatment effects from spatial, temporal, and taxonomic sources of variation, while explicitly evaluating the robustness of inference to model structure and assumptions (Table 1).
Model selection was based on Akaike’s Information Criterion (AIC), complemented by likelihood ratio tests for nested comparisons. Differences in AIC were interpreted following standard guidelines (ΔAIC > 2). Marginal and conditional R 2 values were used to quantify the variance explained by fixed effects and by the full model, respectively. Effect sizes were estimated on the log scale and exponentiated to obtain rate ratios, and treatment contrasts were evaluated using the emmeans framework (Lenth Reference Lenth2024). Models were implemented in the glmmTMB package in R (Brooks et al. Reference Brooks, Kristensen, van Benthem, Magnusson, Berg, Nielsen, Skaug, Mächler and Bolker2017; R core team 2024).
Results
From an initial dataset of 23,312 camera-trap detections, we identified 2,226 independent visitation events using a 30-minute temporal threshold. These events were aggregated into a weekly dataset at the pit × species level, resulting in 8,502 observations across 10 experimental pits (five sites with paired salt and control treatments) and 39 taxonomic groups. Sampling effort was consistent across pits and weeks (median = 7 days per week), with minor variation associated with partial weeks at the beginning and end of deployment. The dataset was balanced between treatments (4,251 control and 4,251 salt observations). Mean visitation rates were low (mean = 0.246 visits per observation), with occasional higher counts (maximum = 36 visits). A small subset of taxa accounted for a large proportion of visitation events. The most frequently recorded taxa included brocket deer (Mazama americana and Passalites nemorivagus) (312 visits), Cuniculus paca (303), small rodents and didelphids (272), and Tapirus terrestris (264), followed by Pecari tajacu, Dasyprocta variegata, Columbidae, and Tinamidae. In contrast, several taxa were infrequently recorded, with fewer than five total visits across the study period. Across most sites and phases, salt-treated pits recorded higher visitation than control pits, although the magnitude of differences varied among sites (Table S1).
Model comparison indicated that the additive model including treatment and phase (m_tp) provided the best overall fit to the data (AIC = 6733.53; Table 2), although differences among competing models were small (ΔAIC < 3 within the core model set). The estimated effect of salt supplementation was positive and statistically significant in the best-supported model (β = 0.691 ± 0.304 SE, z = 2.27, p = 0.0229), corresponding to an approximate twofold increase in visitation rates (rate ratio = 2.00, 95% CI: 1.10–3.62; Table 2). Phase effects were comparatively small in magnitude.
Summary of model performance and salt-treatment effects across alternative analytical formulations. Models are grouped according to analytical level and dataset structure. AIC values are only directly comparable within model groups fitted to the same dataset. Effect sizes are reported as log-scale coefficients (β) and exponentiated rate ratios. Community-level models aggregate visitation across species, whereas species subset models include only taxa with ≥10 independent visits to ensure stable parameter estimation. AR(1) models incorporate temporal autocorrelation among repeated weekly observations. The sensitivity analysis summarizes six model realizations based on alternative definitions of independent visitation events

Table 2. Long description
A table comparing model performance and salt-treatment effects across different analytical formulations. The table is divided into several groups: Core models (full species dataset), Community-level models (aggregated dataset), Species subset models (>=10 visits), and Sensitivity analysis (independence definition). Each group contains multiple rows with columns for Model, AIC, ΔAIC, β salt, SE, z, p-Value, Rate ratio, 95% CI, and Role in inference. The Core models group includes models like m_tp, m_treatment, m_t*p, Null, m_tp_spp, and m_full. The Community-level models group includes m_comm_static and m_comm_ar1. The Species subset models group includes m_species_ar1 and m_species_static. The Sensitivity analysis group includes m_sens (range). Each row provides specific values for each column, detailing the performance and effects of the models.
Models incorporating additional complexity did not improve model support. Including a treatment × phase interaction (m_t*p) resulted in a higher AIC (ΔAIC = 2.75) and a non-significant interaction effect (Table 2). Similarly, adding species-specific random slopes for treatment (m_tp_spp) did not improve model fit relative to the additive model (ΔAIC = 7.48; likelihood ratio test: χ 2 = 2.89, p = 0.236). The most complex model, combining interaction and species-specific slopes (m_full), also showed no improvement in model support (ΔAIC = 9.01; χ 2 = 2.47, p = 0.291).
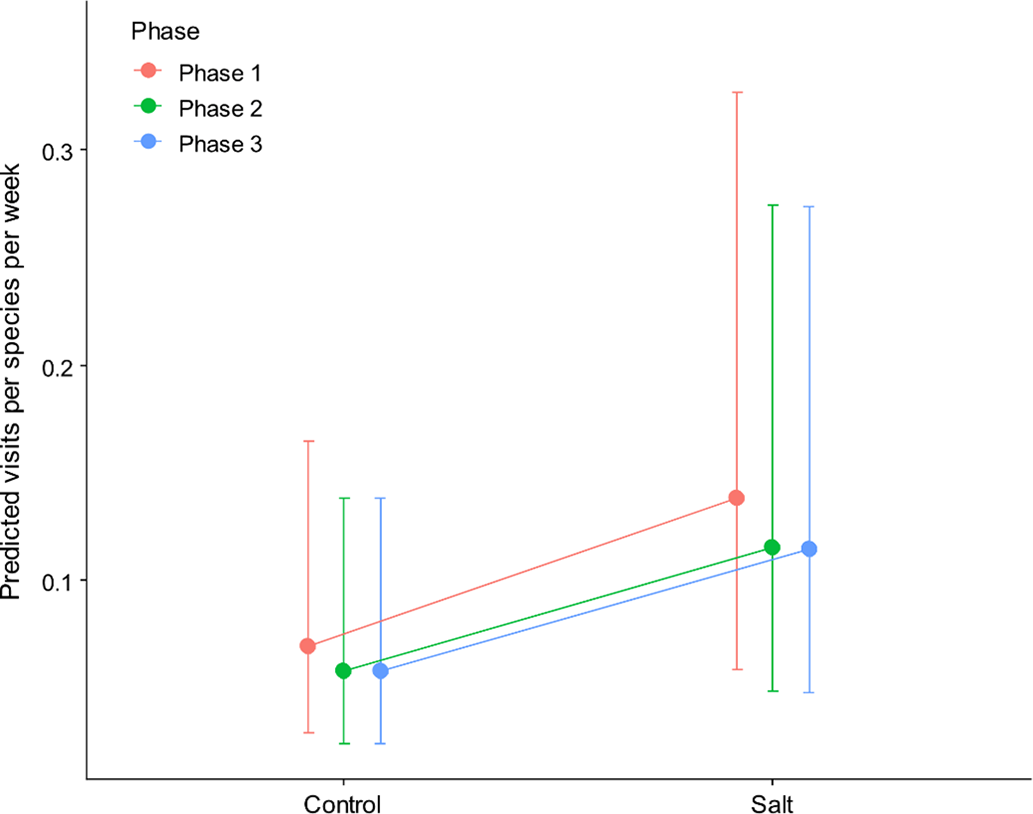
Visitation rates varied across experimental phases (Figure 4). Phase 1 generally exhibited the highest visitation rates, followed by lower activity in Phase 2 and more variable patterns in Phase 3. Across all phases, predicted visitation rates were consistently higher in salt-treated pits relative to controls (Figure 4). Pairwise contrasts of treatment effects within phases indicated salt-to-control rate ratios of approximately 1.80 in Phase 1, 1.37 in Phase 2, and 1.57 in Phase 3. However, these contrasts were associated with substantial uncertainty, and confidence intervals overlapped across treatments within individual phases.
Predicted visitation rates to salt-treated and control pits across experimental phases. Points represent model-predicted means, and error bars indicate 95% confidence intervals. Values are shown on a per-species basis and therefore appear numerically small due to the low frequency of visits for individual taxa. For interpretability, these values can be translated into expected intervals between visits. For example, a predicted rate of 0.1 visits per week corresponds to approximately one visit every 10 weeks, whereas 0.2 and 0.3 visits per week correspond to one visit every 5 and ∼3 weeks, respectively.

Estimates from the model including species-specific treatment effects (m_full) revealed variation in the magnitude of salt responses among taxa (Figure 5). Estimated salt-to-control rate ratios spanned a broad range across species, from approximately 1.4 to >2.5, indicating that some taxa exhibited stronger apparent responses to salt supplementation than others. The strongest estimated responses were observed in frequently detected herbivorous ungulates and rodents such as brocket deer (M. americana and P. nemorivagus), C. paca, and T. terrestris, which showed rate ratios exceeding twofold increases in visitation. In contrast, more omnivorous and less frequently detected taxa exhibited weaker or more uncertain responses, with estimated rate ratios closer to 1 and wide confidence intervals overlapping unity (Figure 5B).
Taxa-specific responses to salt supplementation. (A) Heatmaps show weekly visitation counts aggregated at the highest possible taxonomic level, with panels separated by treatment. Rows correspond to species, and columns represent consecutive sampling weeks. Color intensity indicates the number of independent visits per week. Vertical dashed lines denote transitions between experimental phases. (B) Species-specific effects of salt supplementation on visitation rates estimated from a hierarchical negative binomial mixed model (m_full). Points represent estimated salt-to-control rate ratios for each taxon, combining fixed and species-specific random effects. Horizontal lines indicate approximate 95% confidence intervals derived from the conditional variance of the model. Point size is proportional to the total number of independent visits recorded for each taxon, and colors represent broad taxonomic or functional groups. Values greater than 1 indicate higher visitation rates at salt-treated pits relative to controls, whereas values near 1 indicate little difference between treatments. Estimates for taxa with fewer observations are associated with wider intervals, reflecting greater uncertainty.

Figure 5. Long description
Panel A: Two heatmaps show weekly visitation counts for different species under control and salt treatments. The y-axis lists species ordered by salt-effect size, and the x-axis represents weeks from March to August. Color intensity indicates the number of visits, with darker colors representing higher visitation rates. Vertical dashed lines mark transitions between experimental phases. Panel B: A scatter plot displays species-specific effects of salt supplementation on visitation rates. The x-axis shows the salt-to-control rate ratio, and the y-axis lists species. Point size indicates the total number of visits, and colors represent different taxonomic groups. Horizontal lines show 95% confidence intervals.
Despite this variation, uncertainty around species-specific estimates was substantial. Confidence intervals for many taxa were broad and overlapped extensively, particularly for species with low detection frequencies. Consistent with this, models incorporating species-specific random slopes for treatment did not improve model fit relative to simpler additive models (ΔAIC = 7.48; likelihood ratio test: χ 2 = 2.89, p = 0.236; Table 2).
At the community level, models incorporating temporal autocorrelation (AR1) indicated strong temporal dependence among repeated weekly observations within pits (ρ = 0.88) but produced nearly identical estimates of treatment effects compared to static models (Table 2). The estimated salt effect remained consistent (β ≈ 0.73–0.75), corresponding to a rate ratio of approximately 2.08–2.13, with both models yielding statistically significant effects (p < 0.02). Model fit was also similar, with only a small difference in AIC between static and AR1 formulations (ΔAIC ≈ 1.48), indicating limited influence of temporal autocorrelation at the community level.
At the species level (subset of taxa with ≥10 visits), incorporating temporal autocorrelation improved model fit substantially (AIC = 5376.97 for m_species_ar1 vs. 5961.10 for m_species_static), indicating strong temporal dependence (ρ = 0.92) in species-level visitation dynamics. However, the estimated treatment effect also remained consistent in direction and magnitude (rate ratio ≈ 1.75 in m_species_ar1 vs. ≈ 2.10 in m_species_static), although the effect was no longer statistically significant under the AR1 formulation (p = 0.105; Table 2).
Sensitivity analyses based on alternative definitions of independent visitation events yielded highly consistent estimates of treatment effects. Across all six model realizations, estimated rate ratios ranged from approximately 2.00 to 2.23, with all models indicating higher visitation in salt-treated pits and statistically significant effects (p < 0.03; Table 2).
Discussion
Our results provide consistent evidence that salt supplementation increases visitation rates across a diverse assemblage of vertebrate taxa, with an approximate twofold increase in visitation relative to control pits. This effect was robust across a range of analytical approaches, including alternative model structures, temporal autocorrelation formulations, and definitions of independent visitation events. Despite strong variation in baseline activity among species and sites, the effect of salt supplementation was remarkably consistent in magnitude and direction.
Importantly, increasing model complexity did not improve inference. Models incorporating treatment × phase interactions or species-specific treatment responses did not receive additional support, indicating that the observed increase in visitation is best described as a general, system-wide response rather than one driven by strong temporal modulation or taxon-specific specialization.
We thus demonstrate that artificial salt licks can be successfully established in western Amazonian forests through repeated salt supplementation of shallow soil pits, initially provisioned with water to facilitate detection of dissolved sodium. Attraction to these sites persisted after active supplementation ceased, suggesting continued use driven by residual sodium in the soil and learned site fidelity. Together, these findings provide experimental support for sodium availability as an important driver of geophagy in lowland Amazonian wildlife and show that relatively small, localized salt inputs can generate sustained behavioural responses. Given that water was added to both treatment and control pits during establishment, the observed treatment effect is unlikely to reflect attraction to water alone.
These responses are consistent with long-standing evidence that sodium is among the most limiting dietary nutrients for terrestrial herbivores in western Amazonia (Dudley et al. Reference Dudley, Kaspari and Yanoviak2012; Duvall et al. Reference Duvall, Griffiths, Clauss and Abraham2023). Natural mineral licks in the region are characterized by elevated sodium concentrations relative to surrounding soils, while plant tissues are exceptionally sodium-poor (Emmons and Stark Reference Emmons and Stark1979, National Research Council 2005). This combination creates strong selective pressure for behaviours that allow animals to rapidly detect and exploit spatially restricted sodium sources. The marked increase in visitation at artificial salt licks relative to paired control pits within a matter of months indicates that wildlife not only detects these novel sodium sources quickly but also adjusts space use and foraging behaviour over short temporal scales. The persistence of visitation after supplementation ceased further suggests that sodium retained in the soil, together with learned site use, may sustain continued exploitation of these locations over time.
Almost all taxa that showed a significant increase in visitation at artificial salt licks were terrestrial herbivorous ungulates and rodents. Within these groups, responses to salt supplementation were mainly dominated by medium- and large-bodied species, which is expected given that absolute sodium requirements increase disproportionately with body size (Duvall et al. Reference Duvall, Griffiths, Clauss and Abraham2023; Griffiths et al. Reference Griffiths, Hansbrough, Griffiths, Valderrama and Gilmore2024). However, species-specific effect sizes likely also reflect differences in local abundance and encounter rates with the artificial salt licks. Highly abundant species such as pacas exhibited the strongest responses, exceeding those of larger-bodied taxa such as tapirs or deer (Antunes et al. Reference Antunes, Montanarin, Gräbin, dos Santos Monteiro, de Pinho, Alvarenga, Ahumada, Wallace, Ramalho, Barnett, Bager, Lopes, Keuroghlian, Giroux, Herrera, de Almeida Correa, Meiga, de Almeida Jácomo, de Barros Barban, Antunes, de Almeida Coelho, Camilo, Nunes, dos Santos Maroclo Gomes, da Silva Zanzini, Castro, Desbiez, Figueiredo, de Thoisy, Gauzens, Oliveira, de Lima, Peres, Durigan, Brocardo, da Rosa, Zárate-Castañeda, Monteza-Moreno, Carnicer, Trinca, Polli, da Silva Ferraz, Lane, da Rocha, Barcelos, Auz, da Rosa, Silva, Silvério, Eaton, Maioli, Maracahipes-Santos, Valenzuela, Benavalli, Fletcher, Paolucci, Zanzini, da Silva, Rodrigues, Benchimol, Oliveira, Lima, da Silva, Junior, Viscarra, Cohn-Haft, Abrahams, Benedetti, Marmontel, Hirt, Tôrres, Cruz Junior, Alvarez-Loayza, Jansen, Prist, Brando, Perônico, Leite, Rabelo, Sollmann, Beltrão-Mendes, Ferreira, Coutinho, Oliveira, Ilha, Hilário, Pires, Sampaio, Moreira, Botero-Arias, Martinez, Nóbrega, Fadini, Morato, Carneiro, Almeida, Ramos, Schaub, Dornas, Cueva, Rolim, Laurindo, Espinosa, Fernandes, Sanaiotti, Alvim, Dornas, Piña, Andrade, Santiago, Magnusson, Campos and Ribeiro2022). This indicates that use of artificial salt licks is shaped jointly by sodium demand and the frequency with which species encounter these sites.
Responses at artificial salt licks closely matched the observed patterns of geophagy at natural mineral licks for terrestrial mammals and birds. All terrestrial and avian taxa that regularly used natural mineral licks were also observed using the artificial salt licks. In contrast, arboreal mammals that frequently visit natural mineral licks, such as porcupines, sloths, and monkeys, were not recorded at the artificial salt licks. This is likely a result of them not encountering these sites incidentally while foraging. Instead, they may rely on socially learned information and repeated observation of terrestrial species exploiting mineral-rich substrates (Griffiths et al. Reference Griffiths, Luther and Pollock2025). Greater perceived predation risk associated with ground-level foraging may further slow adoption by arboreal species (Link et al. Reference Link, Galvis, Fleming and Di Fiore2011, Pottie et al. Reference Pottie, Tapara Arapa and Forsyth2026). This pattern therefore likely reflects a temporal lag rather than a lack of attraction, and we predict that extended monitoring would reveal broader arboreal use of artificial salt licks.
Our results suggest that artificial salt licks may have potential applications beyond experimental contexts, particularly in conservation planning and wildlife management. Natural mineral licks in western Amazonia, for example, are well-known focal points of hunting pressure (Gilmore et al. Reference Gilmore, Griffiths and Bowler2020; Montenegro Reference Montenegro2004). Several endangered species, including tapirs, white-lipped peccaries (Tayassu pecari), and spider monkeys (Ateles chamek), frequently use these sites (Blake et al. Reference Blake, Mosquera, Guerra, Loiselle, Romo and Swing2011). As a result, hunting at mineral licks can have disproportionate impacts on their populations at local scales (Peres Reference Peres2000). In such contexts, the establishment of artificial sodium-rich substrates within protected or strictly managed areas could, in principle, reduce reliance on high-risk natural licks. Similar approaches have been implemented in Malaysian National Parks, supporting their potential use as targeted conservation tools (Razali et al. Reference Razali, Mansor, Farinordin, Ahmad Zaini, Atiqah Razali, Abdul Patah, Mod Husin, Shah Redza Hussein and Nor2025; Simpson et al. Reference Simpson, Nasaruddin, Traeholt and Nor2020).
Artificial salt licks could also be relevant in landscapes undergoing rapid environmental change, where climate-driven upslope range shifts are forcing species to establish themselves in higher-elevation habitats (Chen et al. Reference Chen, Hill, Ohlemüller, Roy and Thomas2011). Studies have shown that the presence and availability of natural mineral licks decline with increasing elevation (Molina González et al. Reference Molina González, Agudelo Henríquez and Armenteras-Pascual2021). In this context, sodium deficiency may represent an additional constraint superimposed on the energetic and nutritional challenges associated with range expansion into novel environments (Dudley et al. Reference Dudley, Kaspari and Yanoviak2012, Sexton et al. Reference Sexton, McIntyre, Angert and Rice2009). Although this remains speculative, artificial salt licks could function as a mitigation tool in such scenarios by supplementing sodium availability in higher-elevation habitats. Similarly, within corridor planning frameworks, strategically placed sodium sources might enhance the use of designated movement pathways by increasing habitat attractiveness.
Despite the clear and consistent responses observed here, several limitations should be acknowledged when interpreting these results and considering broader applications of artificial salt licks. First, natural mineral licks are geochemically complex features that typically contain elevated concentrations of multiple elements, including magnesium, potassium, and calcium, and often consist of specific clays such as kaolinite that may contribute to geophagy through detoxification or adsorption mechanisms (Emmons and Stark Reference Emmons and Stark1979; Griffiths et al. Reference Griffiths, Jin, Griffiths and Gilmore2023). By contrast, our experimental licks isolated sodium as a single manipulated component, and therefore cannot capture the full functional complexity of natural licks or disentangle the relative importance of non-sodium constituents in shaping animal use. Second, although responses were generally consistent across sites, our study included only five independent spatial replicates, limiting inference regarding landscape-level generality and the extent to which these patterns may vary across broader environmental or biogeographic contexts. Third, although we hypothesize that arboreal mammals may require longer periods to detect and incorporate artificial salt licks into their ranging behaviour, our six-month monitoring window provides limited direct evidence for this process. Consequently, we cannot yet confirm whether strictly arboreal taxa would eventually adopt artificial salt licks under extended exposure. Finally, while artificial salt licks show promise as a research and potentially management-relevant tool, their deployment should be approached cautiously. Concentrated resource patches may alter movement patterns, aggregation dynamics, or disease transmission risk in ways not captured by short-term studies (Becker et al. Reference Becker, Streicker and Altizer2015; Oro et al. Reference Oro, Genovart, Tavecchia, Fowler and Martínez-Abraín2013). Future studies integrating longer monitoring periods, greater spatial replication, geochemical complexity, and population-level outcomes will be essential to fully assess the ecological consequences and conservation utility of artificial salt licks in Amazonian landscapes.
Supplementary material
The supplementary material for this article can be found at https://doi.org/10.1017/S0266467426100868.
Acknowledgements
We thank Edwin Quispe for assistance with preparing the map of the study area.
Financial support
This work was supported by the Gordon and Betty Moore Foundation and by the Neotropical Primate Fund (grant SMA-CCO-G0000000455), administered by Re:wild.
Competing interests
The authors declare no competing interests.




 Open access

