
Introduction
The production of nanoclusters by gas-phase synthesis has been developed and widely used since the 1980s and 1990s by groups interested in studying their properties and their interaction with surfaces.[Reference Frank, Schulze, Tesche, Urban and Winter1] With the advent of the nanotechnology, the gas-phase synthesis technology has evolved to the fabrication of well-controlled nanoparticles (NPs). All variants of the technology are based on the atomization of a material, followed by the controlled coalescence of the atoms into NPs that are collected.[Reference Binns2] The different variants differ mainly in the way in which the material is atomized and they have rapidly evolved in the last decade giving rise to new experimental apparatus that can produce a wide variety of NPs.[Reference Huttel3] The most popular NP source is probably the one based on magnetron sputtering because it is relatively easy to use and it produces the largest proportion of charged NPs[Reference Haberland, Karrais and Mall4] which allows their mass selection and deflection. This probably explains why this type of NP source became commercially available in 2001.
In this paper, we will address three different issues that improve the versatility, stability, and production rates of sputter gas aggregation sources (SGAS). First, we will show how the single magnetron-based NP source has been adapted to the multiple ion cluster source (MICS) to produce a wider variety of NPs. In a second step, we will face the question of SGAS stability; although magnetron-based cluster sources are stable (in terms of NP size and deposition rates) over short periods of time (tens of minutes), instabilities for longer production times must be addressed for the further scaling-up and mass production. In that sense, the limitations induced by the well-known race track formation on the magnetron target is discussed and a possible solution to overcome this issue is presented. Finally, we address the not well-understood issue of the quality of the residual vacuum in the NP sources. In particular, we demonstrate its importance for the controlled formation of NPs in terms of size and synthesis rate for prolonged operation times.
The multiple magnetron approach in gas-phase synthesis of NPs
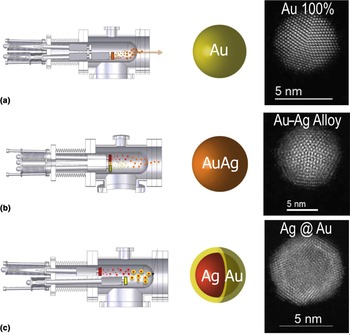
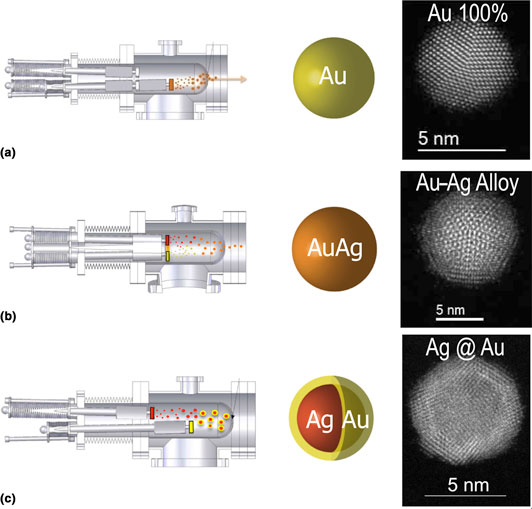
In the seminal works of Haberland et al.,[Reference Haberland, Karrais and Mall4, Reference Haberland, Karrais, Mall and Thurner5] a magnetron-based NP source has been proposed. In the following years, the single magnetron SGAS was extensively used to produce a wide variety of NPs and NP-based systems. One of the major advantages of such NP source resides in the fact that the stoichiometry of the fabricated NPs is identical or nearly identical to the stoichiometry of the sputtering target placed into the magnetron. However, this advantage became also a major drawback as an increasing number of studies requested a continuous scanning of the chemical composition of the NPs and this could not be achieved without a physical change of the magnetron target for each chemical composition; which in turn, implies the aperture of the vacuum vessels that is time and economical consuming. In order to overcome such limitation, few multi-magnetron approaches have been proposed in order to combine the different elements sputtered by more than one magnetron. Two of the proposed designs reside in the combination of a magnetron-based NP source coupled with one or more magnetrons that in a second stage allow the formation of a shell on the NPs generated by the NP source.[Reference Bai and Wang6, Reference Hennes, Lotnyk and Mayr7] Another design incorporates three sputtering targets in the same magnetron head that is inserted in an aggregation zone.[Reference Benelmekki, Bohra, Kim, Diaz, Vernieres, Grammatikopoulos and Sowwan8, Reference Johnson, Colby and Laskin9] In 2010, our group (Low dimensional Advanced Materials group at the ICMM-CSIC) proposed a new design, licensed to Oxford Applied Research Ltd., where the magnetrons are completely independent therefore giving more flexibility for the fabrication of well-controlled alloyed and core–shell (CS), core–shell–shell NPs. The new design is based in the replacement of standard 2″ diameter magnetron by three smaller magnetrons mounted in the same flange and, thus, compatible with the already existent aggregation sources. The magnetrons are completely independent regarding their power supply and argon feed but most importantly that can be placed at different positions in the aggregation zone in an independent manner. Such design has been called MICS as it has multiple magnetrons and it has been proven to be very powerful and flexible for the formation of alloyed NPs with well-controlled chemical composition and size[Reference Martínez, Díaz, Román, Ruano, Llamosa P and Huttel10] and also for the engineering of CS and core–shell–shell NPs.[Reference Llamosa, Ruano, Martínez, Mayoral, Roman, García-Hernández and Huttel11–Reference Martínez, Mayoral, Espiñeira, Roman, Palomares and Huttel13] Figure 1 illustrates the different configurations that are used for the synthesis of the variety of NPs. In Fig. 1(a), we illustrate the formation of single-element NPs that is achieved by switching on only one of the three magnetrons as it is routinely done in standard NP sources. In Fig. 1(b), the fabrication of alloyed NPs is illustrated where two of the magnetrons are placed in the same aggregation length in the aggregation zone (i.e., at the same vertical plane). In this configuration, the plasmas of both magnetrons intermix giving rise to the formation of alloyed NPs.[Reference Martínez, Díaz, Román, Ruano, Llamosa P and Huttel10] Figure 1(b) illustrates the formation of binary NPs but the configuration can be extended to a ternary alloy by simply placing the third magnetron in the same plane as the other two. Thanks to the intermixing of the plasmas generated by each magnetron, this configuration allows the synthesis of homogeneous alloyed NPs. The size of the NPs can be controlled through the positioning of the magnetrons inside the aggregation zone and/or by injecting helium like in other gas-phase NP sources.[Reference Chen, ten Brink, Palasantzas and Kooi14] On the other hand, the chemical composition of the NPs is controlled by the densities of atoms and ions generated by each magnetron that are monitored by the applied power and/or the argon flux injected in each magnetron.[Reference Llamosa, Martínez and Huttel15, Reference Ruano, Martínez and Huttel16] Figure 1(c) displays the configuration that is used for the generation of CS NPs. The formation of CS NPs is based on the fact that NPs formed from a first magnetron [red NPs in Fig. 1(c)] are covered by a second material [yellow in Fig. 1(c)] as they pass through the plasma generated by a second magnetron. In such configuration, the synthesis of NPs does not rely anymore on chemical reactions (oxidation and reduction potentials, e.g.) but only on the sticking coefficient of the atoms generated by the second magnetron on the NPs generated by the first magnetron. This approach not only simplifies the synthesis process but also allows the fabrication of NPs not accessible by chemical methods. In the online Supplementary file S1, we present an explicative movie of the different fabrication procedures.
Schematic representations of the operation of the MICS for the production of (a) single-element NPs, (b) alloyed NPs, and (c) core–shell-type NPs.

Therefore, this design has demonstrated to be very flexible for the synthesis of a wider variety of NPs. In collaboration with Oxford Applied Research Ltd., our group has developed a scaled-up variant of the MICS that is composed of three magnetrons of 2″ diameter each in a bigger aggregation zone, for the generation of more intense NP fluxes for fundamental studies in astrophysics.[Reference Martínez, Lauwaet, Santoro, Sobrado, Peláez, Herrero, Tanarro, Ellis, Cernicharo, Joblin, Huttel and Martín-Gago17]
Although such design of the MICS extends the variety of NPs that can be synthesized by SGAS, there are some technical problems related to the evolution of the magnetron and instabilities that still need to be addressed for the fabrication of NPs over long (hours) periods of time. In the next section, we discuss the race track formation, its influence on the formation of NPs, and a possible solution based on the Full Face Erosion (FFE) magnetron.
Race track influence and FFE magnetron design
Among the possible origins of instabilities of SGAS, the race track formation is the most commonly identified and can be considered as the major source of instability. Hence, it is important to address this issue to access prolonged operation and reliable production of NPs.
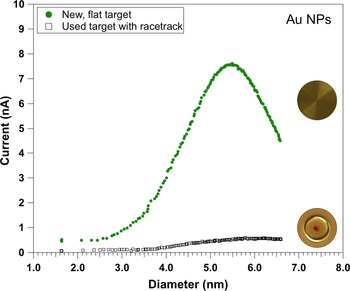
The race track is well-known to form on the target surface[Reference Panjan, Loquai, Klemberg-Sapieha and Martinu18] and its formation has been extensively reported in the literature even in SGAS.[Reference Ganeva, Pipa and Hippler19, Reference Rai, Mutzke, Bandelow, Schneider, Ganeva, Pipa and Hippler20] In their works, Hippler and coworkers have analyzed and discussed the effect of the race track formation on the generation of NPs. In particular, they have clearly shown that the formation of the race track has an influence on the NP size and synthesis rate.[Reference Ganeva, Pipa and Hippler19, Reference Rai, Mutzke, Bandelow, Schneider, Ganeva, Pipa and Hippler20] Note that the synthesis rate is referred to the number of NPs that are formed into the aggregation zone (by unit time) and the deposition rate to the number of NPs that are collected (by unit time and surface) outside the aggregation zone (typically on a flat surface). While the deposition rate can be precisely measured by atomic force microscopy (AFM), for example, the synthesis rate is hardly measurable inside the aggregation zone. In that sense, the synthesis rate is proportional to the deposition rate that in turn depends on the sticking coefficient of the NPs on the chosen surface (Silicon wafer, TEM grid, etc.). In Fig. 2, we illustrate the effect of the race track formation on the synthesis rate of gold NPs. Both curves represent the evolution of the ion current (that is proportional to the number of fabricated NPs) measured with a quadrupole mass filter in the case of a new and flat gold target (upper curve) and for a used target where the race track is well formed (bottom curve). In both cases, all operation parameters were kept identical (applied power, gas fluxes, target thickness, aggregation length, etc.). As can be clearly observed, the flat target allows the production of a more intense NP beam that is nearly one order of magnitude more intense than for the used target. Note that in terms of mass loss, the used target has approximately 95% of the mass of the new target which means that the useful proportion of the target is no more than 5%. Although the target can be used on both sides (which allows its 10% mass use), it clearly appears that the usage of a sputtering target in a SGAS is very low. Most importantly, the evolution of the target morphology that affects the sputtering yield has also an effect on the size of the NPs that drastically limits the stable production of well-controlled NPs to short periods of time (tens of minutes typically).
Comparison of ion current (that is proportional to NP fabrication rate) as a function of NP diameter, measured from a new and flat magnetron target (upper curve) and from a used (with race track) target.

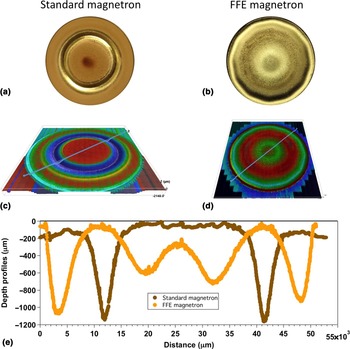
In order to overcome the instabilities generated by the race track formation, we have developed in collaboration with Nano4Enegy SLNE a FFE magnetron adapted to our standard 2″ SGAS. The FFE magnetron is based on the movement of the magnets in order to sweep the whole surface of the target. Although this concept is not new in standard sputtering processes[Reference De Bosscher and Lievens21] (http://www.gencoa.com/circular-ffe), the challenge we faced was to reduce its size to fit it in a standard NP source and to test its validity for the generation of NPs. The new FFE magnetron developed in collaboration with Nano4Enegy SLNE was fitted in a standard aggregation zone and mounted with a gold 2″ target for testing. Figure 3 compares the surface morphology of two targets, one used in a standard magnetron (left side) and the other in the developed FFE magnetron (right side). The target used in the FFE magnetron has been operated during more than 12 h at an average power of 90 W and its weight consumption is approximately 20%. The target used in a standard magnetron has a weight consumption of 5% approximately and has been removed from the NP source when the production rate of NPs reached nearly zero NPs due to the formation of the race track.
Surface images of targets after (a) 5% use in standard magnetron and (b) more than 20% use in a Full Face Erosion magnetron; (c) microscope image of target used in standard magnetron; (d) 3D image of target used in a Full Face Erosion magnetron; (e) depth profiles comparison between targets used in standard magnetron and FFE magnetron. Profiles are performed on lines indicated in Figs. 3(c) and 3(d).

As can be observed in Figs. 3(a) and 3(b), the erosion of both targets is very different. The FFE target displays a much more pronounced erosion close to the center of the target. Note that the erosion of this target did not induce variations neither in the synthesis rate nor in the NP size during its whole operation period. Three-dimensional (3D) microscope images [Figs. 3(c) and 3(d)] also evidence the very different erosion process but the differences in surface morphologies are better appreciated in Fig. 3(e) where we display a depth profile of the targets extracted from the microscope images. In the online Supplementary file S2, we present the animated images of both targets obtained by the numerical reconstruction of the recorded 3D images. Although the design of the FFE magnetron might be improved even more, we have demonstrated for the first time its possible use in a SGAS with the subsequent advantage of stability of NP production over time and extended lifetime of the target.
Thanks to the design of the FFE magnetron, first-order instabilities of the SGAS linked to the racetrack formation have been addressed and solved, which made possible to address second-order instabilities like those associated with traces of gases.
Effect of trace gases in the synthesis of NPs: test-case of water vapor
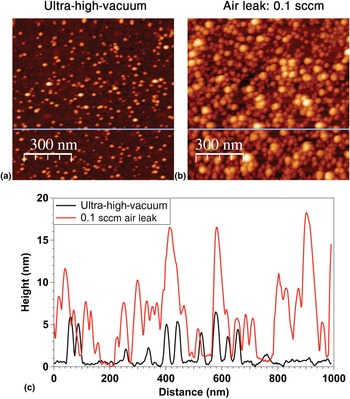
Although the effect of gas traces for the generation of NPs has been reported in several studies, little is understood and both experimental and theoretical studies are needed to fully understand the observed phenomena. For example, it has been demonstrated that controlled doses of oxygen injected into the ICS could increase significantly the synthesis rate of Cu, Ti, Co, and W NPs.[Reference Marek, Valter, Kadlec and Vyskočil22–Reference Polasek, Masek, Marek and Vyskocil24] More recently, it has been also shown that the introduction of H2 or CH4 in small proportions could favor the formation of alloy or CS structure of Mg and Ti.[Reference Krishnan, de Graaf, ten Brink, Persson, Kooi and Palasantzas25] Most of the studies are focused on the deposition rate behavior as gas traces were introduced into the SGAS, and Haberland stated that “…diatomic molecules are very helpful to start the clustering process. Moreover it is observed experimentally that a tiny flow of N 2, O2, CO2, and so on, introduced into the aggregation tube, will lead to much larger clusters…If plastic or Teflon tubing is used in the gas inlet system, this should be regarded with extreme suspicion.”[Reference Huttel3] Hence, it clearly appears that traces of gases can have important effects on the clustering process that induces changes in cluster size and synthesis rates. As an example, we present in Fig. 4 two deposits performed using the FFE magnetron with the same deposition parameters except for the base pressure. Figure 4(a) is an AFM image corresponding to the deposit performed starting from a base pressure less than 8×10⁻⁹ mbar, while Fig. 4(b) corresponds to the deposit performed with a base pressure of 2×10⁻⁶ mbar obtained by injecting in a controlled way (using a mass flow controller) a tiny flow of air (0.1 sccm). Although the proportion of air that was injected into the SGAS represents only 0.12% of the total injected gas (the rest of the gas is 80 sccm of argon), it drastically affects the synthesis rate as the number of NPs in Fig. 4(b) is much higher than in Fig. 4(a) (by approximately a factor of 2.7). While Fig. 4(a) corresponds to a deposit less than a monolayer of NPs (density was found to be 380 NPs/μm2), deposit of Fig. 4(b) has a higher density than a monolayer of NPs that makes the determination of the NPs height (some NPs are lying on top of each other) and density (found to be approximately 1032 NPs/μm2) difficult. Nevertheless, both AFM images and corresponding profile lines displayed in Fig. 4(c) clearly illustrate the effect of gas traces on the synthesis rate for the simple case of Au NPs in the presence of air impurity.
Atomic force microscopy (AFM) images. (a) AFM image of an Au nanoparticles deposit on Si wafer with starting base pressure of 8×10⁻⁹ mbar; (b) similar AFM image of a deposit of Au nanoparticles with starting base pressure of 2×10⁻⁶ mbar due to controlled air leak of 0.1 sccm; (c) line profiles following the lines displayed in Figs. 4(a) and 4(b). Both deposits have been performed with the following parameters: argon flow: 80 sccm; applied magnetron power: 90 W; deposition time: 140 s.

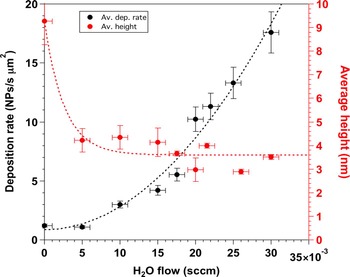
The air is composed of N2 (78.08%), O2 (20.95%), Ar (0.93%), water vapor, and gases in very small concentrations (Ne, Kr, Xe, CO2, CH4, H2). In first approximation, we can therefore consider only the N2, O2, Ar, and water vapor. Since Ar is injected in large amounts in order to generate the plasma, it can also be discarded. While preliminary studies performed injecting controlled amounts of N2 and O2 have not shown evident influence of these gases on the synthesis of gold NPs (results to be published elsewhere), the addition of tiny amounts of water vapor resulted in drastic modifications of both synthesis rate and NP size as can be observed in Fig. 5. Experiments summarized in Fig. 5 were performed using the FFE magnetron in the GAS, i.e., avoiding therefore any influence of the race track formation and evolution upon time. The applied power was 90 W, the argon flux was 80 sccm and no helium was added in the gas mixture. As can be observed in Fig. 5, at the initial stages of water vapor injection (5×10⁻³ sccm), the NP average size (extracted from the log-normal fitting of the height distribution measured by AFM) is drastically reduced from approximately 9 nm (that corresponds to 0 sccm of water vapor) to a value close to 4 nm (red curve in Fig. 5). Note that the injected water vapor represents only 0.6% of the injected gases. Despite such low amount of water vapor, the NP mean size is reduced by a factor close to 2. While higher amounts of water vapor do not modify substantially the NP mean size, the effect on the deposition rate is very important as it is increased by a factor of approximately 15 (black curve in Fig. 5). These results clearly show that the presence of small amounts of water molecules in the SGAS has important effects in the synthesis of gold NPs and it is inferred that such effects could also be crucial in the synthesis of NPs of other metals. Inversely, the progressive diminution of water molecules concentration in the residual vacuum that will occur with time as the vacuum pumps continuously remove the water molecules from the vacuum vessel could explain the experimentally observed decrease of NP deposition rate upon time. Also, it is expected that upon running time, the aggregation zone will be depleted from water molecules which will induce a decrease in the synthesis rate of NP, as the group of Faupel and coworkers reported.[Reference Peter, Polonskyi, Gojdka, Ahadi, Strunskus, Zaporojtchenko, Biederman and Faupel23] Hence, it clearly appears that ultra-high-vacuum conditions are not sufficient to avoid evolutions of synthesis rates and NP size in SGAS, but that a precise monitoring and adjustment of the gas traces in the aggregation zone are necessary for a fine control of the NP synthesis.
Evolution of the deposition rate and mean height of Au NPs as a function of the injected flow of water vapor.

More experimental studies in combination with theoretical simulation are needed to unravel the mechanisms that govern the tuning of the size and synthesis rate of the gold NPs as a function of water concentration and other gases in the gas mixture. In particular, seed effect and/or heat dissipation mechanism could be responsible and need to be identified to allow a better understanding of the effect of gas traces addition on the synthesis of NPs.
Conclusions
We have presented recent developments in the synthesis of NPs by the gas-phase approach using the magnetron sputtering. The MICS that is based in the replacement of the standard single magnetron by three independent magnetrons has been developed in order to widen the spectrum of possible NPs that can be fabricated. In that way, single element, alloyed, and CS NPs can be synthesized in a single step while keeping control on the stoichiometry, diameter, core diameter, and shell thickness. Thanks to this design, NPs not accessible by chemical routes can be fabricated as chemical reactions are not involved in the synthesis.
The FFE magnetron adapted to the SGAS has been also presented. Such design eliminates the known fluctuations in terms of NP size and synthesis rate as the erosion of the target is more uniform and the racetrack formation is avoided. Hence the synthesis of NPs is much more stable and the lifetime of the target is prolonged. Both facts open the use of SGAS in industrial applications.
Finally, we address the other origin of instability of the SGAS that is related to the residual gases present in the vacuum vessel. We show that tiny traces of water vapor can drastically modify the fabrication of gold NPs in terms of NPs size and synthesis rate. More studies are needed in order to understand the mechanisms that are involved but our results clearly show that a stable fabrication of NPs is related to the control of the residual gases in the vacuum vessel.
Supplementary material
The supplementary material for this article can be found at https://doi.org/10.1557/mrc.2018.169
Acknowledgments
Funding from MINECO under grants no MAT2011-29194-C02-02 and MAT2014-59772-C2-2-P is acknowledged. ERC-2013-SyG 610256 NANOCOSMOS is also acknowledged.