


Introduction
Glucose metabolism changes as oocytes grow in the follicle and the activity of glucose-6-phospatate dehydrogenase (G6PDH) decreases as oocytes attain their maximum size. The activity of G6PDH in oocytes can be shown by staining with brilliant cresyl blue (BCB): this simple method has been used for cows (Alm et al., Reference Alm, Torner, Löhrke, Viergutz, Ghoneim and Kanitz2005; Janowski et al., Reference Janowski, Salilew-Wondim, Torner, Tesfaye, Ghanem, Tomek, El-Sayed, Schellander and Hölker2012; Castaneda et al., Reference Castaneda, Kaye, Pantaleon, Phillips, Norman, Fry and D'Occhio2013; Silva et al., Reference Silva, Rodriguez, Galuppo, Arruda and Rodrigues2013), sheep (Mohammadi-Sangcheshmeh et al., Reference Mohammadi-Sangcheshmeh, Held, Ghanem, Rings, Salilew-Wondim, Tesfaye, Sieme, Schellander and Hoelker2011; Wang et al., Reference Wang, Lin, Huang, Wang, Zhao and Chen2012) and pigs (Ishizaki et al., Reference Ishizaki, Watanabe, Bhuiyan and Fukui2009) to select for oocytes that have greater developmental competence. In addition, oocytes determined as competent by BCB staining have higher levels of adenosine triphosphate (ATP; Catalá et al., Reference Catalá, Izquierdo, Rodríguez-Prado, Hammami and Paramio2012) and mitochondrial content (Catalá et al., Reference Catalá, Izquierdo, Uzbekova, Morató, Roura, Romaguera, Papillier and Paramio2011) compared with oocytes that were deemed non-competent. However, some studies have reported that BCB staining itself can exert adverse effects on oocytes. Exposure of porcine oocytes to a BCB solution has been found to change the levels of mRNA and proteins that are responsible for successful fertilization (Kempisty et al., Reference Kempisty, Jackowska, Piotrowska, Antosik, Woźna, Bukowska, Brüssow and Jaśkowski2011) and to induce chromosomal aberrations (Pawlak et al., Reference Pawlak, Pers-Kamczyc, Renska, Kubickova and Lechniak2011). Although BCB-positive oocytes have a higher ability to develop to the blastocyst stage than BCB-negative oocytes, the ratio for BCB-positive oocytes was similar to that for oocytes that had not been subjected to BCB staining (Wongsrikeao et al., Reference Wongsrikeao, Otoi, Yamasaki, Agung, Taniguchi, Naoi, Shimizu and Nagai2006). Moreover, other studies have observed no significant differences in developmental competence between BCB-positive and control oocytes (Ishizaki et al., Reference Ishizaki, Watanabe, Bhuiyan and Fukui2009; Mohammadi-Sangcheshmeh et al., Reference Mohammadi-Sangcheshmeh, Held, Ghanem, Rings, Salilew-Wondim, Tesfaye, Sieme, Schellander and Hoelker2011). These results raise the possibility that BCB staining is toxic to oocytes. Brilliant cresyl blue is reduced to a colourless state by NADPH in oocytes, thus the reductive ability of oocytes, which is essential for scavenging potentially harmful free radicals, may be diminished by BCB staining.
It is well known that reactive oxygen species (ROS) can cause mitochondrial damage in oocytes (Zhang et al., Reference Zhang, Liu, An, Huang, Qi and Zhang2011; Ge et al., Reference Ge, Tollner, Hu, Da, Li, Guan, Shan, Lu, Huang and Dong2012). However, no report to date has examined the effect of BCB staining on mitochondrial function in oocytes. To address this question, the effects of BCB staining on porcine oocyte development and mitochondrial function were examined. The ROS levels, ATP content, mitochondrial membrane potential (MMP), and mitochondrial DNA (mtDNA) copy number were determined in oocytes immediately following BCB treatment and after a maturation period and compared with values obtained from untreated control oocytes. In addition the ATP content in early developmental stage embryos derived from oocytes stained with BCB were compared with embryos derived from oocytes not subjected to BCB staining.
Materials and methods
Chemicals and media
All chemicals were purchased from Nacalai Tesque (Kyoto, Japan) unless otherwise indicated. The medium used for in vitro maturation (IVM) was North Carolina State University 37 (NCSU37) solution (Petters & Wells, Reference Petters and Wells1993) supplemented with l-cysteine (0.6 mM) and follicular fluid (10% v/v). The medium used for oocyte washing and ROS and membrane potential measurement was NCSU37 without follicular fluid but that contained 0.1% bovine serum albumin (BSA). Media used for pathenogenic activation and for IVC were based on PZM4 (Yoshioka et al., Reference Yoshioka, Suzuki, Tanaka, Anas and Iwamura2002).
Oocyte collection and maturation
Ovaries of pre-pubertal gilts (LWD-pig, 6 months old) were collected at a local slaughterhouse and transported within 1 h to the laboratory at 37°C in phosphate-buffered saline (PBS) that contained 10 IU/ml penicillin G and 0.1 g/ml streptomycin sulphate. Cumulus–oocyte complexes (COCs) were collected from follicles (3–6 mm in diameter) on the surface of ovaries using a 10 ml syringe connected to an 18G needle. For the first 20 h of the maturation period, the oocytes were cultured in IVM medium that contained 1 mM dibutyryl cAMP (dbcAMP; Sigma Chemical Co., St. Louis, USA), 10 IU/ml equine chorionic gonadotropin (eCG; ASKA Pharma Co. Ltd, Tokyo, Japan), and 10 IU/ml human chorionic gonadotropin (hCG; Fuji Pharma Co. Ltd, Tokyo, Japan). The oocytes were then transferred to a maturation medium covered by paraffin oil (10 oocytes/100 μl drop, NUNC A·S, Roskilde, Denmark) that lacked both dbcAMP and the hormones, and cultured for 24 h at 38.5°C in an atmosphere of 5% CO2 and 95% air.
Brilliant cresyl blue staining and chromatin configuration
The COCs were cultured in an IVM medium free of amino acids and glucose that contained 1 mM of pyruvic acid, 0.1% BSA, and 13 μM BCB (B5388; Sigma–Aldrich, St. Louis, MO, USA) for 1 h. The oocytes were washed before use in subsequent experiments. The first experiment was conducted to validate whether the BCB-staining methods used enabled the selection of more developed oocytes. Based on colouration from BCB staining, oocytes were sorted into two groups: BCB positive, having a strong blue colour, and BCB negative, having faint or no colour. The oocytes were denuded, fixed in 4% paraformaldehyde and permeabilized for 30 min in PBS that contained Triton X-100. The oocytes were mounted with an antifade reagent that contained 4’,6-diamidino-2-phenylindole (DAPI; ProLong® Gold Antifade Reagent with DAPI, Invitrogen, OR, USA) on glass slides. The chromatin configuration of the oocytes was then examined under a microscope (Olympus, Tokyo, Japan). As previously described by Sun et al. (Reference Sun, Liu, Yue, Ma and Tan2004), chromatin condensation is correlated with oocyte growth, and highly competent oocytes have a more condensed chromatin configuration (Sun et al., Reference Sun, Liu, Yue, Ma and Tan2004). Oocytes were thus assigned to one of three categories according to the previous descriptions of chromatin configuration, with slight modifications. Category І consisted of oocytes that had germinal vesicles, with the condensed chromatin forming a ring or horseshoe around the nucleolus. Category II oocytes had a few chromatin clusters at the nuclear membrane. Category III oocytes had non-condensed chromatin distributed throughout the nucleoplasm. Thirty oocytes were categorized using BCB staining and repeated using oocytes from differential ovaries series.
Measurement of ROS levels
Levels of ROS in oocytes immediately after BCB staining or after in vitro maturation were measured using ROS Detection Reagents (Life Technologies Corporation, Carlsbad, CA, USA) in accordance with the manufacturer's instructions. In this assay, dihydrocalcein, AM permeates the oocyte cell membrane and is oxidized to emit green fluorescence. Fluorescence was observed under a fluorescence digital microscope (Keyence, BZ-8000, Tokyo, Japan), and the fluorescence intensity of each pixel was transformed to obtain a quantitative measure using Image-J software (NIH, Bethesda, MD, USA). Experiments were conducted twice, using 20–25 oocytes derived from differential ovaries series, and fluorescence intensities of 40–50 oocytes in total per group were used for comparison.
Measurement of ATP content in oocytes and early developmental stage embryos
The effect of BCB staining on ATP content in individual oocytes was examined immediately after staining, after in vitro maturation and 3 days after activation. The ATP content was measured as the luminescence generated in an ATP-dependent luciferin–luciferase bioluminescence assay (ATP assay kit; Tokyo Inc., Tokyo, Japan) as described previously by Iwata et al. (Reference Iwata, Goto, Tanaka, Sakaguchi, Kimura, Kuwayama and Monji2011). For each sample, individual oocytes were added to 50 μl distilled water. The luminescence was measured immediately using a luminometer (Gene Light 55; Microtech, Chiba, Japan). The experiment was performed at least twice with 30 oocytes or embryos in each group for each experiment, and ATP content was compared between the two oocyte groups.
Oocyte activation
The oocytes were activated in the culture medium that contained ionomycin (10 μg/ml) and then incubated for 6 h in culture medium that contained cytochalasin B (10 μg/ml) and cycloheximide (10 μg/ml). After the incubation, oocytes were washed, transferred into a culture drop (10 oocytes/50 μl) and incubated for 3 days. In vitro culture was performed at 38.5°C in atmosphere of 5% CO2 and 5% O2 and 90% N2.
Measurement of mitochondrial membrane potential (MMP)
Mitochondrial membrane potential was measured immediately following BCB staining and after in vitro maturation. Oocytes were cultured for 30 min in NCSU37 medium that contained 0.5 μM MitoTracker Orange (Life Technologies Corporation, Carlsbad, CA, USA) a fluorescent indicator of mitochondrial activity. After staining, oocytes were washed and mounted on a slide, and fluorescence intensity was measured using a fluorescence digital microscope (Keyence, BZ-8000, Tokyo, Japan). The measurement was converted to pixel counts using ImageJ software (NIH, Bethesda, USA). Experiments were performed in duplicate using 50 oocytes in each group for each experiment, and total fluorescence intensity was compared between the two oocyte groups.
Measurement of mtDNA copy number
Preliminary observations suggested that the mtDNA copy number varied considerably among oocytes and donor gilts. However, the mean mtDNA copy number determined for a group of 10 oocytes was similar to the value obtained for 10 cohort oocytes collected from the same donor (r = 0.746, P < 0.01). A similar trend has been observed in cows (Iwata et al., Reference Iwata, Goto, Tanaka, Sakaguchi, Kimura, Kuwayama and Monji2011). Therefore, 20 oocytes were collected from a single donor and divided into two groups, with one group of 10 oocytes cultured without BCB and the other with 13 μg/ml BCB for 60 min. After in vitro maturation, mtDNA copy number was compared between BCB-stained and control oocytes (not subjected to BCB staining). In the comparison, 15 gilts were used. The DNA extraction and polymerase chain reaction (PCR) amplification were conducted according to methods described previously by Iwata et al. (Reference Iwata, Goto, Tanaka, Sakaguchi, Kimura, Kuwayama and Monji2011). To obtain the mtDNA copy number, mtDNA was amplified by real-time PCR using a Rotor-Gene 6500 real-time rotary analyser (Corbett Research, Sydney, Australia) with the primer set 5′-CGAGAAAGCACTTTCCAAGG-3′ and 5′-CTAATTCGGGTGTTGGTGCT-3′ and MESA Blue qPCR MasterMix Plus for SYBR Assay (Eurogentec, Liège, Belgium). The primers were designed using Primer3Plus (http://sourceforge.net/projects/primer3/) and a porcine mtDNA sequence (accession no. AF304202; from base 8744 to base 8914, 151 bp). PCR was performed with an initial denaturation at 95°C for 5 min, followed by 40 cycles of 95°C, 58°C and 72°C for 20 s at each temperature. A standard curve was generated for each run using 10-fold serial dilutions that represented copies of the external standard, which was the PCR product of the corresponding gene cloned into a vector using the Zero Blunt TOPO PCR cloning kit (Invitrogen, Carlsbad, USA). Data from the two trials in which the amplification efficiencies were <1.9 were discarded.
Statistical analysis
The distribution of chromatin configuration and cleavage ratio of embryos were analysed by chi-squared test, and comparison of mean difference between BCB-treated oocytes and BCB-untreated oocytes (not subjected to BCB staining) were conducted using Student's t-test. Pearson's correlation was calculated using IBM SPSS ver. 21 (Statistical Package for the Social Sciences, SPSS Inc., Chicago, IL). Differences were considered significant at a P-value <0.05.
Results
BCB-positive oocytes had advanced chromatin configuration
A higher fraction of BCB-positive oocytes was assigned to Category I as compared with that of BCB-negative oocytes (Table 1). Based on the results, it was concluded that current BCB staining properly separated the oocytes.
Chromatin configuration of oocytes categorized based on brilliant cresyl blue (BCB) staining

a ,b P < 0.05. Oocytes were divided into three categories based on chromatin configurations. About 30 oocytes were subjected to BCB staining and the experiment was conducted twice.
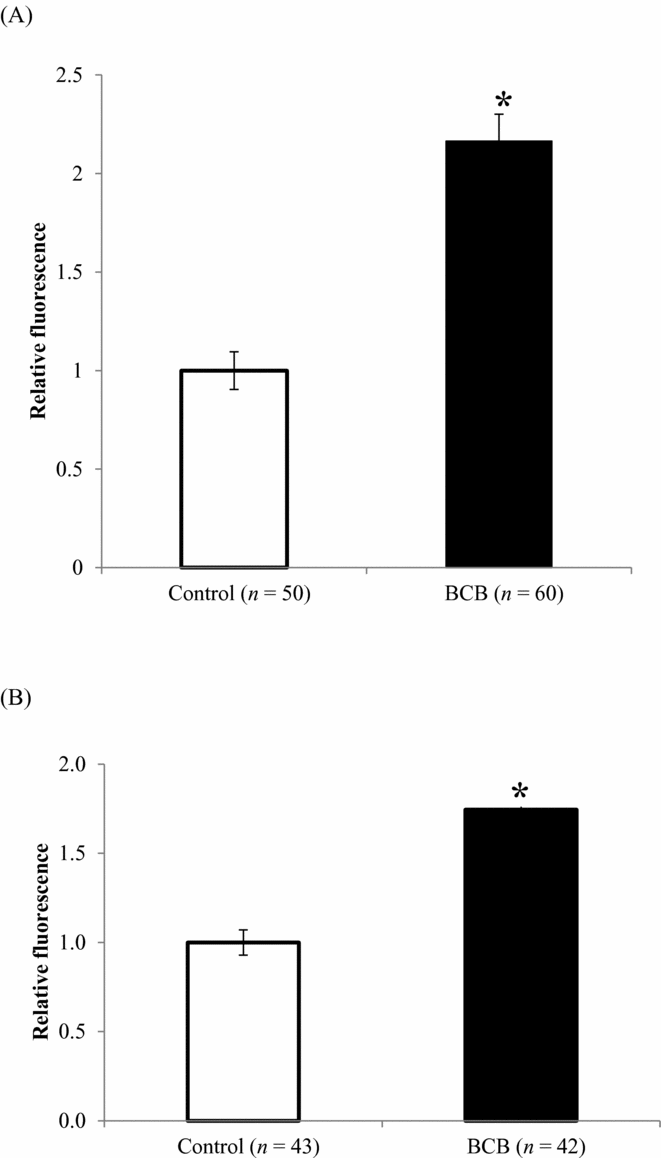
Mitochondrial function in oocytes is altered by BCB staining
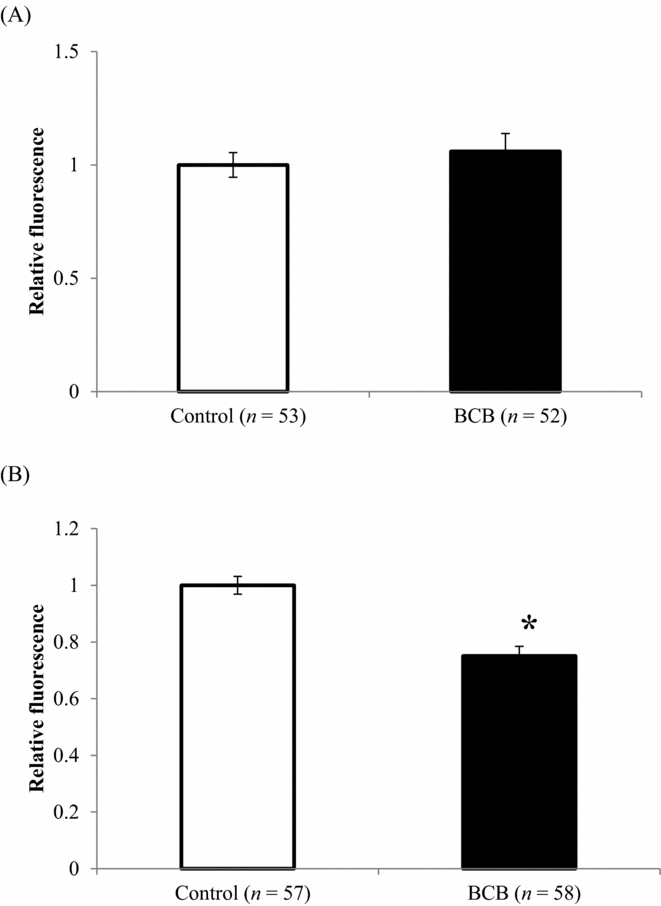
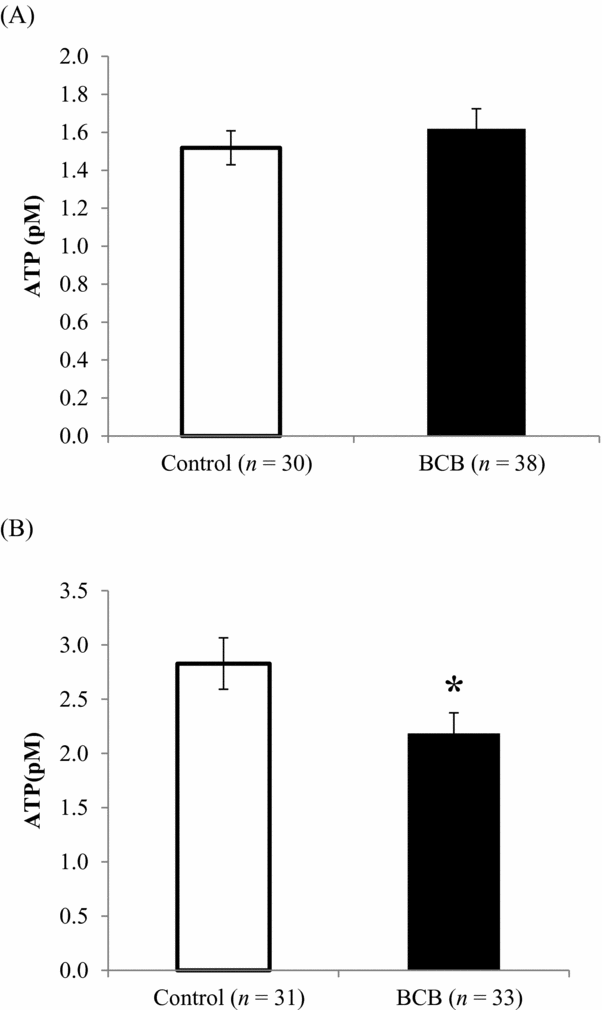
Immediately after BCB staining and after in vitro maturation (44 h after BCB staining), levels of ROS were higher for BCB-stained oocytes than for untreated controls (Fig. 1 A,B). The proportion of mitochondria with active membrane potentials was also affected by BCB staining, such that the relative MMP in in vitro-matured BCB-stained oocytes was 18% lower compared with that of control-matured oocytes (Fig. 2 B), although there was no difference between the two groups immediately after BCB treatment (Fig. 2 A). Similarly, there was no difference in ATP content between BCB-treated and control oocytes immediately after staining (1.52 versus 1.62 pM; Fig. 3 A), whereas ATP content in in vitro-matured BCB-treated oocytes was significantly lower than that in control oocytes (2.18 pM versus 2.83 pM, P > 0.05; Fig. 3 B). When the oocytes were activated and cultured for 3 days, there was no difference between the cleaved ratio (≥2-cell stage) between the BCB-treated groups and the control group (embryos derived from oocytes not subjected to BCB staining). The ATP content in early developmental stage embryos was still lower for the BCB-treated group than that for the control group, but the difference was not significant (P = 0.24, Table 2).
ATP content in early developmental stage embryos derived from oocytes stained with brilliant cresyl blue (BCB)
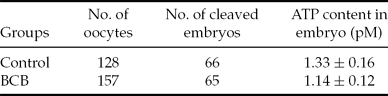
About 30 embryos were used for ATP measurement and the experiment was conducted three times. Average ATP of total embryos was compared between the two groups. P = 0.24.
ROS (mean ± standard error of the mean (SE)) levels in oocytes (A) immediately after BCB staining, and (B) after in vitro maturation for 44 h. The mean fluorescence intensity of oocytes that were not stained with BCB was defined as 1.0. *P < 0.05. Y-axis: mean fluorescence of control was defined as 1.0.
MMP (mean ± standard error of the mean (SE)) in oocytes (A) immediately after BCB staining, and (B) after in vitro maturation for 44 h. *P < 0.05. Y-axis: mean fluorescence of control was defined as 1.0.
ATP levels (mean ± standard error of the mean (SE)) in oocytes (A) immediately after BCB staining, and (B) in vitro maturation for 44 h. *P < 0.05.
mtDNA copy number in BCB-stained oocytes
A comparison of mtDNA copy number of BCB-stained and untreated cohort oocytes is shown in Fig. 4 A. The mtDNA copy number was highly variable among gilt donors, ranging from 82,383 to 299,817 copies. When the mean mtDNA copy number of total oocytes was compared between BCB-stained and untreated oocytes, the difference was not statistically significant (161,787 versus 145,368, P > 0.05; Fig. 4 B). There was a strong correlation between mtDNA copy numbers of BCB-treated and BCB-untreated cohort oocytes derived from the same donor (r = 0.74, P < 0.001; Fig. 4 C). However, when the ratio of mtDNA copy number of BCB-stained oocytes to mtDNA copy number of control oocytes was calculated, the mean ratio ± SEM was 1.18 ± 0.07, which was significantly greater than 1.0, indicating that BCB staining increased the mtDNA copy number.
mtDNA copy number in in vitro-matured oocytes following BCB staining. (A) mtDNA copy numbers (mean ± standard error of the mean (SE)) of BCB-stained and control oocytes. (B) mtDNA copy numbers (mean ± SE) of BCB-stained and untreated cohort oocytes (Control) collected from a single donor. Each set of black and white bars represent average Mt-number of oocytes collected from individual donor. Y-axis: Mt-number, X-axis: individual sample number and its relative value of Mt-number (BCB)/Mt-number (Control). (C) Relationship between mtDNA copy number in control oocytes (X-axis) and that in BCB-stained oocytes (Y-axis). Dots represent individual donors and 15 gilts were used in this comparison.

Discussion
The current study is the first detailed investigation of the effects of BCB staining on mitochondrial function in oocytes. The results demonstrate that mitochondrial functions in oocytes are affected by BCB treatment and although the effect continues during oocyte maturation, it diminishes until early developmental stage embryos.
Staining with BCB has been used to select for oocytes with high developmental competence based on the activity of G6PDH (Mohammadi-Sangcheshmeh et al., Reference Mohammadi-Sangcheshmeh, Held, Ghanem, Rings, Salilew-Wondim, Tesfaye, Sieme, Schellander and Hoelker2011; Mirshamsi et al., Reference Mirshamsi, Karamishabankareh, Ahmadi-Hamedani, Soltani, Hajarian and Abdolmohammadi2013). However, it has been suggested that BCB staining is ineffective for equine oocyte selection (Pereira et al., Reference Pereira, Lorenzo, Carneiro, Bilodeau-Goeseels, Kastelic, Esteller-Vico, Lopez-Bejar and Liu2013) and that it may adversely affect the intrinsic character of porcine oocytes by altering the levels of proteins responsible for fertilization (Kempisty et al., Reference Kempisty, Jackowska, Piotrowska, Antosik, Woźna, Bukowska, Brüssow and Jaśkowski2011). Brilliant cresyl blue is oxidized in oocytes, producing a strong blue colour; decolouration depends on NADPH produced via the pentose phosphate pathway. The present study showed for the first time that oocytes cultured with BCB generated high levels of ROS immediately after staining and even after 44 h of culture, indicating that BCB staining negatively affects the redox state in oocytes and that this effect is persistent. Mitochondria are responsible for the regulation of redox homeostasis (Kang & Pervaiz, Reference Kang and Pervaiz2012); it was therefore important to determine whether BCB staining affects mitochondrial function in oocytes.
It was observed in the current study that following a period of in vitro maturation, the ATP content in oocytes increased with respect to the initial level at the germinal vesicle stage, supporting previous findings in cattle (Stojkovic et al., Reference Stojkovic, Machado, Stojkovic, Zakhartchenko, Hutzler, Gonçalves and Wolf2001). Interestingly, MMP and ATP content were lower in in vitro-matured oocytes stained with BCB than in untreated oocytes. Mitochondrial membrane potential increases with oocyte maturation and is thus higher in in vitro-matured oocytes, reflecting a greater degree of competence (Fujii & Funahashi, Reference Fujii and Funahashi2009). A high MMP is also required for proper cortical granule exocytosis (Van Blerkom & Davis, Reference Van Blerkom and Davis2007). Adenosine triphosphate is a determining factor for successful fertilization of bovine oocytes, and oocytes cultured in an optimal maturation medium contained higher levels of ATP than those cultured in a suboptimal medium; furthermore, disruption of the mitochondrial electron transfer by rotenone reduced the ATP content and positive fertilization outcomes (Somfai et al., Reference Somfai, Inaba, Watanabe, Geshi and Nagai2012). Therefore, the lower MMP and ATP levels observed in the present experiments as a result of BCB treatment are indicative of compromised mitochondrial function, which could ultimately affect following developmental ability of the oocytes.
In contrast, there was a strong correlation between mean mtDNA copy numbers of BCB-treated and control oocytes, indicating that oocytes retain a similar character within individual donors even after BCB staining. Interestingly, the ratio of mtDNA copy number in BCB-stained oocytes to the copy number of controls was significantly >1.0. In light of the evidence that MMP and ATP levels were decreased by BCB treatment while mtDNA copy number increased, it can be inferred that BCB staining reduces the overall quality of mitochondria and the impaired mitochondrial quality stimulates de novo synthesis of mitochondria. Mitochondrial homeostasis involves a balance between synthesis and degradation (Weber & Reichert, Reference Weber and Reichert2010). Based on the findings of Weber & Reichert (Reference Weber and Reichert2010) and the results from the current study, it is suggested that, in oocytes subjected to BCB treatment, mitochondrial damage or a low ATP content may enhance mitochondrial biogenesis and result in the accumulation of low quality mitochondria. In addition, early-stage embryos derived from BCB-stained oocytes still had low ATP contents compared with embryos derived from control oocytes but the difference was not significant, a finding that suggested that the damaged mitochondria were partly restored during early embryonic development.
In conclusion, BCB staining can have potentially damaging effects on oocytes as a result of the increased production of ROS, a lowering of the MMP and compromised ATP production; however, further studies beyond the early developmental stages are required in order to determine whether these effects can ultimately undermine embryonic development.
Acknowledgements
This work was supported by JSPS KAKENHI Grant Number 25450400.



