1 Introduction
Text-to-speech (TTS) synthesis is an emerging technology with many important applications in next-generation information systems (Klatt Reference Klatt1987; Dutoit Reference Dutoit1997; Zue and Glass Reference Zue and Glass2000; Holmes and Holmes Reference Holmes and Holmes2001). A crucial limitation for any TTS system is the problem of automatically generating acceptable pronunciations from text input, i.e., transcribing letters to sound. The most obvious and effective approach is simply to look up pronunciations of input words—or, perhaps, morphemes after morphological decomposition—in a dictionary. This will work very well, but only provided the word is actually in the dictionary. However, it is impractical (strictly, impossible) to store all the words of the language, since this constitutes an open set. Thus, the dictionary approach cannot be a complete or sufficient solution to this problem; some ‘backup’ procedure is needed for words not in the dictionary. The usual approach to is to employ a set of phonological (letter-to-sound, or text-to-phoneme) rules written by a linguist or phonetician, with expert knowledge of the target language, as a backup or secondary strategy to the primary strategy of dictionary look-up.
Clearly, this knowledge-based approach is highly language-specific, and has to be redone at some expense for each new language (Sproat, Möbius, Maeda and Tzoukermann Reference Sproat, Möbius, Maeda, Tzoukermann and Sproat1998: 75). We also expect the difficulty of the task of writing appropriate rules to vary according to the complexity of the relationship between pronunciation and orthography in each specific language. This is generally taken to vary across a deep/shallow continuum (Coltheart Reference Coltheart and Underwood1978; Liberman, I., Liberman, A., Mattingly and Shankweiler Reference Liberman, Liberman, Mattingly, Shankweiler, Kavanagh and Venezky1980; Katz and Feldman Reference Katz, Feldman, Lesgold and Perfetti1981; Turvey, Feldman and Lukatela Reference Turvey, Feldman, Lukatela and Henderson1984; Sampson Reference Sampson1985). For languages like English or French whose writing system is generally agreed to be ‘deep’, there is a supposedly complex relation between spelling and sound, lacking consistency and transparency, unlike the ‘shallow’ orthographies of Finnish or Serbian, for example, where the correspondence is mostly if not entirely consistent and transparent. (By ‘consistency’, we mean that the same letter always corresponds to the same phoneme. By ‘transparency’, we mean that a single letter corresponds to a single phoneme and vice versa.) Thus, we expect that automatic pronunciation will be particularly difficult for English, and it will be correspondingly difficult to write phonological rules for this language. However, it does seem to be relatively easier to write consistent and transparent rules to convert spelling into sound for languages such as Spanish and Italian.
Unfortunately, there is good evidence that manually written letter-to-sound rules work very poorly, certainly for English. Damper, Marchand, Adamson and Gustafson (Reference Damper, Marchand, Adamson and Gustafson1999) compared the performance of rules (those of Elovitz, Johnson, McHugh and Shore, Reference Elovitz, Johnson, McHugh and Shore1976) with three alternative data-driven methods, which infer the pronunciation of unknown words from a set of known spelling–pronunciation pairs. Data-driven (or ‘machine learning’) methods can be usefully classified as eager or lazy (Aha Reference Aha1997; van den Bosch, Weijters, van den Herik and Daelemans Reference van den Bosch, Weijters, van den Herik and Daelemans1997): the former attempt to compress the learning data into a small set of regularities in a prior training phase, whereas the latter aim to retain the training data in their entirety (as far as possible). The data-driven methods studied were the eager approach of neural networks (McCulloch, Bedworth and Bridle Reference McCulloch, Bedworth and Bridle1987), and two more or less lazy approaches: a decision-tree method IB1-IG (Daelemans, van den Bosch and Weijters Reference Daelemans, van den Bosch and Weijters1997; van den Bosch Reference van den Bosch1997) and pronunciation by analogy (PbA), with the latter being rather lazier than the former. It was found that the data-driven methods outperformed rules by an enormous margin; these techniques are increasingly seen as making rule-based transcription obsolete (Damper Reference Damper2001). A further potential advantage is that they are highly portable between different languages, only provided a database (or lexicon) of words and their pronunciations is available. All that is necessary is to change the lexicon that acts as the source of example pronunciations. Retraining may or may not be necessary, depending upon how lazy the learner is.
Damper et al. (Reference Damper, Marchand, Adamson and Gustafson1999) found that the most successful by some margin of the three data-driven methods they studied was PbA. This very pure form of lazy learning exploits the phonological knowledge implicit in the system dictionary of known words to infer a pronunciation for an unknown word as follows. It computes different ways of assembling the input word from fragments of partially matching letter substrings and their corresponding partial pronunciations, and chooses between these candidate pronunciations according to some objective criterion. To date, many variants of PbA have been proposed and evaluated, mostly for English; however, the success of PbA for multilingual pronunciation generation has not been seriously assessed. Hence, one goal for this paper is to study PbA performance on multilingual transcription as a way of quantifying the variation of difficulty of the task across languages, and gaining insight into manifestations of the deep/shallow continuum. We select PbA for this study just because of its well-documented superior performance in the Damper et al. (Reference Damper, Marchand, Adamson and Gustafson1999) evaluations.
Since PbA uses a dictionary of example spellings and pronunciations as its knowledge base, an important question is what size of dictionary we should employ in a text-to-speech system. Intuitively, we might feel that the larger it is, the better. However, large dictionaries are expensive to compile, lead to an increase in processing time, and may not exist for all languages that we wish to synthesize, especially minority languages. Also, there are inherent dangers in extrapolating from results on a small database or dictionary to asymptotic performance on a very large dictionary. A few years ago, Baayen (Reference Baayen2001: xxxi) wrote:
Word frequency distributions are characterized by very large numbers of rare words. This property leads to strange phenomena such as mean frequencies that systematically keep changing as the number of observations is increased, relative frequencies that even in large samples are not fully reliable estimators of population probabilities, and model parameters that vary as functions of the text size.
The problems that this phenomenon (called ‘large numbers of rare events, or LNRE) can cause for speech synthesis have often gone unrecognized or underestimated (Möbius Reference Möbius2003). For instance, early developers of rule-based letter-to-sound systems tested on small data sets and assumed that error rates would be independent of test set size, leading to dramatic overestimates of performance (Damper et al., Reference Damper, Marchand, Adamson and Gustafson1999). With the increased interest in data-driven approaches (Damper Reference Damper2001), an important issue becomes the sizes of the training and test sets if, as Baayen says, model parameters are a function of corpus size. So although it is likely, and some preliminary results from Damper et al. (Reference Damper, Marchand, Adamson and Gustafson1999, Fig. 1) suggest it is the case, it is by no means certain that ‘bigger is better’. As Banko and Brill (Reference Banko and Brill2001: 26) write in respect of data-driven natural language processing (NLP) tasks in general: ‘one has to wonder what conclusions that have been drawn on small data sets may carry over when . . . learning methods are trained using much larger corpora’.
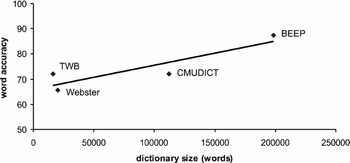
Variation of word accuracy with dictionary size for English letter-to-phoneme transcription, showing best-fit regression line.

Given this background, our purposes for this paper are twofold.
(1) To evaluate pronunciation by analogy on a range of different languages, so as to quantify the variation of transcription difficulty across the deep/shallow continuum of orthography.
(2) Also, to explore the effect of lexicon size on performance for multilingual transcription using PbA.
Specifically, we have investigated the performance of PbA applied to seven European languages—Dutch, English, French, Frisian, German, Norwegian, and Spanish—with twelve different lexicons. Also, we artificially varied the size of (some of) these lexicons by evaluating transcription accuracy on different subsets of the complete dictionary.
The remainder of this paper is structured as follows. In the next section, the dictionaries used in this work are detailed. In Section 3, we briefly describe the principles of pronunciation by analogy. In Section 4, we set out the various evaluations of transcription accuracy that have been performed. Results are detailed in Section 5. Discussion and conclusions are presented in Section 6.
2 Lexical databases
The lexicons used in this work are all available for download at http://www.pascal-network.org/Challenges/PRONALSYL/Datasets/. We have used the automatically aligned versions for seven European languages: Dutch, English, French, Frisian, German, Norwegian, and Spanish. In total, twelve different dictionaries are used in this work. For French, we have used Lexique, Brulex, and Novlex. For English, we have used the British English Example Pronunciation (BEEP) dictionary, CMUDICT from Carnegie-Mellon University, Webster's, and Teachers' Word Book (TWB). The phoneme sets used for these lexicons are different, even for the same language. For the other five languages, there is only one lexicon per language. The letters and phonemes in all dictionaries are automatically aligned using the algorithm of Damper, Marchand, Marsters and Bazin (Reference Damper, Marchand, Marsters and Bazin2005b), except in the case of Webster's, used in Netspeak (McCulloch et al. Reference McCulloch, Bedworth and Bridle1987), which were manually aligned by the original authors. Since most of these dictionaries do not include stress and/or syllable boundary markers, these aspects of the transcription task have had to be ignored, in spite of their obvious importance.
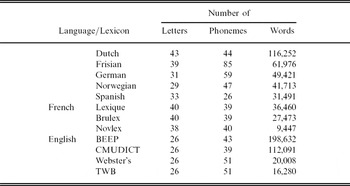
Table 1 details the number of letter, phoneme, and word types in each dictionary. It can be seen that there is wide variation in the phoneme inventory, not only between languages, but also between different dictionaries for the same language.
Numbers of letter, phoneme, and word types in each dictionary

3 Principles of pronunciation by analogy
Pronunciation by analogy is a data-driven technique for converting spelling to sound that is attracting increasing attention as an automatic pronunciation method for text-to-speech (TTS) synthesis (e.g., Dedina and Nusbaum, Reference Dedina and Nusbaum1991; Sullivan and Damper, Reference Sullivan and Damper1993; Federici, Pirrelli and Yvon, Reference Federici, Pirrelli and Yvon1995; Damper and Eastmond, Reference Damper and Eastmond1997; Yvon Reference Yvon1996a, Reference Yvonb; Bagshaw Reference Bagshaw1998; Marchand and Damper, Reference Marchand and Damper2000; Sullivan, Reference Sullivan2001; Damper and Marchand, Reference Damper and Marchand2006). This has been driven by accumulating evidence that PbA easily outperforms traditional linguistic rewrite rules as used extensively in earlier TTS systems plus a variety of other data-driven methods for spelling-to-sound conversion (Damper et al., Reference Damper, Marchand, Adamson and Gustafson1999).
PbA exploits the phonological knowledge inherent in a dictionary of words and their corresponding pronunciations. The underlying idea is that a pronunciation for an unknown word is derived by matching substrings of the input to substrings of known words in a lexicon, hypothesizing a partial pronunciation for each matched substring from the phonological knowledge, and assembling the partial pronunciations to form a final output. A seminal and still typical PbA program is Pronounce by Dedina and Nusbaum (Reference Dedina and Nusbaum1991), hereafter D&N, which forms the basis for our own PbA algorithm. Since we have previously given a full description of Pronounce and our modifications to it elsewhere in this journal (Marchand and Damper Reference Marchand and Damper2007), an abbreviated specification follows.
Pronounce consists of four components: the lexical database, the pattern matcher which compares the target input to all the words in the database, the pronunciation lattice (a data structure representing possible pronunciations), and the decision function, which selects the best pronunciation among the set of possible ones.
An input word is matched in turn against all orthographic entries in the lexicon. For a given dictionary entry, the process starts in the D&N formulation with the input string  and the dictionary entry
 left-aligned. Substrings sharing contiguous, common letters in matching positions in the two strings are then found. Information about these matching letter substrings—and their corresponding phoneme substrings in the dictionary entry under consideration—is entered into the pronunciation lattice as detailed immediately below. Note that this requires the letters and phonemes of each word in the lexicon to have been previously aligned in one-to-one fashion, so that one or more partial pronunciations can be attributed to each matching substring. The shorter of the two strings is then shifted right by one letter and the matching process repeated. This continues until (in the D&N formulation) the two strings, and , are right-aligned.
Matched substrings, with their corresponding phonemic mappings, are used to build the pronunciation lattice. A node of the lattice represents a matched letter, L i, at some position, i, in the input. The node is labeled with its position index i and with the phoneme which corresponds to L i in the matched substring, P im say, for the mth matched substring. Two nodes, Start and End have special status; they represent the implicit spaces preceding and following the word. An arc is placed from node i to node j if there is a matched substring starting with L i and ending with L j and is labeled with the phonemes intermediate between P im and P jm in the matched substring. Additionally, arcs are labeled with a frequency count that is incremented each time that substring with that pronunciation is matched.
A possible pronunciation for the input string then corresponds to a complete path through its lattice, from Start to End, with the output string assembled by concatenating the phoneme labels on the nodes/arcs in the order that they are traversed. The different paths are then scored according to two heuristics in the original Pronounce.
Heuristic 1: If there is a unique shortest path, then the pronunciation corresponding to this path is taken as the output.
Heuristic 2:If there is more than one shortest path, then the pronunciation corresponding to the best scoring of these is taken as the output.
In D&N's original work, the score used in Heuristic 2 is the sum of arc frequencies. The scoring heuristics are one obvious dimension on which different versions of PbA can vary. In our work to date, we have followed D&N in giving primacy to Heuristic 1. The set of shortest paths (i.e., the candidate pronunciations) is found by a simple breadth-first search. Various possibilities exist for Heuristic 2. D&N took the sum of the arc frequencies along the path, but Damper and Eastmond (Reference Damper and Eastmond1997) showed that the product of the arc frequencies worked better, and taking the sum of products over the multiple paths for identical pronunciations improved performance even more. Our current version of PbA (Marchand and Damper Reference Marchand and Damper2000) features several amendments to the D&N formulation, which have a generally beneficial impact on performance.
First, we use full pattern matching between input letter string and dictionary entries, as opposed to D&N's partial matching. This considers all possible overlaps in finding matching substrings. Thus, rather than starting with the two strings left-aligned, we start with the initial letter of the input string aligned with the end letter of the dictionary entry . The matching process terminates not when the two strings are right-aligned, but when the end letter of aligns with the initial letter of .
Second, although we retain D&N's Heuristic 1 unaltered, we replace Heuristic 2 such that multiple (five) heuristics are used to score candidate pronunciations. These rank-order the candidates according to.
(1) the maximum product of the arc frequencies along the shortest path;
(2) the minimum standard deviation of the arc lengths along the shortest path;
(3) the maximum frequency of the same pronunciation within the shortest paths;
(4) the minimum number of different symbols between a pronunciation and the other candidates;
(5) the maximum weak link value, where the weak link is the minimum of the arc frequencies.
These are used to rank-order the candidates, and a fixed number of points is distributed among the candidates according to their rank position. Individual points are then multiplied together to produce a final overall score and the best-scoring pronunciation is selected. In recent work, Damper and Marchand (Reference Damper and Marchand2006) showed that this rank fusion approach gives statistically significant performance improvements over simpler versions of PbA and over the several other fusion schemes that were tried.
4 Evaluations of transcription accuracy
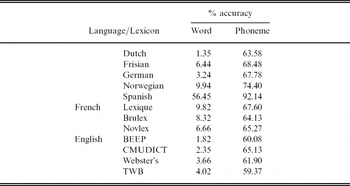
At the outset, to obtain an initial view of the difficulty of transcription and the way this varies across the twelve dictionaries and seven languages, we ran a very simple, naïve or ‘baseline’ algorithm. This just took the default letter-to-phoneme mapping (i.e., the phoneme that most often aligned with a specific letter) across the whole dictionary. Hence, the test words were not strictly ‘unseen’, as ought to be the case in any careful evaluation. However, our purpose at this stage was simply to gain an impression of the magnitude of the transcription problem and its different manifestation across the different languages and dictionaries.
Results of this baseline evaluation are shown in Table 2. As can be seen, the performance is very low indeed for most languages, generally less than 10 percent words correct, indicating that letter-to-phoneme transcription is a real problem calling for a more sophisticated solution. The clear exception to this generalization is Spanish, for which the naïve approach achieves approximately 56 percent words correct. Although this is far above the corresponding figure for the other languages, showing that Spanish spelling-to-sound correspondence is indeed exceedingly shallow, it is nonetheless still inadequate for serious applications. Regarding the other languages, it is difficult to say very much at this point, not least because the variation of accuracy across different dictionaries for the same language is relatively high, compared to the variation across languages. For instance, the values for English vary from 1.8 percent words correct for BEEP to 4.0 percent for TWB.
Results of applying naïve baseline transcription algorithm to twelve dictionaries

Subsequently, in line with the two goals previously stated, the following evaluations were conducted.
(1) Transcription performance was evaluated on the complete dictionary for each of the twelve dictionaries covering the seven languages. The purpose here was to quantify the variation of transcription difficulty across the deep/shallow continuum of orthography represented by these languages.
(2) For each of the seven languages, transcription performance was evaluated as a function of dictionary size. The purpose here was to explore the effect of lexicon size on performance for multilingual transcription using PbA.
Regarding the second evaluation, where there are multiple dictionaries for a language (i.e., French and English), we selected the largest available dictionary (i.e., Lexique and BEEP, respectively).
Dictionary size was then varied artificially by randomly dividing the dictionary for language l into ten approximately equal size partitions, or ‘folds’,  , . . .
 . Ten different-sized subsets were then formed as
 . Because the size of each of the seven dictionaries is not the same, it follows that, in general,
 , m ≠ n. Because the dictionary sizes for each language are not necessarily exactly divisible by 10, in general, the tenth partition for a language is smaller in size than the other nine partitions,

5 Transcription results
In this section, we present the results of applying PbA to the lexicons described in the previous section. These are reported in terms of words and phonemes correct. Words correct reflects the number of words in which all phonemes of the output exactly match those of the corresponding word in the lexicon. Phonemes correct reflects the number of letters that are correctly converted to their corresponding phoneme.
Transcription accuracy was evaluated using both a leave-one-out strategy and ten-fold cross validation (Cherkassky and Mulier Reference Cherkassky and Mulier1998: 78). In the case of leave-one-out, each word was removed in turn from the dictionary and a pronunciation derived from the remaining words, as previously described. In the case of ten-fold cross validation, each of the twelve dictionaries was divided into ten partitions (folds), as described in the previous section. Each fold was removed in turn and used as a test set; the remaining nine folds acting as the dictionary for inferring pronunciations. It should be obvious that leave-one-out is also a form of k-fold cross-validation, where k is equal to the number of entries in the dictionary.
5.1 Results on the twelve different dictionaries
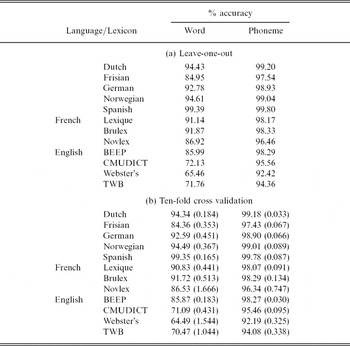
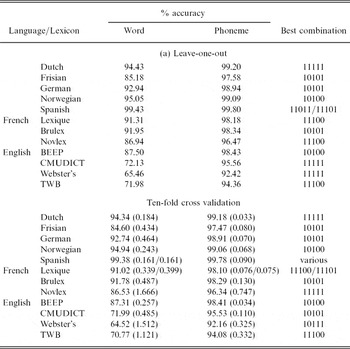
Table 3(a) summarizes results on all twelve dictionaries using the leave-one-out method, and for the case where all five scoring strategies described in Section 3 were used in resolving tied shortest paths. The corresponding results obtained by averaging across the ten folds are shown in Table 3(b). Table 4 summarizes results on the same basis, but for the best combination of scoring strategies (rather than all). These results are very similar (typically only a small fraction of one percentage point better). In both cases (Tables 3 and 4), there is also very little difference between the leave-one out and ten-fold cross validation results, although the latter are consistently lower. Note that in Table 4(a), the binary coding in the final column indicates which combination of PbA heuristic scoring strategies gave best word transcription accuracy. A 1 in position p of the binary code indicates that the pth scoring strategy listed in Section 3 was included in the rank-fusion combination; a 0 indicates that it was not.
Results of applying PbA to twelve dictionaries. Accuracies for ten fold cross-validation in (b) are averages across the ten folds with standard deviations in brackets. In all cases, all scoring strategies were applied to resolve ties (i.e., ‘11111’ combination)

Results of applying PbA to twelve dictionaries. Accuracies for ten-fold cross-validation in (b) are averages across the ten folds with standard deviations in brackets. Results are the best obtained for all possible combinations of scoring strategy. Many different combinations gave the same best value for Spanish with ten-fold cross validation

From this point, we consider only the results obtained for the best combination of scoring strategy. The reader should appreciate that, in a practical system, the best combination would need to be decided by validation on a held-out portion of the corpus. This is not done here for simplicity, because this is an empirical research study rather than a report on a practical system, and because simply reverting to using all strategies would produce not-dissimilar results.
Broadly in line with expectations based on our initial intuitions about the relative difficulty of letter-to-phoneme conversion in different languages, the best results are achieved for Spanish at >99 percent word accuracy and the lowest performance is obtained for English. Performance for the other languages (Dutch, French, German, Norwegian) was generally at >90 percent words correct, whereas for Frisian, the result was approximately 85 percent words correct. There are few data in the literature on the problem of multilingual letter-to-phoneme conversion with which to compare our results. One exception is the work of Damper, Marchand, Adsett, Soonklang and Marsters (Reference Damper, Marchand, Adsett, Soonklang and Marsters2005a), who used the entropy of the alignment matrix used to align letters and phonemes (Damper et al., Reference Damper, Marchand, Marsters and Bazin2005b) as a measure of orthographic depth of English, Frisian, French, and German. Another is van den Bosch, Content, Daelemans and De Gelder (Reference van den Bosch, Content, Daelemans and De1994) who attempt to measure the complexity of the French, Dutch, and English writing systems based on the two measures of success at letter–phoneme alignment and accuracy of letter-to-phoneme conversion. Generally, they find that French is easier to transcribe from spelling to pronunciation than Dutch, which in turn is easier than English. Our results are somewhat different in that the relative difficulty of French and Dutch are reversed in our data. Obviously, some differences are to be expected in light of the use of different dictionaries and different methods for automatic alignment and transcription.
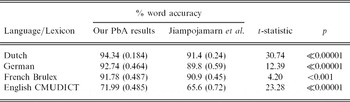
Recently, Jiampojamarn, Kondrak and Sherif (Reference Jiampojamarn, Kondrak and Sherif2007) have evaluated a competitor method for letter-to-phoneme transcription on a subset of the multilingual dictionaries used in this work. Space precludes a detailed description of their methodology here; it features a many-to-many alignment (as opposed to our one-to-one alignment) and then uses a hidden Markov model for transcription. Table 5 shows a comparison of our best results for ten-fold cross validation with those of Jiampojamarn et al. (taken from their Table 3, p. 378). As can be seen, the pattern of results across languages is similar, but with PbA yielding superior performance. It was not possible to perform a paired-samples t-test comparison of the two methods because we do not have access to Jiampojamarn et al.'s raw data. However, on the basis of unpaired t-tests, the word accuracy of PbA is very highly significantly better than Jiampojamarn et al.'s method for all languages. We take this superiority as a partial vindication of our choice of PbA as the best-performing transcription method currently known.
Comparison of multilingual results of PbA with those of Jiampojamarn et al. using ten-fold cross-validation. Figures are averages across the ten folds with standard deviations in brackets. The same folds were used in both cases. The t-statistic is for unpaired samples; significance tests are one-tailed with df = 9

5.2 Variation of results across dictionaries for French and English
For French and English, the results vary across the dictionaries; the variation is especially wide for English. Factors accounting for this variation are likely to include
• the different sizes of the dictionaries;
• the different sizes of the phoneme inventories;
• differing transcription standards employed by the dictionary compilers.
Figure 1 shows the variation of word accuracy with dictionary size for English. There is a reasonably strong positive correlation (R 2 = 0.797) between accuracy and size, showing that this factor seems to have a real effect. We speculate that larger dictionaries have lower complexity in that the extra words are likely to be morphologically related to other entries, and this lower complexity is reflected in higher transcription accuracy.
Looking back at the performance of the baseline algorithm for these four dictionaries (Table 2), it appears that baseline performance has almost an inverse relationship to performance using PbA. This is probably an effect of dictionary size. For a small dictionary, it seems the default phoneme is more likely to be correct than is the case for a large dictionary, presumably because there is greater variability in the large dictionary. On the other hand, PbA seems to work better with a large dictionary, maybe because there is a greater chance of finding useful analogical patterns. This observation reinforces the cautionary message in the Introduction, citing Baayen (Reference Baayen2001), against simplistic assumptions about how things will vary with dictionary size.
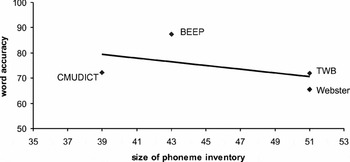
Figure 2 shows the variation of word accuracy with the size of phoneme inventory employed by the dictionary, again for English. Here, there is a relatively much weaker negative correlation (R 2 = 0.225) between accuracy and size of the phoneme set. Some such negative correlation is only to be expected; the lower the size of the phoneme inventory, the broader is the transcription standard being used, and so the less potential there is for phoneme substitution errors.
Variation of word accuracy with size of dictionary phoneme inventory for English letter-to-phoneme transcription, showing best-fit regression line.

We have not attempted any similar analysis of the results for French because of the fewer number of dictionaries employed (three rather than four, with two being very similar in size), and because the variation in transcription performance and in size of phoneme inventory is much less than for English.
5.3 Results as a function of dictionary size
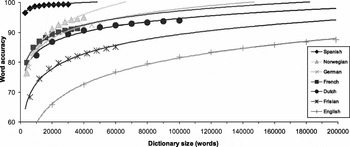
The data points in Figure 3 show the variation of word transcription accuracy in the seven languages as a function of dictionary size, with different-size dictionaries constructed as described in Section 4. The results shown here were obtained using leave-one-out and the best combination as tabulated in Table 4(a).
Variation of word accuracy with different sizes of dictionaries for seven European languages. The regression T = αlnS + β has been fitted to the data points for each language.

There is a clear and obvious tendency for transcription performance to grow monotonically with dictionary size. This goes some way to explaining why the ten-fold cross validation results in Table 4(a) are consistently very slightly smaller than the leave-one-out results in Table 4(a), because the size of dictionary used for inference is smaller than with leave-one-out. It is  ths the size of the complete dictionary.
Apart from the case of Spanish, which is a clear outlier in terms of the ease of letter-to-phoneme transcription, there is no very consistent relation between these results and those of the simple baseline algorithm in Table 2. In the latter, the poorest performance (1.35% words correct) was obtained for Dutch, yet here the performance using PbA for Dutch is intermediate between the extremes of Spanish and English. It seems that the baseline performance figures are unduly affected by dictionary size.
For each language, the data are well modeled by a function of the form

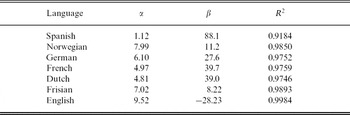
where T is percentage word transcription accuracy, S is lexicon size, and α and β are language-dependent regression parameters, tabulated in Table 6. As can be seen from the final column of the table, the fit to the mathematical model of (1) is excellent, with R 2 > 0.9 in all cases.
Best-fit parameters for the regression model T =αlnS + β

In spite of the high R 2 correlation coefficients obtained, there is one obvious sense in which this model is deficient: The logarithmic function does not saturate (although it does decelerate) as S increases, whereas the actual transcription accuracy obtained cannot exceed 100 per cent. This deficiency in the model is clearly seen in the curve for Norwegian in Figure 3, where the extrapolated best-fit curve appears to be tending to a value well above 100 per cent. The situation bears similarities to the mathematical modeling of lexicon coverage in our earlier work (Damper et al., Reference Damper, Marchand, Adamson and Gustafson1999, Appendix A). In this case, consideration of Zipf's law (Zipf Reference Zipf1949; Schroeder Reference Schroeder1991: 35) led to a logarithmic model like (1) that was limited by setting a parameter (effectively α) according to the total number of words in the language. This concept of ‘the total number of words in the language’ is, of course, problematic from a theoretical point of view. The words of a language can be listed in lexicographic order, and then put in one-to-one correspondence with the natural numbers, so the set of all words is countably infinite (Partee, ter Meulen and Wall, Reference Partee, ter and Wall1993: 59) and has no upper limit. In the present situation, the growth of transcription accuracy T can be similarly limited by appropriate setting of α and β, assuming that S can never exceed some upper bound. Although we readily concede that this artificial device is rather unsatisfactory, we find it interesting that very similar modeling considerations arise in the two cases.
In (1), α controls the rate of growth of transcription accuracy, whereas β controls the vertical placement of the growth curve. From this perspective, we would expect a language possessing shallow orthography to display a high value of β, probably in conjunction with a low value of α (since high transcription accuracy will already be achieved for a relatively small lexicon). This is precisely the pattern seen for Spanish (Table 6). On the other hand, a language with deep orthography should show a low value of β; it is less clear how this would couple with the value of α. One might expect that α would be low (i.e., low growth) because transcription is ‘difficult’; alternatively, one might predict that α would be relatively large because growth is from a lower value for S, approximately a few thousand words.
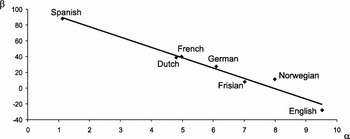
To explore this issue, we plot β versus α in Figure 4, whereupon we find a clear linear trend between the two parameters of the form

with R 2 = 0.9701. There was no particular reason that we can see to expect any such relation a priori, since (as outlined above) we interpreted one parameter to control growth rate and the other to control vertical placement. With hindsight, however, it makes sense for there to be a dependence between the two, with larger growth to the 100 per cent asymptote for a language with a deep orthography, starting from a relatively low transcription accuracy for a small dictionary.
Relation between β and α for seven European languages.

Substituting (2) into (1) eliminates β, giving the model
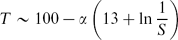
This is an interesting form, indicating that transcription accuracy is limited to 100 per cent for S < e 13 (approximately 450,000) independent of the value of α.
The reader is warned against interpreting (3), as meaning that we only require a one-parameter model to fit the data of Figure 3. Rather (assuming the constant of approximately 100 is playing the role of setting asymptotic performance), we should view the constant of 13 in (3) as another ‘parameter’ which turns out empirically to be the same across all seven languages studied here. Further work is required to determine how general this is across a wider range of languages.
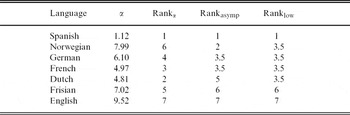
The question then arises: how good a measure is the language-dependent parameter α of the depth of orthography (or the difficulty of letter-to-phoneme transcription) for that language? Table 7 shows the seven languages and ranks assigned to the value of α obtained by regression (Rankα) and to the difficulty of transcription, Rankasymp assigned according to the ordering of asymptotic performance in Figure 3. For α, ranking is in ascending order; For transcription accuracy, it is in descending order. Note that we have ranked Spanish as easier to transcribe than Norwegian (in spite of a slower rate of deceleration of its T-S curve) as the regression for the latter language looks suspect, and we have considered French and German to tie as it is difficult to separate the performance for these two languages. Let the null hypothesis be that there is no relation between the asymptotic difficulty of transcription and α. By the Spearman rank correlation test (Siegel Reference Siegel1956: 202–213), we obtain r s = 0.5225 according to which there is no reason to reject the null hypothesis.
Rankings of α values, asymptotic transcription accuracy, and ‘low’ transcription accuracy on a small dictionary

However, the asymptotic performance in Figure 3 is possibly unreliable, being based on extrapolation from a model fitted to empirical data. An alternative, preferable measure of the degree of transcription difficulty might be the ‘low’ measure obtained on a dictionary of about 10,000 words, Ranklow, where at least we have actual data. Since it turns out to be rather difficult to separate Norwegian, French, German, and Dutch at S=10,000 in Figure 3, we have treated these as tied on Ranklow. This yields r s = 0.8078, allowing us to reject the null hypothesis at the 5 per cent level of significance. Hence, α for a language appears to be a good predictor of performance on a small dictionary of that language.
6 Discussion and conclusions
At the outset, our purposes for this paper were
(1) To evaluate pronunciation by analogy on a range of seven European languages (Spanish, Norwegian, German, French, Dutch, Frisian, English), with the intention of quantifying the variation of transcription difficulty across the deep/shallow continuum of orthography.
(2) To explore the effect of lexicon size on performance for multilingual transcription using PbA.
Considering the second purpose first, the size of the phoneme set used by the dictionary compilers can have an effect, as shown in the results of Section 5.1, but when this is controlled for by constructing different-sized lexicons as unions of 10 folds of the same dictionary (Section 4), we find in Section 5.3 that transcription accuracy increases monotonically with the size of the lexicon used for analogical inferencing.
Although this simple result might be thought unsurprising, and it parallels results from other researchers starting to use very large training corpora on other NLP tasks (e.g., Banko and Brill Reference Banko and Brill2001 working on word confusion-set disambiguation), there are good reasons for treating it as something other than vacuous. The LNRE phenomenon (Baayen Reference Baayen2001; Möbius Reference Möbius2003) means that simple-minded assumptions about how parameters of a language model grow with corpus size are dangerous. Further, it is one thing to assume a relationship and quite another to demonstrate that it holds empirically. Finally, test and training data set sizes can have a profound effect on results of data-driven approaches to language learning. This is most obviously the case in eager learning methodologies, like neural networks, where overfitting to the training data is an ever-present danger. It seems that yet another advantage of lazy learning is the avoidance of the over-regularization which can result from a prior training phase (Daelemans, van den Bosch and Zavrel, Reference Daelemans, van den Bosch and Zavrel1999).
Turning to the first purpose, we believe this is one of only very few attempts to quantify depth of orthography computationally (rather than by reaction time experiments with human readers). In line with general beliefs in the field, we find that Spanish is at one extreme of the deep/shallow continuum for the languages tested, whereas English is at the other. English is notorious for the lack of regularity in its spelling-to-sound correspondence, which largely reflects the many complex historical influences on the spelling system (Venezky Reference Venezky1965; Scragg Reference Scragg1975; Carney Reference Carney1994). Indeed, Abercrombie (Reference Abercrombie, Asher and Henderson1981: 209) describes English orthography as ‘one of the least successful applications of the Roman alphabet.’ This is reflected in a very large value for the language-dependent parameter α in (3) of 9.52, whereas for Spanish we have α = 1.12. The case of Norwegian appears somewhat anomalous, having a high value for α (7.99, the second-highest found in this work) but seeming to be about as easy to transcribe as French, German, and Dutch according to the results displayed in Figure 3. It is also noticeable (as already remarked) that its rate of deceleration toward asymptotic performance seems to slow, leading to an apparent overshoot above the limiting value of 100 per cent transcription accuracy. Whether the apparently anomalous value of α is a genuine feature of the language or an artifact of some idiosyncrasy of the particular dictionary used is open to question. Further work is needed on this point.
Although (the case of Norwegian notwithstanding) α seems to be a reasonably good predictor of transcription performance on a dictionary of approximately 10,000 words, it is less good at quantifying the asymptotic performance. This may be because the measure of asymptotic performance used here is unreliable, being based on extrapolation from the fitted regression model, quite distant from supporting data points.
The principal findings of this work are: (1) word transcription accuracy using pronunciation by analogy increases monotonically with the size of the dictionary used for analogical inferencing for all languages studied, and (2) broadly, the deeper the orthography for a particular language, the larger is the dictionary size needed to reach a particular level of transcription accuracy. However, it is not an easy matter to quantify the concept of ‘depth of orthography’.