1. Introduction
In China, with the acceleration of severely aging process, commercial pension insurance, the “third pillar” of pension protection, has experienced rapid development since 2021. In June 2021, the pilot of exclusive commercial pension insurance was launched; from March 1, 2022, the pilot area of exclusive commercial pension insurance has been expanded to the whole country. Nevertheless, compared with the basic pension insurance, which has basically achieved full coverage, there is still huge room for development of commercial pension insurance in terms of both breadth and depth of coverage.
Active social engagement can reduce the decision cost of commercial pension insurance product purchase through two forms of social network ties: weak ties and strong ties. Weak ties refer to the loose or fragile connections between individuals who may provide useful or novel information, or new perspectives for each other, while strong ties refer to emotionally close relationships between individuals who are tightly knit for high recognition and mutual goals, such as family, close friends, or even neighbors (Granovetter, Reference Granovetter1973). Weak ties break down information redundancy of homogeneous groups (Lin et al., Reference Lin2017), providing commercial pension insurance products with a low-cost and broad-coverage information dissemination channel. By providing social reinforcement for behavior adoption (Centola, Reference Centola2010), strong ties provide individuals with a path to observe, learn, and imitate others' decision-making behaviors and consequences, which greatly reduce the cost of processing insurance product information for individuals.
Weak ties theory proposes that weak ties are more likely to positively influence individuals' economic behavior and their outcomes than strong ties because they help individuals to obtain novel information (Granovetter, Reference Granovetter1973). Many studies have long been devoted to testing the validity of this theory in the market through empirical data (Barbulescu, Reference Barbulescu2015; Garg and Telang, Reference Garg and Telang2018; Giulietti et al., Reference Giulietti, Wahba and Zenou2018). With the advent of the Internet era, the fit between weak ties theory and market practice is further revealed. Based on social media and mobile communication data, Weng et al. (Reference Weng, Lehmann and Ahn2018) show that interactions within social networks are more active in weak and very strong ties. Zhang and Godes (Reference Zhang and Godes2018) find that adding weak ties initially leads to lower decision quality. However, as experience accumulates, online consumers eventually derive positive effects from weak ties in terms of higher decision quality than strong ties. For online content contribution behavior, ties strength amplifies the role of social contagion in network contributions (Rishika and Ramaprasad, Reference Rishika and Ramaprasad2019), and angry emotions are more likely to spread in weak ties networks than happy emotions because strangers share them more frequently (Fan et al., Reference Fan, Xu and Zhao2020). For physical products, word-of-mouth from strong ties still drives product sales more than that from weak ties (Hu et al., Reference Hu2019), while for electronic marketing, the connected social capital represented by weak ties promotes player–game relationships and player loyalty more (Liao et al., Reference Liao2020).
Studies have provided a rich perspective on the effect of social network ties, while few studies have focused on the impact of network ties on individual pension allocation decisions, which is a topic of profound relevance in the context of accelerated onset of deep aging.
This paper constructs a dyad model based on the influence path of social network ties in individual pension allocation decisions, and then validates the path by building a generalized linear mixed model (GLMM) based on Bayesian approach with the latest longitudinal national sample data of China.
Compared with previous literature, the marginal contributions of this paper are mainly reflected in two aspects. First, this paper extends the weak ties theory to the field of pension asset allocation research for the first time and explores the process through which social network ties affect individual pension asset allocation decisions. Second, this paper introduces a random-effects term in the empirical evidence to establish a mixed model to analyze the China Health and Retirement Tracking Survey (CHARLS) data, which overcomes the possible correlation of samples with the same level and similar characteristics in the national sample data and provides an identification tool to further analyze the sources of mechanism fluctuations.
2. Materials and methods
2.1 Research hypothesis and validation model
Drawing on Giulietti et al. (Reference Giulietti, Wahba and Zenou2018) and Patacchini and Zenou (Reference Patacchini and Zenou2008), the study first develops a dyad model to express the process through which social network ties affect individual pension asset allocation decisions. Theoretical hypotheses are then derived.
To begin with, there is one and only one strong ties association for all individuals, and they all treat each other as the only strong ties association. They belong to the same strong ties combination, and the ties associations outside the strong ties combination belong to the weak ties. Individuals have only two states: purchased commercial pension insurance products (i.e., state 1) and not purchased (i.e., state 0), so that at any moment the aggregate consists of three types of strong ties combinations:
d 2-Individuals in this combination have all purchased commercial pension insurance products;
d 1-Only one individual in this combination has purchased a commercial ped 2nsion insurance product;
d 0-None of the individuals in this combination have purchased commercial pension insurance products.
At the time of t, d 0t, d 1t, and d 2t denote the ratio of the number of d 0, d 1, and d 2 combinations to the population respectively. Then it has

by the definition of dyad model. Let the purchase rate of commercial pension insurance products in population at this time be m t and m t ∈ [0, 1], then the ratio of population who do not purchase commercial pension insurance at this time is 1 − m t. There are:

Individuals who do not purchase commercial pension insurance products may either not be exposed to the appropriate information or may receive the appropriate information, but the information is not sufficient to motivate their purchase behavior. The influence process of social ties interaction in an individual's commercial pension insurance purchasing decision is reflected in the social activities of individuals who meet each other. Individuals' social activities can be categorized into two types: strong ties social interaction and weak ties social interaction. At t time, the probabilities of matching individuals with strong and weak ties are ω and λ respectively, which are set as exogenous constants. The probability of individuals receiving positive information about commercial pension insurance products from the weak ties network depends on the purchase rate of commercial pension insurance m t. The probability of individuals receiving positive word-of-mouth from the strong ties network depends on the satisfaction rate of individuals who have already purchased the commercial pension insurance product (depicted by 1 − q, q is the commercial pension insurance unsubscribe rate).
From time t to t + dt, the net inflows for each combination are:

If there exists an equilibrium in the constructed system, the flows in equation (3) are all zero at the system equilibrium state$( {d_2^\ast , \;d_1^\ast , \;d_0^\ast } )$ , which yields:


Combining equations (1), (2), and (4), we have the polynomial:

Solving the unique solution of equation (7) yields $d_0^\ast$ , and forms the expression for the function of m* on λ, ω based on equation (4).
Thus, there is proposition I:
There will always exist a stable equilibrium N in which no one buys commercial pension insurance products and only d 0 combinations exist in the market. Thus, $m^\ast{ = } d_2^\ast{ = } d_1^\ast{ = } 0, \;d_0^\ast{ = } ( 1/2)$ .
When the turnover in the market goes beyond zero, i.e., 0 < m* < 1, there exists an internal steady-state equilibrium I, if equation (8) is satisfied.

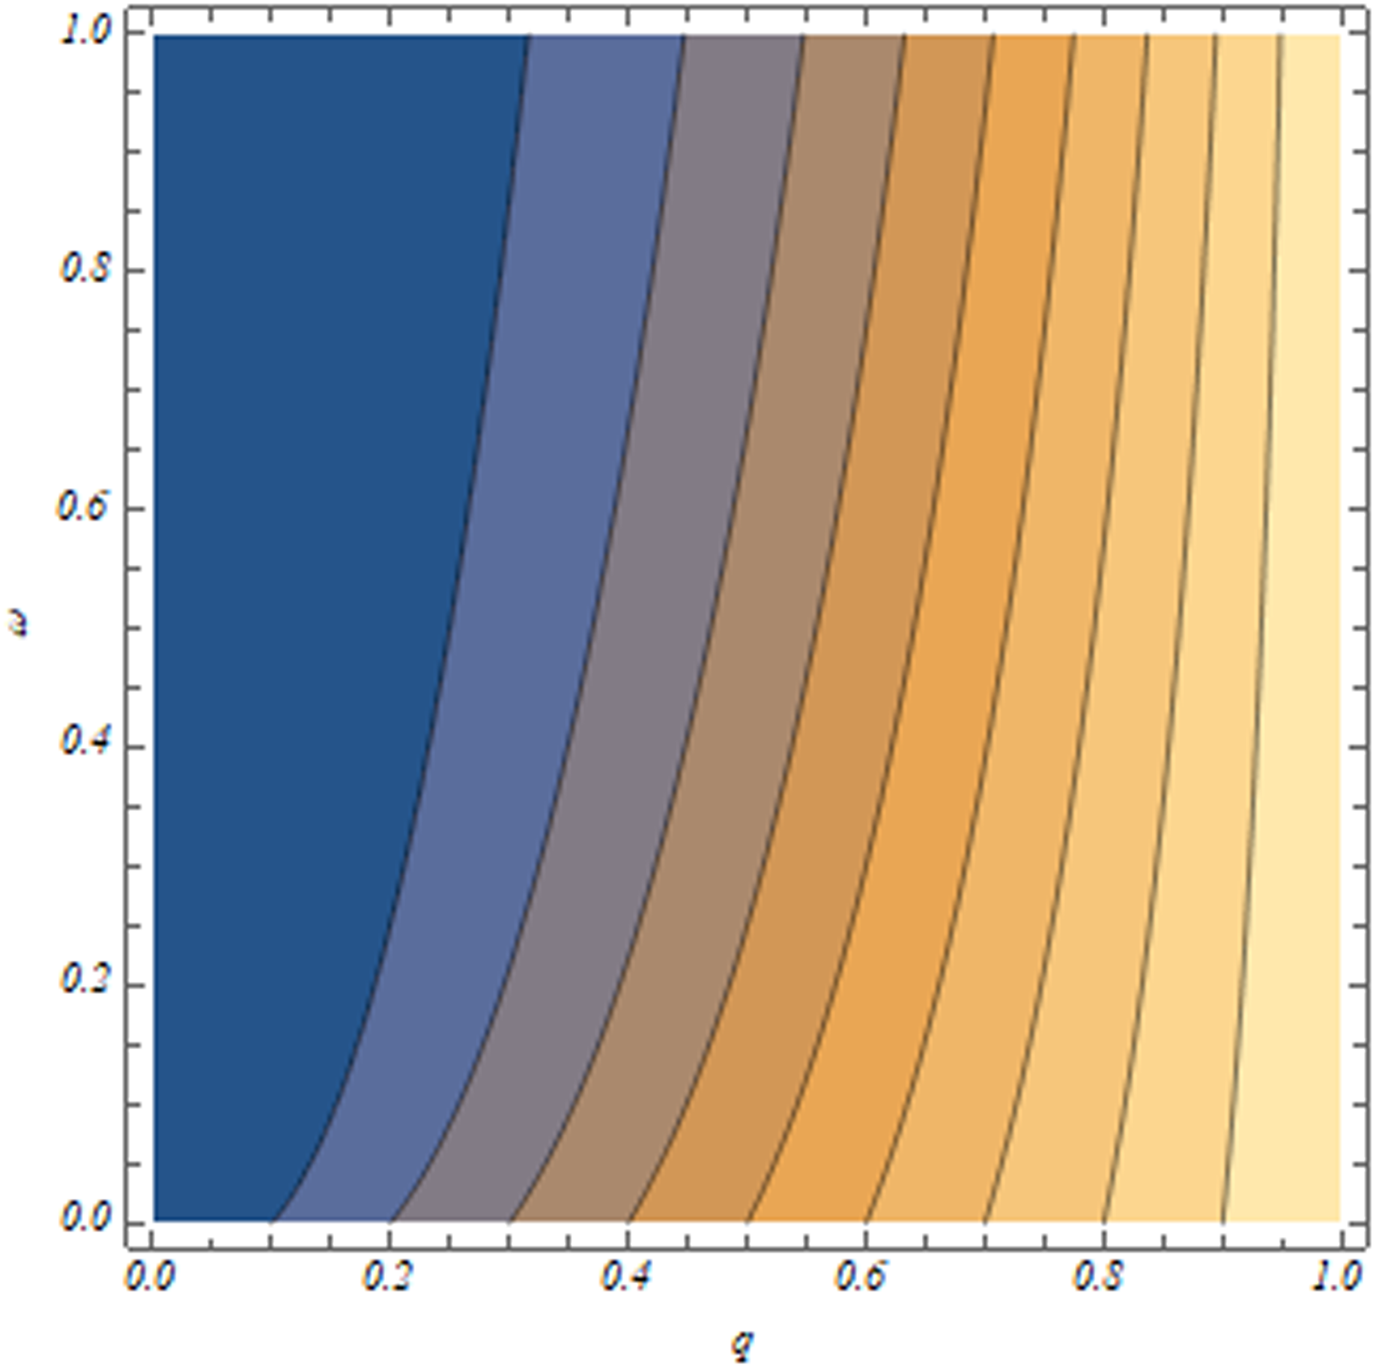
As is shown in Figure 1, the condition for the existence of an internal steady-state equilibrium I is not related to the probability of matching with a strong tie for an individual (ω), and depends only on the unsubscribe rate q and the probability that an individual matches with a weak tie (λ). In the theoretical model, both parameters are exogenous, but the condition for the existence of an internal steady-state equilibrium is more difficult to achieve when λ is extremely small or q is extremely large.
Contour plot of the values taken by the expression on the right side of equation (8). Contour plot shows the change in value of (q 2/ω(1 − q) + q). Different color blocks indicate different value for (q 2/ω(1 − q) + q) when ω and q take different values. The dark blue block represents the smallest value of (q 2/ω(1 − q) + q) while the bright orange block represents the biggest value of ${( q^2/\omega ( 1-q) + q)} {{q^2} \over {\omega ( {1-q} ) + q}}$ . The vertical axis is the value of ω, increasing from 0 to 1 from the bottom to the top, while the horizontal axis is the value of q, increasing from 0 to 1 from left to right. As the color block changes from dark blue to bright orange, the value of (q 2/ω(1 − q) + q) gets larger and larger. As shown in contour plot, the value of (q 2/ω(1 − q) + q) is independent of the value of ω and positively related to the value of q.

When internal steady-state equilibrium is reached, we have:


Proposition II:
When equation (8) is satisfied, (∂m*/∂ω) > 0 holds constantly, by taking the partial derivative of equation (9). The condition of (∂m*/∂λ) > 0 is λ − ω(1 − q) ≥ 0 while ω and λ are parameters external to the theoretical model.
From proposition II, it is possible to further compare the condition for the existence of an internal steady-state equilibrium with (∂m*/∂λ) > 0, i.e., the value of

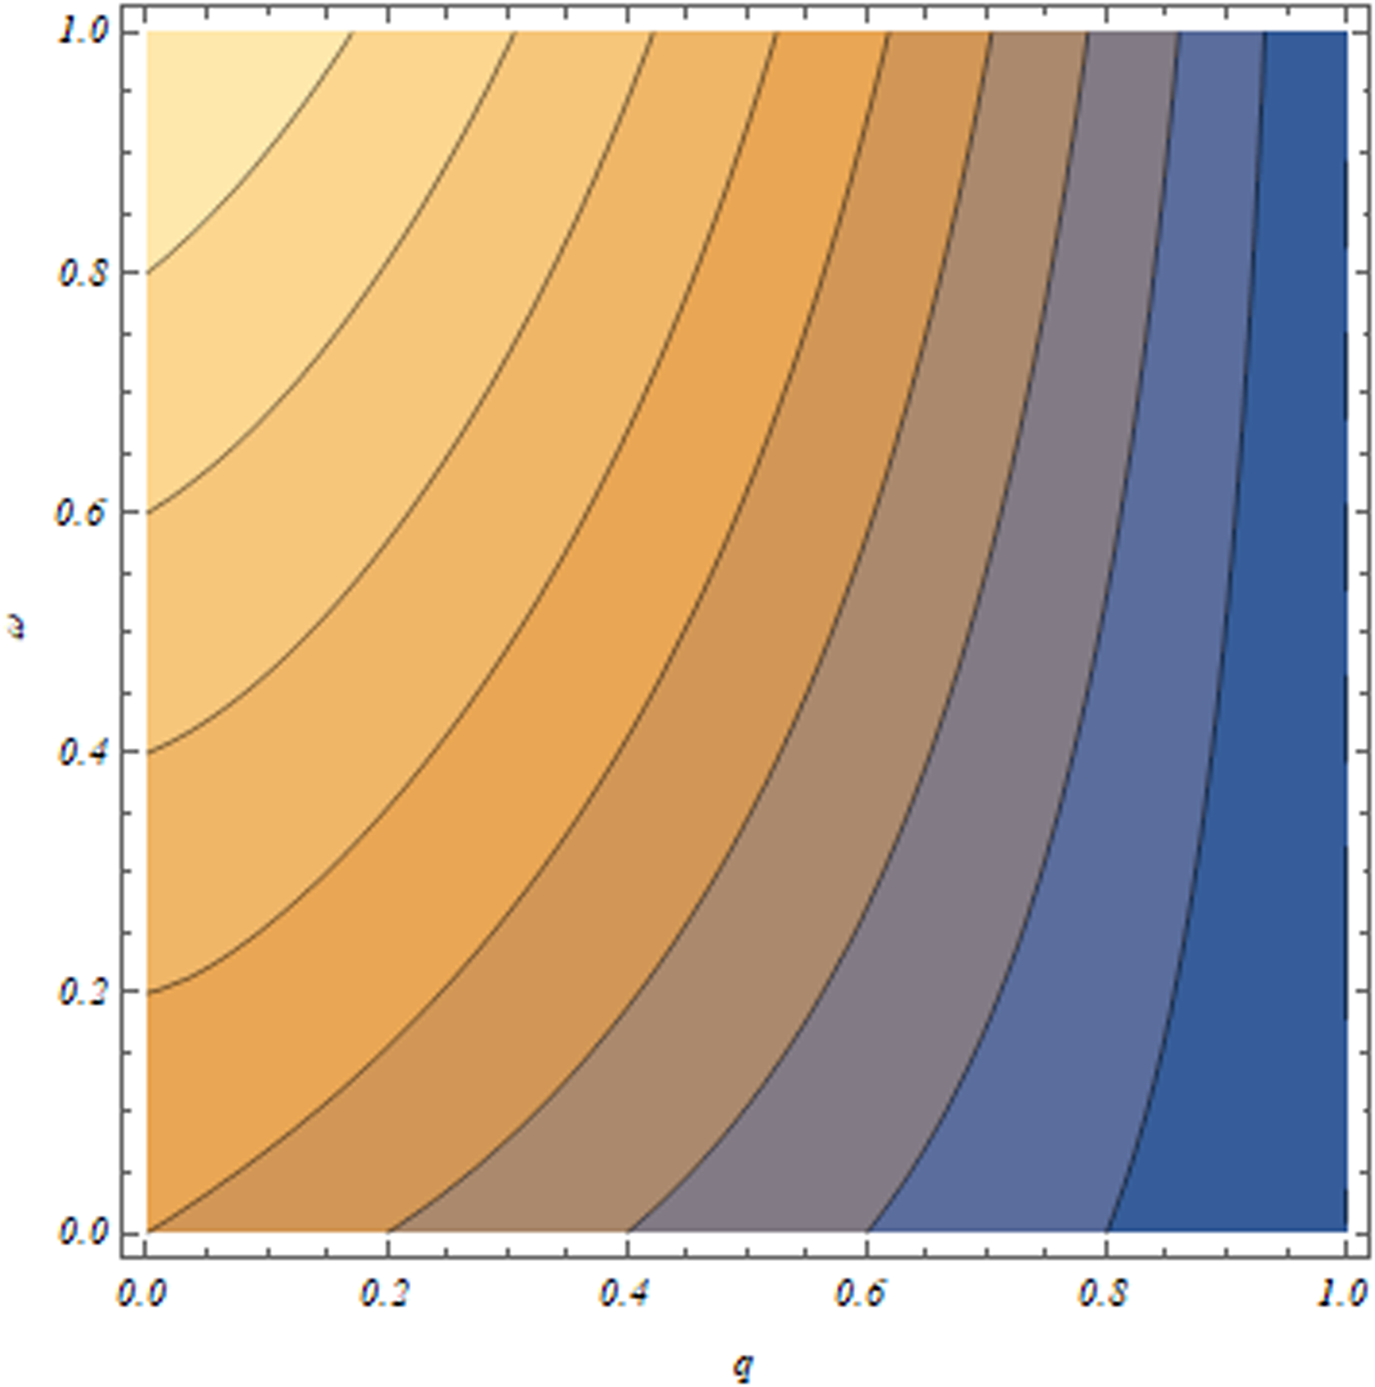
Figure 2 shows that when q is extremely large and ω is extremely small, then equation (11) is constantly less than 0, i.e., as long as the existence of λ satisfies the condition of existence of internal steady-state equilibrium, then λ must meet the condition of (∂m*/∂λ) > 0; and when q is extremely small, the ω is extremely large, then equation (11) is constantly greater than 0. The value of (∂m*/∂λ) also may not be greater than zero even if there exists an internal steady-state equilibrium.
Contour plot of equation (11). Contour plot shows the change in the value of ω(1 − q) − (q 2/ω(1 − q) + q) (equation [11]). Different color blocks indicate different value for equation (11) when ω and q take different values. The dark blue block represents the smallest value of equation (11) while the bright orange block represents the biggest value of equation (11). The vertical axis is the value of ω , increasing from 0 to 1 from the bottom to the top, while the horizontal axis is the value of q, increasing from 0 to 1 from left to right. As the color block changes from dark blue to bright orange, the value of equation (11) gets larger and larger. As shown in contour plot, the value of equation (11) is jointly determined by the value of ω and the value of q. The value of equation (11) is constantly greater than 0 only if q = 0.

Therefore, the value of (∂m*/∂λ) depends entirely on the value of λ. The larger λ is, the larger the value is, and the higher probability (∂m*/∂λ) > 0 holds. When λ is extremely small, then either the internal steady-state equilibrium may not be reached or even if it is reached, it may not satisfy the condition of (∂m*/∂λ) > 0. λ is defined as the probability of matching an individual's weak ties, and its magnitude is determined by the frequency of the individual's participation in the social activities of the weak ties.
Based on proposition II and the inferences based on proposition II, two hypotheses of the study could be proposed.
Hypothesis 1: Strong ties social interaction positively influences individuals' commercial pension insurance purchasing behavior.
Hypothesis 2: There is a certain threshold of social interaction frequency, and social interaction intensity will significantly affect individuals' purchase behavior of commercial pension insurance products only when their social interaction frequency is higher than this threshold value.
2.2 Setting of the empirical model
The sample for the empirical study is drawn from all over the country, and it is highly likely that data from respondents at the same level and with similar characteristics are correlated and cannot satisfy the assumptions of independence and chi-square for the dependent variable, the random effects is therefore introduced to establish a mixed model to fit the coefficients. The study uses a Markov chain Monte Carlo (MCMC) Bayesian approach to estimate the GLMM, and thus has the following three advantages in the empirical evidence: firstly, the actual distribution of the dependent variable in the sample of the empirical study provides rich priori information for the empirical model, which to some extent reflects the characteristics of the overall distribution. The fitting process of maximum likelihood estimation ignores this prior information, but a Bayesian model that reflects this information in the prior setting will be more helpful in improving the accuracy of the econometric model. Secondly, the assumption of independent identical distribution of random effects in the mixed model can introduce the likelihood function about the covariance of unknown parameters and random effects, but in general, it is difficult to directly product the integral about random effects in the likelihood function, and the MCMC method can solve this difficulty well by simulating the idea of estimating parameters. Finally, in the fitting process, the Bayesian model is completely simulated by the MCMC method based on sample random sampling of the coefficients, and its coefficient estimation results are the true reflection of the exact probability of the coefficients, and its coefficient estimation is more accurate.
Combining equations (1), (5), and (6), we have:

Equation (12) represents the relationship between the commercial pension insurance purchase rate and the individual weak ties matching probability (λ), the individual strong ties matching probability (ω), and the commercial pension insurance unsubscribe rate (q) at equilibrium. From the definition of q, the commercial pension insurance unsubscribe rate can be considered as a constant with respect to the current commercial pension insurance purchase rate to simplify the measurement process, and the function then degenerates to m* = f(λ, ω), whose linear form is:

where ${\rm X}_i^{\rm ^{\prime}}$ are the remaining control variables that affect the purchase rate of commercial pension insurance g.
For estimation purpose, it is necessary to convert explanatory variables in equation (13) to generalized linear form. The probability of not purchasing commercial pension insurance is set as the control group, and the logarithm of odds ratio for purchasing probability of commercial pension insurance is θ i = ln(m i/1 − m i), where m i is the probability of purchasing commercial pension insurance for individual i. Then the generalized linear form of the econometric model can be expressed as:

where x is the N × p dimensional fixed-effects explanatory variables matrix, N is the sample size, p is the number of explanatory variables, and β represents the fixed-effects coefficients. z is the N × q dimensional random-effects variable matrix, q is the grouping dimension of the random-effects term, and α represents the random effects of the corresponding options. N × 1 column residual vector e represents the portion of the model that is not yet explained by the fixed and random effects. Hypotheses 1 and 2 can be tested by comparing each coefficient estimate.
2.3 Variable description
The study selects the CHARLS as the empirical database. CHARLS has been widely used for empirical evidence on the consumption behavior of middle-aged and elderly people, and the validity of its data has been confirmed by many influential empirical studies (Li et al., Reference Li2018; Pan and Chee, Reference Pan and Chee2020; Wang et al., Reference Wang2019). The basic empirical evidence of this study will be based on the cross-sectional data of wave 4 conducted in 2018, which is the latest data revealed by CHARLS, and further robustness tests will be done with the data of waves 2 and 3, which were conducted in 2013 and 2015, respectively.
The dependent variable of the study comes from the commercial pension insurance purchasing behaviors of the sample individuals, including life insurance, commercial pension insurance, and other pension insurance in the statistics of CHARLS. Although there are differences in the product design and purchase methods of these types of insurance, they are all the pension insurance purchase behaviors of individuals in addition to the basic pension insurance, which more comprehensively reflect the commercial-type pension insurance purchase behaviors of individuals.
Exogenous variables ω and λ in the theoretical model measuring the probability of matching an individual with the strong and weak ties are determined by the frequency with which individuals are associated with strong and weak ties social interaction. This is the core explanatory variable in this paper; drawing on Pan and Chee (Reference Pan and Chee2020), the treatment of the strong and weak ties social interaction variables was generated.
Respondents were first categorized according to their responses to the question “Have you done any of the following social activities in the past month?” The social interaction of the sample was categorized according to their responses to the question. The question options included “hanging out, and socializing with friends,” “playing mahjong, chess and cards, and going to the community room,” “offering help to relatives, friends or neighbors who do not live with you,” “dancing, working out, and practicing qigong, etc.,” “participating in club activities,” “taking part in volunteer activities or charity activities,” “caring for a sick or disabled person who does not live with you,” “attending school or training courses,” “speculating in stocks (funds and other financial securities),” “using the Internet,” and “other.” Based on the meaning of strong and weak ties in our context, it is easy to see that visiting friend's house, socializing with friends, providing help to relatives, friends or neighbors, and frequent Internet chatting are considered as strong ties, while the rest are weak ties.
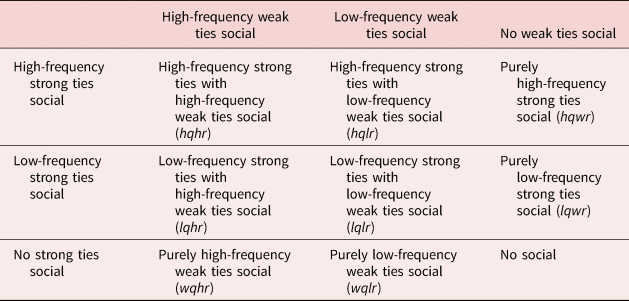
Second, the social interaction of individuals is classified by combining the social interaction intensity and social interaction frequency. There are three types of strong ties social interaction of individuals, when individuals have at least one high-frequency strong ties social interaction, they belong to high-frequency strong ties interaction; when individuals have at least one low-frequency strong ties social interaction and do not have any high-frequency strong ties social interaction, they belong to low-frequency strong ties interaction; when the sample has neither high-frequency strong ties social interaction nor low-frequency strong ties social interaction, they belong to no strong ties interaction. Following a similar logic, the types of weak ties social interaction of individuals are classified as high-frequency weak ties social interaction, low-frequency weak ties social interaction, and no weak ties social interaction.
By setting individuals with no social behavior at all as a control group, the intensity and frequency of social interactions of individuals are distinguished into eight completely independent types, and dummy variables corresponding to them are generated for assignment, as shown in Table 1.
Matrix of social interactions by intensity and frequency

In addition to being influenced by social interaction, the study added control variables from three dimensions: causal demographic factors, enabling factors, and neediness factors, drawing on the Anderson model (Pan et al., Reference Pan2020). The causal demographic factors include age, gender, education level, health level, and marital satisfaction; the enabling factors contain income and assets; and the demand factors cover number of children and child satisfaction.
2.4 Empirical testing strategy
2.4.1 Hypothesis test: social ties influence mechanism
Most previous literature constructs social interaction variables separately according to different connotations (social interaction type/social interaction frequency). However, as Aral and Walker (Reference Aral and Walker2014) stated, aggregating the nature of relationship categories into a single measure is undesirable as it obscures meaningful differences in the type and quality of relationships and reduces the ability to detect the impact of the different dimensions of tie strength on influence. For testing hypothesis proposed by theoretical model (especially for testing hypothesis 2), we combined social interaction intensity with interaction frequency to construct social interaction dummy variable instead of applying different measurement of social interaction independently into empirical model in this paper.
There are at least two advantages by doing this. Firstly, it reveals the integrated social interaction effect on decision, as what real life happens. This makes the results of empirical model more practical. Secondly, integrated social interaction dummy variable setup makes it possible to make more fine-grained inference from empirical results compared with the way of applying different measurement of social interaction independently into empirical model, since effects of more social interaction types have been estimated in integrated setup model.
We test hypothesis 1 by comparing the difference of estimated coefficients among different frequency strong ties social interaction variables and that of estimated coefficients among different frequency weak ties social interaction variables. If the estimated coefficients of social interaction dummy variables do not change as the frequency of strong ties social interaction changes, then strong ties social interaction has no effect on the probability of purchasing commercial pension insurance. Similarly, the probability of purchasing commercial pension insurance is not affected by weak ties social interaction if the estimated coefficients of social interaction dummy variables do not change as the frequency of weak ties social interaction changes. For hypothesis 2 testing, the estimated coefficients of social interaction dummy variables without weak ties or with low-frequency weak ties social interaction are the key results. The hypothesis is empirically validated if these coefficients are statistically or economically insignificant compared to the estimated coefficients of social interaction dummy variables with high-frequency weak ties.
2.4.2 Mechanism check: role of spatial and temporal characteristics
We also conducted a mechanism check to better understand the operative force behind social ties influence mechanism.
On one hand, we test our hypothesis based on national sample. As is known to all, China is a country with a vast territory and great differences between regions. Such difference is not only reflected in local customs, but also reflected in different policies and markets from region to region. It is therefore reasonable to doubt whether the process by which social interaction is embedded in commercial pension insurance purchasing decisions may differ depending on the region in which individuals live. Even if the heterogeneity caused by regional differences is confirmed, there is still a further question that needs to be answered: Is the mechanism heterogeneity caused by differences between provinces or between communities greater? The significance of clarifying this issue lies in the point that, determining the spatial characteristics of ties strength effect is helpful for government and institutions to determine the policy hierarchy for optimizing the social ties influence mechanism. For a country like China that needs to constantly balance policy consistency and practicality, determining a reasonable level of policy intervention will greatly reduce related administrative costs while improving the effectiveness of policy intervention.
On the other hand, we test our hypothesis based on longitudinal survey data, which enable us to verify an intuitive question: Is the mechanism unchanged over time? Especially under background that, with the gradual popularization of digital socializing, the cost of discovering and maintaining weak ties is becoming lower and lower. What changes will occur in the frequency of strong and weak ties socializing? What is the impact of changing intensity and frequencies of social interactions on the social ties influence mechanism? The significance of clarifying this issue lies in the point that, it would be helpful for empirical model employed in this paper to capture the dynamic effects of the social ties influence mechanism. Such dynamic effects are important for policymakers to figure out which part of intervening in social interaction can more effectively help middle-aged and elderly groups establish positive commercial pension insurance purchasing decisions. By accelerating the dissemination of relevant information, or leveraging the role model effect?
Both spatial and temporal characters of social ties influence mechanism are empirically tested in this paper. Results are shown in sections 3.2 and 3.3; further discussion is conducted based on empirical results.
2.5 Data collation
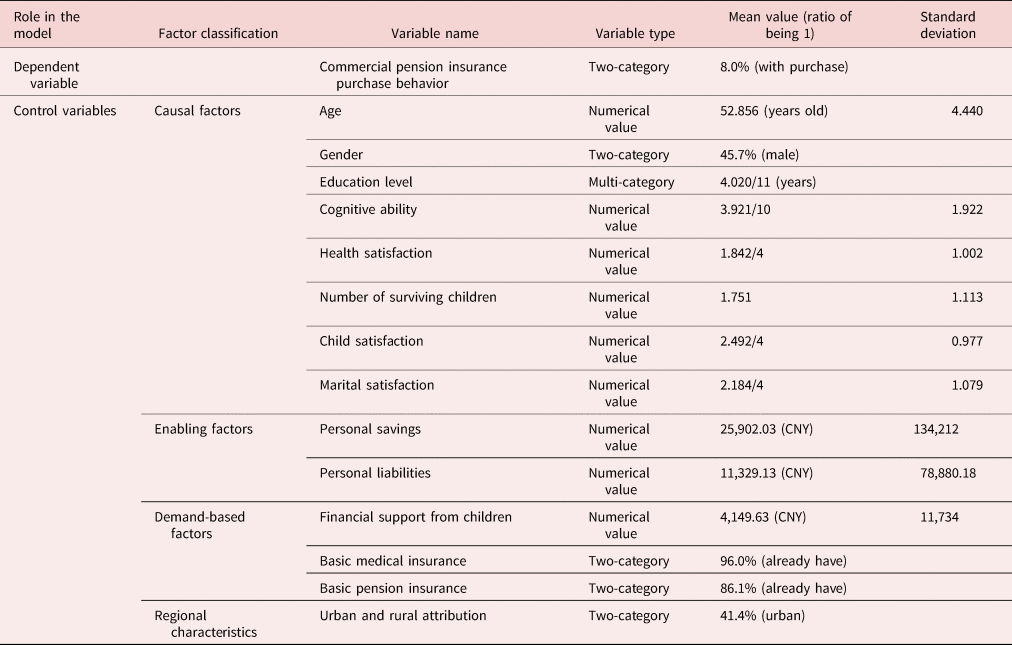
The sample size in wave 4 that meets the age requirement (less than or equal to 60 years old) is 9190. After a 1% winsorize, personal savings, wage income, and other income are proceeded to standardize standard deviation. The descriptive statistics of the treated sample are shown in Table 2.
Descriptive statistics of the sample data

Overall, the gender distribution within the sample is relatively even, with an average age of 52.856 years, and the urban–rural distribution is more relevant to the actual scenario, with only 41.4% of individuals in the sample coming from urban areas. The statistical description of the sample also indicates that there is still great room for improvement in the breadth of pension insurance coverage, with only about 8% of the individuals in the sample having purchased commercial pension insurance, in contrast to the 86.1% coverage rate of basic pension insurance. The low level of coverage also indicates that there are still some groups in need of protection in China that are still outside the financial pension protection system.
2.6 Benchmark model
The MCMC method is a Bayesian approach, which requires setting prior knowledge for the fixed effects, random effects, and the residual part of the model. The benchmark model does not contain random effects and only requires setting prior knowledge for the other two components.
2.6.1 A priori setting
Drawing on the practice of Gelman et al. (Reference Gelman2008), all continuous variables in the model are first scaled to have a mean of 0 and a standard deviation of 0.5, and then independent Student t prior distributions are placed on the coefficients. In this paper, the Cauchy distribution with a location parameter of 0 and a scale parameter of 2.5 are chosen as the fixed-effects prior distribution, and the distribution obeys the probability density function f(x;0, 2.5). For the residual part, set σ 2 ~ IW. This prior solves the extreme separation problem that may arise in the selection by assigning a less volatile prior to the fixed effects.
2.6.2 Stability test
The stability test of the model mainly examines the convergence of the MCMC process in the model. The autocorrelation degree test and the Gelman–Rubin method are used to determine whether the Markov chain has reached a steady state, which subsequently determines whether the coefficients of the benchmark model are robust.
1. Degree of autocorrelation
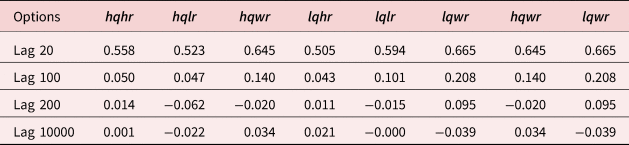
The number of iterations of the Markov chain in the model reaches 70,000. The fixed-effects autocorrelation coefficients reported in Table 3 indicate that the degree of autocorrelation of model 1 Markov chain is already at a low level (<0.1) even after only 200 lags, and after 10,000 lags, the correlation estimated by the fixed-effect coefficients completely disappears. This indicates that the MCMC process has excellent ergodicity, and the coefficient estimation results based on it are robust.
2. Gelman–Rubin method
Autocorrelation of fixed effect

Since the MCMC method estimates the posterior distribution of the model by sampling, the Gelman–Rubin method is suggested to determine the convergence of the chain. The potential scale reduction factor (psrf) mainly reflects the consistency of different coefficients estimated by sampling for the same setup model, and if the difference between two sampled coefficient estimates is too large, the model is considered to be inconsistent in its estimation of the coefficients. The multivariate potential scale reduction factor (Multivariate psrf) of model 1 is only 1.02, indicating that the estimated coefficients of the model exhibit excellent consistency and multiple MCMC processes point to the same coefficient estimates, i.e., the coefficient estimates of the model are robust.
In summary, the coefficient estimation MCMC process of model 1 has excellent ergodicity and convergence, and the coefficient estimation results of the model built on the stochastic process have stable reproducibility.
3. Results
3.1 Results of benchmark model
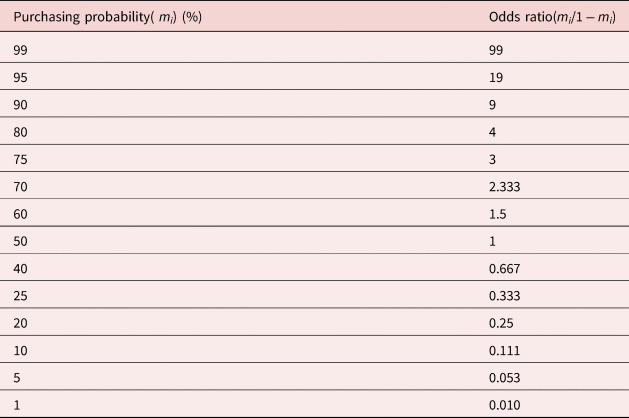
Before interpreting the result of the empirical model, it is important to take some notes about the dependent variable in the empirical model. The dependent variable in the empirical model θ i is the logarithm of odds ratio for purchasing probability of commercial pension insurance. The odds ratio of purchasing probability m i equals to (m i/1 − m i), where m i is the probability of purchasing commercial pension insurance for individual i. Table 4 shows some odds ratios corresponding to different purchasing probabilities m i. It is therefore straightforward that if the purchasing probability goes from 95% to 99%, the odds ratio change would be 80 which equals to 99 = (99%/1 − 99%) minus 19 = (95%/1 − 95%). Similarly, if the purchasing probability goes from 90% to 95%, the odds ratio change would be 10 which equals to 19 = (95%/1 − 95%) minus 9 = (90%/1 − 90%), and so on. Obviously, if holds the purchasing probability the same, the bigger odds ratio change is, the more the purchasing probability increases.
Typical probability with its corresponding odds ratio

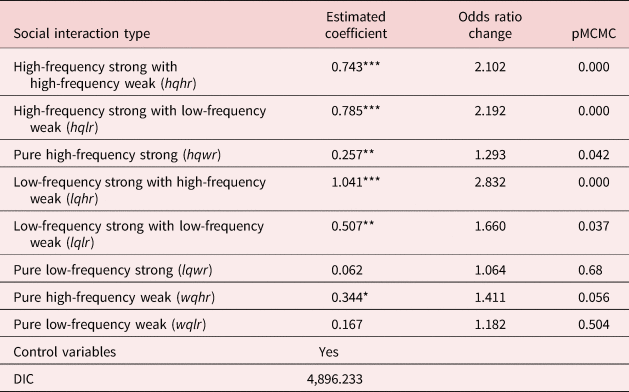
Results of the fixed-effects coefficient estimate for the benchmark model are shown in Table 5. Essentially speaking, the estimated coefficient in empirical model is the logarithm of odds ratio change value, it is thus necessary to transit the estimated coefficient to odds ratio change value by specific exponential function e estimated coefficient. That is the way how estimated coefficient connected to specific odds ratio changes value. For example, the estimated coefficient of the ${\vector hqhr}$ variable equals to 0.743, the coefficient is statistically significant. It means that the commercial pension insurance purchasing probability odds ratio for individuals with high-frequency strong–high-frequency weak social interaction is 2.102 larger than that for individuals with no social behavior, which is equivalent to increasing the purchasing probability from 50% to 75%. Similarly, the estimated coefficient of the ${\vector hqwr}$
 variable equals to 0.257, the coefficient is statistically significant. It means that the commercial pension insurance purchasing probability odds ratio for individuals with pure high-frequency strong social interaction is 1.293 larger than that for individuals with no social behavior, which is equivalent to increasing the purchasing probability from 50% to 70%. Compared with pure high-frequency strong social interaction, high-frequency strong with high-frequency weak social interaction brings more commercial pension insurance purchasing probability.
Effect of social interaction of the benchmark model

***, **, and * represent 1%, 5%, and 10% significance levels, respectively.
The estimation results of fixed effects verify theoretical hypotheses 1 and 2. Firstly, compared with individuals with weak ties social interaction, individuals with strong ties social interaction have a significantly higher probability of purchasing commercial pension insurance. This feature is evident both in the economic and statistical significance of the estimated coefficients. In contrast, individuals without strong ties social interaction does not show a more significant propensity to purchase commercial pension insurance than individuals without social behavior (the positive effect of purely high-frequency weak ties social interaction is only barely significant at the 90% confidence level). Hypothesis 1 is therefore tested, i.e., strong ties social interaction positively influences individuals' commercial pension insurance product purchase behavior. As the only exception, the specificity of the pure low-frequency strong tie social interaction is itself an important piece of evidence supporting hypothesis 2.
Secondly, the estimated coefficients of the empirical model indicate that for those individuals with the same frequency of strong ties social interaction, one would have a higher probability of purchasing commercial pension insurance if he/she has a higher frequency of weak ties social interaction. Hypothesis 2 is verified that the lower the frequency of individual social interaction is, the less significant the positive effect of social interaction on the purchase of individual commercial pension insurance products exists.
3.2 Robustness check for empirical findings
There are two highlights in the empirical strategy in this paper. Firstly, social interaction variables are generated by combining social interaction intensity with social interaction frequency. Such variable setting strategy ensures the independence between social interaction dummy variables, allowing us to confidently eliminate the interference of multicollinearity when conducting statistical model estimation. Secondly,as mentioned before, MCMC Bayesian approach is employed in this paper to improve the coefficients estimation accuracy. It is therefore necessary to conduct a robust test for testing to what extent such empirical setting effects the estimated results. Empirical results would be persuasive if the empirical results of the models in this paper are in line with the models following common empirical setting.
Following the above logic, robustness tests had been conducted from two aspects: social interaction dummy variables substitution and empirical model replacement. In the part of social interaction dummy variables substitution, social interaction intensity dummy variable and social interaction frequency dummy variable are generated respectively based on the corresponding connotations. The social interaction intensity variable $( {\vector \bf gxintens})$ includes 4 levels, with 0 corresponding to “No social,” 1 corresponding to “Having both strong and weak ties simultaneously,” 2 corresponding to “Pure weak ties social interaction,” and 3 corresponding to “Pure strong ties social interaction,” The social interaction frequency variable $( {\vector \bf gxfreq})$
 includes 3 levels, with 0 corresponding to “No social,” 1 corresponding to “Low-frequency social interaction,” and 2 corresponding to “High-frequency social interaction.” For empirical model replacement, logistic regression is employed for robustness testing, which is a customary estimation method for binary dependent variable.
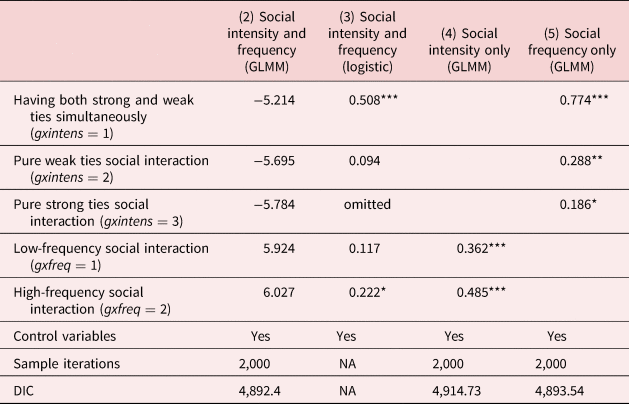
Results of the variable substitution robustness test are shown in Table 6, in which model 2 replaced social interaction variables in benchmark model separately with social interaction intensity and social interaction frequency dummy variables; model 3 used the same social interaction dummy variables as model 2, but the estimation method has been changed to logistic regression; models 4 and 5 used only social intensity and social frequency dummy variable, respectively. Results show that: firstly, replacing social interaction variables in benchmark model separately with social intensity and social frequency dummy variables has resulted in a significant issue of collinearity. This issue leads to the removal of “Pure strong ties social interaction” in logistic regression estimation, which also leads to a singular fit problem in the GLMM estimation process. Secondly, putting social intensity and social frequency dummy variable separately into the GLMM estimation resulted in meaningful estimation results, indicating that higher social frequency had a more significant and positive impact on the probability of purchasing commercial pension insurance compared with lower social frequency. At the same time, having both strong and weak social ties had a more significant and positive impact compared with weak ties or strong ties only. This result is consistent with the theoretical hypothesis proposed before, but as mentioned above, there is some overlap in the definitions of the social interaction variables. We therefore cannot accurately make statistical inferences to verify or refute the theoretical hypothesis under such a variable setting.
Results of the variable substitution robustness test

***, **, and * represent 1%, 5%, and 10% significance levels, respectively.
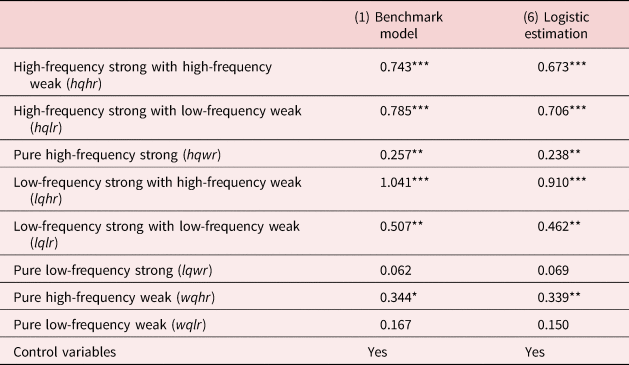
Results of the empirical model replacement robustness test are shown in Table 7, in which model 6 used the same variables as the benchmark model but the estimation method has been changed to logistic regression. The estimation results after replacing the estimation method are consistent with the benchmark model, fully demonstrating the robustness of the empirical model results.
Comparison of coefficients estimated in different empirical model

3.3 Spatial characteristics of social ties influence
The mixed model examines the fluctuations of the model estimates by adding a random-effects term to the benchmark model. Model 2 adds community, city, and province as different levels of spatial random effects, setting the prior of the spatial random-effects term as $\Pr ( {\sigma_\alpha^2 } ) \sim IW\left({\left[{\matrix{ 1 & 0 & 0 & 0 \cr 0 & 1 & 0 & 0 \cr 0 & 0 & 1 & 0 \cr 0 & 0 & 0 & 1 \cr } } \right], \;0.002} \right).$
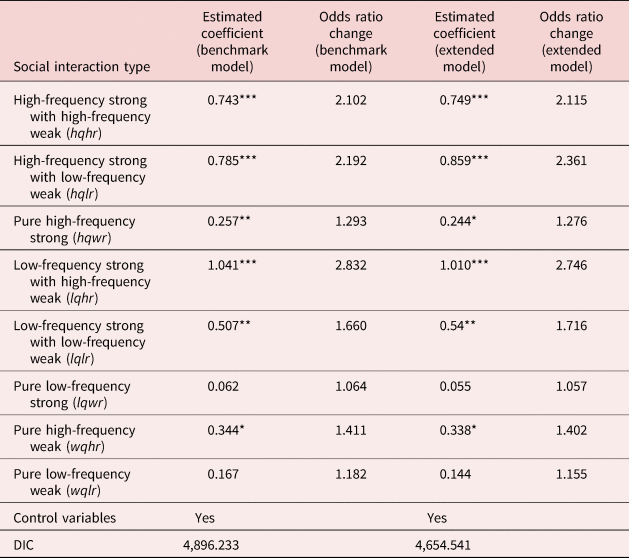
The estimated results of the extended model and the comparison of this result with the estimated results of the benchmark model are presented in Table 8. As mentioned before, the estimated coefficient of the model corresponds to specific odds ratio change value. For example, in the extended model, the estimated coefficient of the ${\vector \bf hqhr}$ variable equals to 0.749, the coefficient is statistically significant. It means that the commercial pension insurance purchasing probability odds ratio for individuals with high-frequency strong–high-frequency weak social interaction is 2.115 larger than that for individuals with no social behavior. The estimated coefficient of the ${\vector \bf hqwr}$
 variable in the extended model equals to 0.244, the coefficient is statistically significant. It means that the commercial pension insurance purchasing probability odds ratio for individuals with pure high-frequency strong social interaction is 1.276 larger than that for individuals with no social behavior.
Fixed effects of the benchmark and extended models

***, **, and * represent 1%, 5%, and 10% significance levels, respectively.
As shown in Table 8, in the fixed-effects part of the extended model, the inclusion of random effects does not affect the coefficient estimates, and the estimated coefficients of the model remain largely consistent with significance, which indicates that the coefficient estimates of the benchmark model are robust.
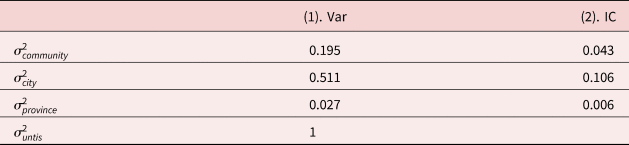
As shown in Table 9, further examination of the variance of the random effects using intraclass correlation reveals that the clustering of variance not explained by the model is more pronounced at the city level, and there are almost no unexplained systematic factors at the provincial and community levels. Therefore, it is highly likely that there are omitted factors at the city level that systematically influence the process through which social network ties affect individuals' commercial pension insurance purchasing decisions.
Random-effects variance and within-group correlation of the model

3.4 Temporal characteristics of social ties influence
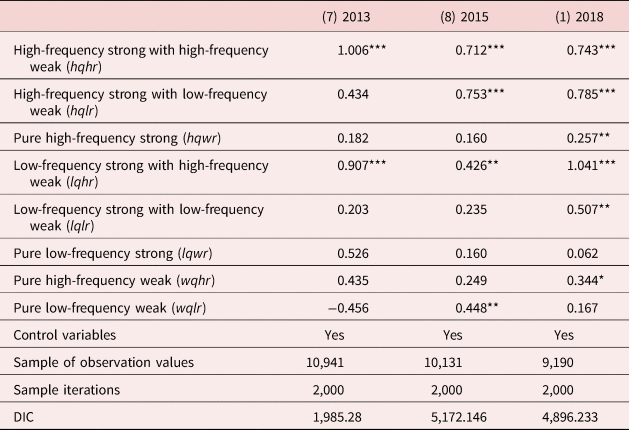
This section runs the empirical model (models 7–8) using the 60 years and younger samples from wave 3 in 2015 and wave 2 in 2013, respectively, to further examine the robustness of the empirical model estimates by adjusting the sample. Since data on the number of living children and child satisfaction is not available in the 2013 data, children-related variables are replaced with economic interactions with children, i.e., standardized amounts of parental support for children and the amount of child support for parents.
This study bases the estimation of the empirical model on the longitudinal survey database. It is reasonable to infer that the empirical results reflect the time-varying characteristics of the impact of social ties interaction for the same sample. As shown in Table 10, results of estimation show that, first, only the social interaction with strong ties reflected a significant positive impact in 2013 (the only exception is high-frequency weak ties social interaction), and the social interaction that fitted this characteristic throughout the survey period consistently showed a significant positive effect of social ties interaction. Over time, the social ties influence mechanism became more and more obvious, as more and more social interaction types showed significant positive influence. Second, the influence of strong ties social interactions gradually weakened, while the influence of weak ties social interactions gradually strengthened.
Comparison of fixed effects

***, **, and * represent 1%, 5%, and 10% significance levels, respectively.
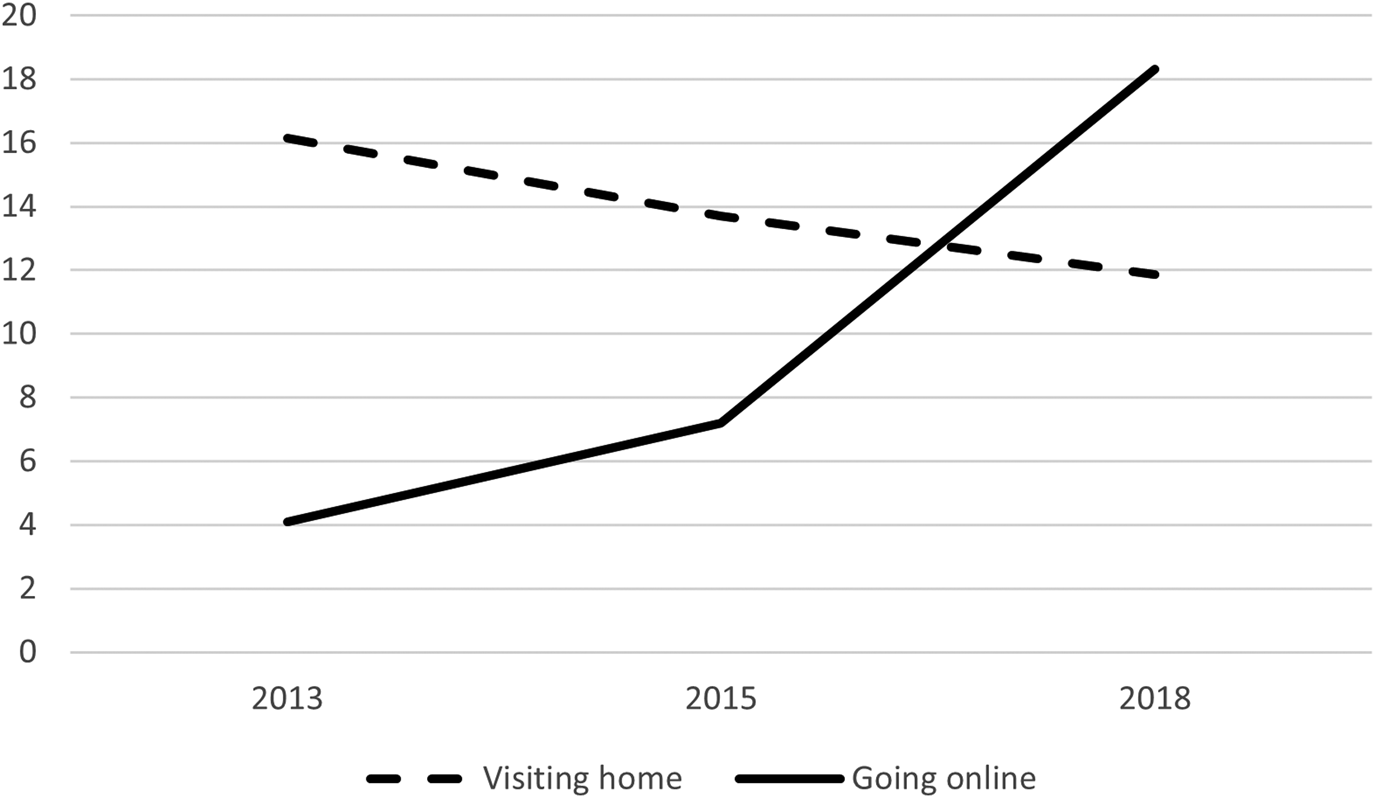
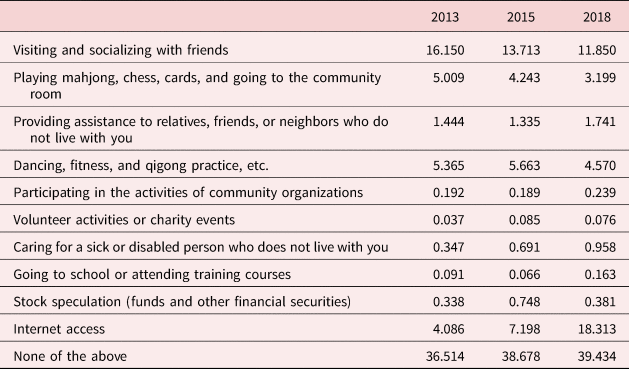
Combined with the temporal changes in the social characteristics of the sample, the estimation results of the empirical model have obvious relevance. The proportions of individuals with typical strong ties social interactions of visiting home and typical weak ties social interactions of going online had shown very different trends over the 5-year period. As can be seen from Figure 3, the proportion of individuals who had the daily behavior of visiting home and socializing with friends in the sample declined from 16.15% in 2013 to 11.85% in 2018, while the proportion of individuals who had the daily behavior of going online in the sample surged from 4.086% in 2013 to 18.313% in 2018.
Temporal trends of typical social interaction behaviors.

As shown in Table 11, among the social behaviors listed in the CHARLS, visiting home and going online are the most engaged ways. Therefore, from the perspective of statistical characteristics, between 2013 and 2018, the weight of information dissemination of weakly ties social interaction was getting bigger and the weight of social reinforcement of strong ties social interaction was getting smaller, and because of this, the influence of strong ties social interaction on purchase behavior was getting weaker and the influence of weak ties social interaction on purchase behavior was getting stronger.
Temporal variation in the proportion of social activity (daily)

4. Conclusions
This paper constructs a dyad model based on the influence path of the social network ties in individual commercial pension insurance purchasing decisions, and then validates the path by building a GLMM based on Bayesian approach with the latest CHARLS data. Results show that:
Firstly, strong ties social interaction positively influences individuals' commercial pension insurance product purchase behavior, and the smaller the frequency of individual social interaction is, the less significant the positive impact of social interaction on individual commercial pension insurance product purchase is.
Secondly, in terms of spatial characteristics, there are municipality-level omitted factors systematically influencing the ties influence process of commercial pension insurance purchase.
Finally, in terms of temporal characteristics, the weak ties social behavior represented by the Internet continues to suppress the impact of traditional strong ties social behavior on middle-aged and elderly people. The weight of information dissemination of weak ties social interaction is getting bigger and bigger, while the weight of social reinforcement of strong ties social interaction is getting smaller and smaller between 2013 and 2018, and because of this, the influence of strong ties social interaction on purchasing behavior is getting weaker and weaker, while the influence of weak ties social interaction is getting stronger and stronger.
Based on these findings, this paper proposes the following policy recommendations:
Firstly, more attention should be paid to the role of social reinforcement, the cultivation of word-of-mouth should be highly considered, and more scenarios to encourage customers' word-of-mouth sharing behavior should be created, thus forming the expansion path of bringing new ones with old ones.
Secondly, the commercial pension insurance expansion strategy based on social ties interaction should take the municipal level as the decision-making unit, and the difference between municipalities should be much larger than the difference between provinces and communities.
Finally, with the popularity and development of digital social tools, the social behavior represented by the Internet has significantly changed the intensity and frequency of social interactions among middle-aged and elderly people in China. Apart from the expansion of commercial pension insurance based on the traditional ground promotion method, the role of online promotion should be paid more attention.
Acknowledgements
We are grateful to Cao Yu and Yi Dan for helpful comments; and Zhu Qian for excellent English proofreading assistance.
Funding statement
The authors would like to express sincere gratitude for the support from the Humanities and Social Sciences Youth Foundation, Ministry of Education of the People's Republic of China (21YJCZH046).
Competing interests
None.