INTRODUCTION
Hunting for bushmeat and other wildlife products is one of the world's most pressing conservation problems (Schipper et al. Reference Schipper, Chanson, Chiozza, Cox, Hoffmann, Katariya, Lamourex, Rodrigues, Stuart and Temple2008; Laurence et al. Reference Laurence, Useche, Rendeiro, Kalka, Bradshaw, Sloan, Laurence, Campbel, Abernethy and Alvarez2012), and larger forest species in particular, including populations of primates and forest elephants, have rapidly declined (Rovero et al. Reference Rovero, Mtui, Kitigile and Nielsen2012; Maisels et al. Reference Maisels, Strindberg, Blake, Whittemeyer, Hart, Williamson, Aba’a and Abitsi2013). Savannah species are generally considered less susceptible to overexploitation (Fa & Peres Reference Fa, Peres, Reynolds, Mace, Robinson and Redford2001) and, in contrast to the situation in forests, bushmeat hunting in African savannahs and other non-forest biomes has received comparatively little attention (Lindsey et al. Reference Lindsey, Balme, Becker, Begg and Bento2013).
Particularly hunting for the bushmeat trade has the potential to rapidly deplete wildlife populations (Bowen-Jones & Pendry Reference Bowen-Jones and Pendry1999; Robinson & Bennett Reference Robinson and Bennett2000). Much research has therefore focused on recording bushmeat appearing in markets in order to infer sustainability and impacts on vulnerable species (Fa et al. Reference Fa, Juste and Castelo2000; Cowlishaw et al. Reference Cowlishaw, Mendelson and Rowcliffe2005 a). However, despite the large data potential in market records it is increasingly clear that the complexity surrounding these markets prevents firm conclusions on sustainability (Crookes et al. Reference Crookes, Ankudey and Milner-Gulland2005; Waite Reference Waite2007). Problems include market data not sufficiently well representing the species composition of animals caught (Allebone-Webb et al. Reference Allebone-Webb, Kümple, Rist, Cowlishaw, Rowcliffe and Milner-Gulland2011). In addition establishing evidence for depletion of wildlife populations is complicated by dynamics in prices of substitute goods, changes in the opportunity costs of hunting and changes in hunters’ behaviour in terms of hunting equipment used and locations targeted (Milner-Gulland & Clayton Reference Milner-Gulland and Clayton2002; Fa et al. Reference Fa, Johnson, Dupain, Lapuente, Köster and MacDonald2004; Crookes et al. Reference Crookes, Ankudey and Milner-Gulland2005).
However, a host of other relevant information can be obtained from examining the economics of hunting and trading bushmeat (Cowlishaw et al. Reference Cowlishaw, Mendelson and Rowcliffe2005 b; Kümpel et al. Reference Kümple, Milner-Gulland, Cowlishaw and Rowcliffe2010). Such knowledge is essential to make informed decisions on design of management strategies to conserve wildlife (Sutherland et al. Reference Sutherland, Pullin, Dolman and Knight2004). The efficiency of a management strategy may depend on whether hunting is primarily subsistence or commercially oriented (Kuehl et al. Reference Kuehl, Nzeingui, Le Duc Yeno, Huijbregts, Boesch and Walsh2009). The seasonal variation and function of hunting in people's livelihood strategies also need to be considered (Bennett et al. Reference Bennett, Blencowe, Brandon, Brown, Burn, Cowlishaw, Davis, Dublin, Fa, Milner-Gulland, Robinson, Rowcliffe, Underwood and Wilkie2007). Where hunting is commercial, an understanding of the organization of the market is required to enable regulation initiatives to be directed towards the optimal node in the value chain (Cowlishaw et al. Reference Cowlishaw, Mendelson and Rowcliffe2005 b; de Merode & Cowlishaw Reference de Merode and Cowlishaw2006). Regardless of which management strategy is selected, the outcome needs to be monitored because reduced supply may drive up prices, encouraging suppliers to find ways around constraints (Wilkie & Godoy Reference Wilkie and Godoy2001). Similarly, insufficient consideration of the organization of the market may merely shift the trade through other actors or along different routes (Bowen-Jones et al. Reference Bowen-Jones, Brown and Robinson2003).
Compared to West and Central Africa, very little information is available on the bushmeat trade in East Africa, possibly because enforcement of wildlife regulations is generally very strict there. The bushmeat trade occurs clandestinely in Tanzania, making it much more difficult to study compared to countries where it occurs openly in market places. It has thus been claimed that bushmeat hunting in Tanzania is mainly subsistence oriented and for local consumption (Andimile et al. Reference Andimile, Caro and Borgerhoff-Mulder2012) and conducted to meet income and food demands in the lean agricultural period (namely as a gap-filler activity; Brashares et al. Reference Brashares, Golden, Weinbaum, Barrett and Okello2011). Indeed, the misconception that illegal hunting is a low-impact subsistence activity applies to the whole savannah biome and further research is urgently needed (Lindsey et al. Reference Lindsey, Balme, Becker, Begg and Bento2013).
This study responds to this call and examines three aspects of bushmeat hunting and trade in the Kilombero Valley in Tanzania, which have implications for design of management strategies. First, we examine the motivation and temporal variation to determine whether it is, indeed, best described as a subsistence and gap-filler activity undertaken during the lean agricultural period. Second, we identify actor groups in the trade and examine their cost-benefit ratios to determine at which node in the value chain management interventions are likely to be most effective. Third, we examine variation in prices paid for individual species to determine whether there are preferences in terms of willingness to pay a price premium that indicate that enhanced enforcement would likely merely further increase prices for preferred species. We conclude by discussing different management options and strategies based on the nature and drivers of hunting, differences between actors in the market and consumer preferences for particular species.
METHODS
Study area
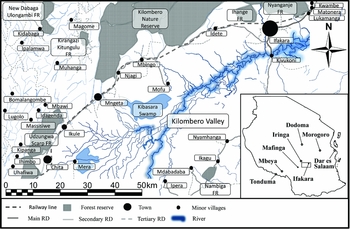
We conducted our study in the Kilombero Valley (Fig. 1), which is one of Africa's largest wetlands, spanning more than 6550 km2, and a component of the greater Selous-Niassa ecosystem to the south. To the north, the valley borders the Udzungwa Mountains, part of the Eastern Afro Montane Biodiversity Hotspot, and, to the east, Mikumi National Park. The wet season starts mid-November, with highest rainfall between March and May and short dry periods from mid-December to early March. The dry season is from June to November. The Kilombero Valley holds 75% of the world's puku (Kubus vardoni) population, believed to be declining in most of its range (near threatened), and the species’ global survival is closely tied to this site. The Kilombero Valley is designated as a Game Controlled Area (KGCA). Unlicensed hunting is prohibited but widespread and considered the main cause of decline of several species, including puku (Bonnington et al. Reference Bonnington, Weaver and Fanning2010).
Sketch map of Kilombero valley based on topographical map sheets SC-37-1 and SC-36-4 at scale 1:250 000, Series Y 503, edition 1 TSD 1961, published by the Survey Division, Ministry of Lands, Forests and Wildlife, Tanganyika, Tanzania (1962).

We focused on three anonymous villages, which we selected as they were known to have bushmeat trade. The villages are located between the KGCA and the Udzungwa Mountains. According to village chairmen, village natural resource councils and environmental committees, overseen by the village councils, conducted patrols 1–3 times per month aided by village game scouts to deter and arrest illegal hunters and bushmeat traders. Village chairmen also stated that wildlife division scouts conducted patrols in KGCA, while foresters from the district lands and natural resources office conducted patrols in Udzungwa Scarp Forest Reserve (USFR), in both cases 1–3 times per year. TANAPA (Tanzania National Parks) also has a ranger post in the general area.
Data collection
Data collection was limited to: (1) bushmeat, excluding high value complementary products; (2) village-based survey, with no attempt to participate in hunting trips; and (3) local trade, with no attempt to interview higher level actor groups along the value chain to urban centres. These delimitations were necessary in consideration of research staff security, and facilitated investigation of the bushmeat trade by avoiding more sensitive issues, such as ivory trade. We used a market survey and structured interviews to collect data.
The market survey was conducted by one local assistant in each village, working five days per week from September 2008 to October 2009. All individuals observed selling bushmeat were approached and information was obtained through informal interviews and by observing transactions. Data included origin (namely whether the bushmeat was from KGCA or USFR), species and amount of meat in stock at the beginning of the day, age of animals (young or adult), state of the meat (fresh or dried), and negotiated price. In total, 1855 such interviews were conducted. Prices of cow, goat and pig meat at the butchers’ shops were recorded daily and information on the number of domestic animals slaughtered each month was obtained from the local livestock officer.
Structured interviews (Appendix 1, see supplementary material at Journals.cambridge.org/ENC) were conducted in October and November 2011 using snowball sampling (Patton Reference Patton1990) to identify 325 individuals engaged in the bushmeat trade. Data collected include basic demographic and socioeconomic household information on income sources and shocks experienced during the past year. Income was converted to per adult equivalent units (AEU) following Cavendish (Reference Cavendish, Campbell and Luckert2002). Detailed information on function in the bushmeat trade was collected through an open-ended question. In addition, several fixed questions were posed on: (1) number and duration of hunting trips, or time spent trading bushmeat during the past month and year; (2) cost of and income from the latest hunting trip, or days spent trading bushmeat; and (3) number of times the respondent had been caught hunting or trading bushmeat and the consequences of being caught. We used recall rather than other strategies due to the sensitivity of the issue limiting data collection (see above), and reduced recollection bias by focusing on the last trip/day spent hunting or trading. Prices in 2008 and 2009 were converted to real 2011 prices by correcting for inflation using World Bank consumer price index values. Prices in US$ are provided using the average exchange rate for October–November 2011 (US$ 1 = TSh 1718).
Evaluating motivations and temporal patterns
To assess whether hunting was primarily commercially or subsistence motivated, respondents were asked about their primary reason for involvement in hunting, in terms of income generation or to provide meat for household consumption. We compared time spent hunting/trading bushmeat during the peak agricultural period (December to May) with that during the non-agricultural season to determine whether this might mainly constitute a gap-filler activity during the lean agricultural period. We also compared the amount of bushmeat available per day in the market for these two periods. We examined whether bushmeat functioned as a ‘safety net’ in times of crisis by comparing relative bushmeat income between households having and not having experienced shocks. Relative bushmeat income was calculated as the proportion of total income originating from bushmeat trade.
Calculating cost-benefit ratios
We assessed cost-benefit ratios for each actor group to determine at what point in the value chain management interventions would likely be most successful. We defined actor groups using information from informal conversations during market surveys. We assigned questionnaire respondents to groups according to their own description of their function in the trade. Cost-benefit ratios were calculated using the deterrence model (Kuperan & Sutinen Reference Kuperan and Sutinen1998) as a theoretical basis. Average cost-benefit ratios were calculated for each actor group based on the following equation:
 \begin{equation}
CB = \frac{{{\it expected}_{}\ {\it total}_{}\ {\it cost}}}{{{\it expected}_{}\ {\it gross}_{}\ {\it income}}} = \frac{{(\overline \theta \times \overline F ) + \overline {C_v } }}{{(1 - \overline \theta ) \times \overline {V_p } }}\end{equation}
where
 $\overline \theta$
is the average likelihood of being apprehended, which was determined for each actor group by first dividing total number of times caught with total number of days spent hunting or trading bushmeat in the past year (one outlier in the sample of hunters in USFR was dropped) and then converting to the per trip apprehension likelihood,
$\overline \theta$
, using the average duration of the last trip where relevant.
 $\overline F$
is the average magnitude of fines or bribes specific for each actor group, calculated from the amount paid, omitting stock confiscated but including weapons, bicycles and other materials confiscated.
 $\overline {C_v }$
is the average variable cost, and
 $\overline {V_p }$
is the average stock value estimated as reported average income from hunting or trading bushmeat last time the individual engaged in this activity. Fixed costs were minimal and therefore excluded.
Monte-Carlo simulation was used to examine the distribution of cost-benefit ratios and to explore potential effects of increased fines or likelihood of apprehension To make sure that the relationship between variable costs and stock value was reflected in the Monte-Carlo simulation, variable cost was determined for individual actors using a linear regression of the square root of variable cost on the square root of stock value. Cost, income and fines/bribes were square root transformed to normalize distributions and to avoid negative values of final back-transformed costs, incomes, and fines/bribes. The simulated average cost-benefit ratio for each actor group was based on random draws of transformed income, fine/bribe and random deviation around the linear regression. Random values were drawn from a normal distribution with mean and standard deviation corresponding to the values estimated for each variable and actor group (for a full description see Appendix 2, supplementary material at Journals.cambridge.org/ENC).
Model of bushmeat price
We examined the assumption of no difference in negotiated price between species, considering willingness to pay a price premium for particular species an expression of preference. Bushmeat is brought into villages during the night and sold the following morning as packages (kipande) of meat of varying quality and weight (2.07 kg/package ± 0.23, 95% CI, n = 143). This forced us to use ‘package’ as the unit of analysis (an assessment of the number of animals killed and traded is presented in Nielsen et al. Reference Nielsen, Meilby and Smith-Hall2014 b). We used panel data models where village v was specified as a panel data group to accommodate differences in supply and demand between villages. We incorporated time, agricultural season and price of beef in the model to accommodate general price changes, seasonal variations in the opportunity cost of hunting and prices, and effects of changes in the market price of substitute meat. Hence, the model is a linear fixed effects panel-data model where the reciprocal price of a package of bushmeat (Pbvt ) is given by:
 \begin{eqnarray}
&& - 1/Pb_{vt} = \beta _{1} S_{1,vt} + \ldots + \beta _n S_{n,vt} + \gamma t + \theta A_t + \delta Pc_{vt} \nonumber\\
&&+\, \alpha _v + \varepsilon _{vt} ,\quad v = 1 \ldots 3\,\,{\rm and}\,\,t = 1 \ldots 365\end{eqnarray}
where S 1. . .Sn are dummy variables for selected bushmeat species, t is a consecutive number assigned to each date starting with the first day in the sample period, A is a binary dummy variable reflecting the agricultural period, Pc is the price of beef, β1. . .β n , γ, θ and δ are fixed model parameters, α v is the village specific intercept, and ε vt is a normally distributed and independent error term (for a full description see Appendix 3, supplementary material at Journals.cambridge.org/ENC). We used backward elimination to reduce the model until only significant species dummies were retained. Determinants of supply were furthermore examined in terms of relations between price and number of packages available in the market. All data analysis was conducted in STATA version 11.2.
RESULTS
Motivations and temporal patterns
We interviewed 80 individuals hunting in KGCA (69) or USFR (11); 169 local traders buying meat from hunters and transporting it to the villages; and 76 local retailers selling meat in the villages. Sixty-five per cent of the traders sold meat to end consumers themselves or to transporters taking the meat to markets further away. The rest hired retailers to sell the meat in the villages. All but one stated that the main reason for their involvement in hunting was income generation. Five per cent (mainly hunters) considered this trade their primary livelihood activity, while most of the remainder referred to agriculture (93%) as their main activity. On average, bushmeat provided an estimated 36.2% (± 2.4, 95% CI) of households’ total annual cash income.
Hunters (χ2 = 4.11; p < 0.05) and traders (χ2 = 5.87; p < 0.05) spent significantly more days per month in the bushmeat trade during the non-agricultural season (Kruskal-Wallis test). There was no significant difference for retailers (χ2 = 2.63; p > 0.1). However, the difference was limited for both hunters (11.28 ± 1.4 days, 95% CI versus 9.59 ± 1.4 days, 95% CI), traders (6.29 ± 0.85 days, 95% CI versus 5.27 ± 0.9 days, 95% CI) and retailers (7.46 ± 1.2 days, 95% CI versus 6.31 ± 1.2 days, 95% CI). There was no significant difference for hunters focusing on USFR (χ2 = 4.11; p > 0.1).
The circumstances described above in relation to the trade occurring exclusively in packages of meat complicate calculation of any of the standard metrics, including kg ha−1 yr−1 and catch per unit effort, and force the use of ‘package’ (c. 2 kg) as the unit of analysis. The species traded in largest quantities were buffalo (Syncerus caffer), puku and hippopotamus (Hippopotamus amphibious) (IUCN [International Union for Conservation of Nature] listed as vulnerable; http://www.iucnredlist.org/), which contributed 69% of all packages. The vulnerable African elephant (Loxodonta africana) and the endangered Abbott's duiker (Cephalophus spadix) were also traded. Sixty per cent of packages were fresh meat, and the larger animals (such as elephant, hippopotamus and buffalo) were often traded as dried meat (unlike small animals). The economic turnover of the local market (excluding meat consumed in actors’ households or transported to other markets) corresponded to a value of US$ 70 000 in 2011 prices (number of packages multiplied by the species specific package price).
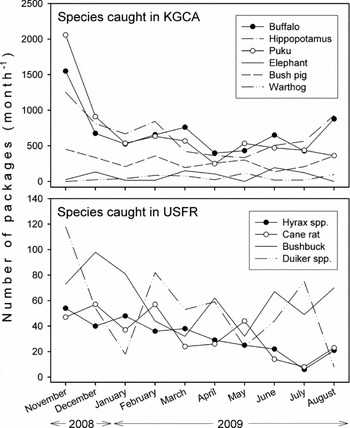
For some species the number of packages offered for sale in the villages appeared to decrease during the agricultural period from December to May (Fig. 2). The number of packages of puku meat (χ2 = 2.24; p < 0.05) decreased significantly, whereas packages of cane rat (χ2 = 1.91; p < 0.05) and duiker spp. (χ2 = 2.03; p < 0.05) increased significantly. But there was no significant difference (χ2 = 1.48; p > 0.1) in the overall number of packages available per day (Kruskal-Wallis test).
Total number of packages (fresh and dried meat) offered for sale per month in the village markets of main species primarily caught in Kilombero Game Controlled Area (KGCA) and Uzungwa Scarp Forest Reserve (USFR) in 2008 and 2009.

Thirty-three households (10%) had experienced various idiosyncratic shocks during the past year. Relative income from bushmeat was similar for households having and not having experienced shocks (χ2 = 1.02; p > 0.1). When we considered hunters only we found that relative income from bushmeat was higher for households that had not experienced a shock (χ2 = 2.95; p < 0.1; n = 69).
Cost-benefit ratios
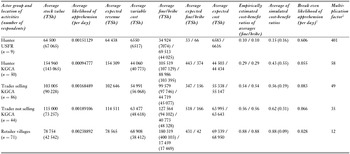
With the exception of hunters in USFR, who mainly caught small animals, average stock value declined up the commodity chain from hunters over traders to retailers owing to division of large animals into animal parts and finally packages (Table 1). Likelihood of apprehension was generally low, ranging from 0.09–0.24% chance per day engaged, being lowest for hunters in KGCA and highest for retailers that only worked in the villages. Average expected revenue for each type of engagement (namely trips versus day retailing), calculated as the likelihood of not being apprehended multiplied by stock value, declined up the commodity chain from hunters in KGCA over traders to retailers, with the exception of hunters in USFR, who caught small animals and thus had the lowest expected revenue. Average variable costs increased up the commodity chain, mainly constituting rent of firearm and purchase of ammunition for the hunters in KGCA and purchase of meat for traders and retailers. Traders not selling the meat themselves had higher costs, covering payment of retailers. Variable costs were lowest for hunters in USFR who used mainly string and wire traps. Net income from each type of engagement, calculated as average expected revenue minus average expected cost, declined up the value chain, with hunting in USFR being less profitable than hunting in KGCA. However, when taking time spent into consideration, then net income was higher for hunting in USFR, due to the low time investment in checking traps. Ninety-eight individuals (30% of sample) had been apprehended, representing 153 individual occasions. In 66% of cases, offenders had paid a bribe, whereas 19% had paid a formal fine. Amounts were highly variable, but average fines were significantly greater than bribes (t = 3.06; p < 0.01). Nevertheless, differences between fines and bribes had only marginal influence on the empirically estimated cost-benefit ratios that increase up the value chain.
Calculation of cost-benefit ratios and the simulated cost-benefit ratio for the different actor groups and sub-groups (TSh 2011 prices, values per trip except for retailers). The multiplication factor is the coefficient that accounts for the likelihood of being apprehended that would make hunting/trading bushmeat non-profitable (i.e. a cost-benefit ratio = 1). Numbers in brackets are standard deviations. Note: for hunters and traders undertaking trips of several days’ duration, the average likelihood of being caught per day is converted into a likelihood of being caught per trip using the average duration of the last trips: hunters in USFR = 0.624 (0.621) days; hunters in KGCA = 4.434 (2.850); traders selling = 2.068 (1.426); traders not selling = 2.148 (1.618), where numbers in brackets are standard deviations. †The break-even likelihood of apprehension corresponds to a simulated mean cost-benefit ratio of 1. Costs and revenues are assumed unchanged. ‡Multiplication factors are calculated as the break-even likelihood of apprehension divided by present average likelihood of apprehension.

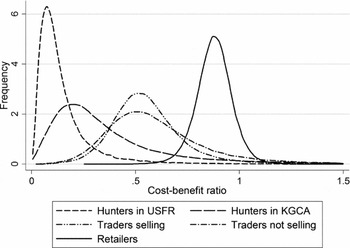
We mainly present simulation results based on fines to provide information on the cost-benefit ratios that would be expected if apprehensions occurred in accordance with specifications in the legislation. Average simulated cost-benefit ratios increased steeply up the commodity chain, with the lowest ratio for hunters in USFR and the highest for retailers (Table 1). The simulated distribution of cost-benefit ratios indicates, that actor groups (but not sub-groups) were quite distinctly defined (Fig. 3). Plotting the average cost-benefit ratio as a function of the likelihood of apprehension illustrates that a considerable increase is required to make the trade non-profitable (Appendix 4, Fig. S1, see supplementary material at Journals.cambridge.org/ENC). The number of patrols required to make hunting in KGCA non-profitable to the average hunter is as much as 58 times greater than the current level, assuming a linear relationship between patrolling effort and likelihood of apprehension, and considerably more in USFR. In comparison, the effort required to make activities non-profitable for retailers was 12 times the current level. If adjusting only the magnitude of the penalty, fines of the order of TSh 2–34 million (US$ 1500–20 000) depending on actor group, as compared to the current average fines of TSh 35 000–180 000 (US$ 20–105), would be needed to make the trade non-profitable (Appendix 4, Fig. S2, see supplementary material at Journals.cambridge.org/ENC).
Density plot of simulated cost-benefit ratios for the various actors in the local value chain.

Price of bushmeat species
In total, we recorded 1186 observations of people selling packages of fresh bushmeat and 641 observations of packages of dried meat (28 were packages of unknown state). An additional 58 observations were of whole animals where no package price was obtained. Expressing all prices in 2011 values, fresh bushmeat (TSh 2609 ± 34, 95% CI) was overall significantly cheaper than dried meat (TSh 4937 ± 231, 95% CI) (t = 25.62; p < 0.01) per package for all species combined. However, we suspect that part of the dried meat was actually traded in larger clumps (mandas) of meat destined for longer distance transport to other markets. We therefore omitted dried meat from further consideration. Fresh bushmeat was also significantly cheaper than beef (TSh 4392 ± 27 kg−1, 95% CI; t = 80.01; p < 0.01), pork (TSh 3042 ± 16 kg−1, 95% CI; t = 22.79; p < 0.01) and goat (TSh 4745 ± 64 kg−1, 95% CI; t = 75.06; p < 0.01) meat. Furthermore, the prices of domestic animal meat per kg were recorded at the local butcher, whereas bushmeat was sold in packages of c. 2 kg. The price also varied significantly between villages (one-way ANOVA with Bonferroni F = 325; p < 0.01; fresh bushmeat all species combined, 95% CI, village A TSh 2642 ± 33 package−1; village B TSh 3047 ± 48 package−1 ; village C TSh 2156 ± 62 package−1).
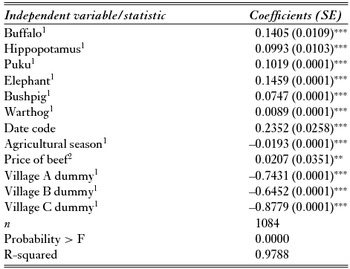
The model of the price of bushmeat revealed inflation in terms of a significant positive effect of day number on price per package (Table 2). The effect of the agricultural season was significant and negative, and the model indicated that prices per package of bushmeat were approximately TSh 100 lower during the peak agricultural period. The effect of the price of beef was significant and positive, albeit small. Comparison between village dummies furthermore revealed that the price of bushmeat was higher in the smaller village B. Compared to other species, we obtained significant positive effects on price for elephant, buffalo, hippopotamus, puku, warthog and bushpig. Inspection of diagnostic plots (q-norm plot) for the model indicated that the residuals were well behaved, although data did not perfectly follow a normal distribution (tails were truncated; Appendix 4, Fig. S3, see supplementary material at Journals.cambridge.org/ENC). A basic analysis of variance of price per package for selected species is presented in Appendix 4 (Table S2, see supplementary material at Journals.cambridge.org/ENC).
Fixed effects model of the reciprocal price per package for fresh bushmeat derived using Eq. (2); non-significant species act as base group. Regression coefficients with robust standard errors in brackets. *, ** and *** signify statistical significance at 0.1, 0.05 and 0.01 levels, respectively. 1Coefficients multiplied by 1000. 2Variables scaled to 1 million TSh per package.

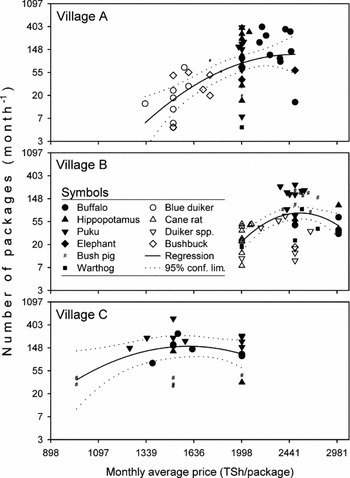
Moderate to strong positive correlations were observed between the average monthly species specific price and number of packages of the relevant species available in village A (r = 0.55; p < 0.01, n = 66) and village B (r = 0.37; p < 0.01, n = 59) (Pearson product moment correlation, both variables log transformed). However, for several species, there was limited correlation between price and number of packages when species were considered separately (see Fig. 4). The observed pattern may furthermore occur if species with the highest prices are also those producing more packages per animal (high weight species). This seems to be the case for buffalo and hippopotamus in village A and hippopotamus in village B.
Number of packages of fresh bushmeat available in village A, B and C as a function of average monthly price per package.

DISCUSSION
Motivations and temporal patterns
Almost all respondents in the Kilombero Valley were motivated by income generation, indicating that hunting is primarily commercially oriented. In comparison, studies in the Serengeti have found that 61–75% of respondents hunted for subsistence (Holmern et al. Reference Holmern, Røskaft, Mbaruka, Mkamba and Muya2002; Mfunda & Røskaft Reference Mfunda and Røskaft2010), although others found that 75% of arrested offenders hunted for cash income (Loibooki et al. Reference Loibooki, Hofer, Campbell and East2002). Bushmeat hunting is considered to be changing from subsistence driven to commercially oriented due to increasing demand from urban populations, improved access and technology, integration of remote communities into the market and increasing poverty (Robinson & Bennett Reference Robinson and Bennett2000), but the distinction between subsistence and commercial hunting is often blurred (Bowen-Jones et al. Reference Bowen-Jones, Brown and Robinson2003; Kümple et al. Reference Kümple, Milner-Gulland, Cowlishaw and Rowcliffe2010). The strong commercial focus in the Kilombero Valley may be related to easy transport by train, bus and truck, combined with the wetlands’ high productivity for wildlife. This indicates that management efforts need to address the economic incentives of actors operating in the bushmeat market, rather than initially focusing on involved household's food security.
We furthermore found that (1) there was no correlation between shocks and economic dependence (relative bushmeat income), as would be expected if hunting and trading bushmeat functioned as a safety net; (2) there was no difference in the number of packages of meat available per day between the peak agricultural and non-agricultural period; and (3) time spent hunting and trading bushmeat declined but remained high during the agricultural period, contrary to expectations if hunting was primarily a gap-filler activity. Hence, our results do not support the finding of a recent study that hunting mainly functions as a safety net (actually a gap-filler) in the lean agricultural season (Brashares et al. Reference Brashares, Golden, Weinbaum, Barrett and Okello2011). The variation in our data indicates decreased hunting effort in KGCA during the peak agricultural period, but increased hunting effort in USFR, consistent with the location of many farms on the slopes of USFR. Hence, it appears that the bushmeat trade in the Kilombero Valley is a year-round income earner, but that hunters, to some extent, adjust the location for their hunting efforts to other income-generating activities. This indicates that management efforts should be based on an understanding of the organization of the market (see Nielsen et al. Reference Nielsen, Meilby and Smith-Hall2014 b) and actors’ cost-benefit ratios to enable design of management strategies targeted at the optimal node in the value chain rather than attempting to provide alternative options for vulnerable groups experiencing income gaps or shocks.
However, the question remains whether the observed situation represents a normal year and whether hunting is sustainable. Aerial surveys have revealed significant declines in numbers of buffalo, hippopotamus and warthog, and non-significant declines in puku and elephant numbers from 1991 to 2009 (TAWIRI [Tanzania Wildlife Research Institute] 2009) suggesting that hunting is unsustainable for several species. Available evidence furthermore indicates that bushmeat hunting tends to increase under conditions of economic and political instability (de Merode & Cowlishaw Reference de Merode and Cowlishaw2006). For instance, trade in bushmeat arose at several locations in Tanzania as a result of an influx of refugees (Jambiya et al. Reference Jambiya, Milledge and Mtango2007). In Kenya, increased ivory poaching appeared to be linked to economic downturn (Wittemyer Reference Wittemyer2011). This suggests that macroeconomic fluctuations will affect hunting (Gill et al. Reference Gill, Fa, Rowcliffe and Kümple2012; Sayer et al. Reference Sayer, Endamana, Ruiz-Perez, Boedhihartono, Nzooh, Eyebe, Awono and Usongo2012). The market survey in this study was conducted during the onset of the global financial crisis in September 2008, which has led to reduced economic growth and increased inflation in Tanzania. It is therefore likely that the results of this study are influenced by these events and that bushmeat hunting in the Kilombero Valley intensified and was further commercialized to compensate for increased prices of imported goods and lower prices obtained for locally produced commodities as an effect of the global financial crisis.
Cost-benefit ratios
Our results reveal distinct differences in cost-benefit ratios between actor groups, which may enable design of management strategies targeted at specific nodes in the value chain. The efficiency of strategies to manage the bushmeat trade is expected to increase by targeting the smallest actor group handling the highest market share (Cowlishaw et al. Reference Cowlishaw, Mendelson and Rowcliffe2005 b). In the Kilombero valley, hunters are the actor group that best match this description. However, hunters plying their trade in the bush are considerably more difficult to observe than other actors in the value chain. Simulation of cost-benefit ratios furthermore indicate that increasing the likelihood of apprehension sufficiently to make hunting unprofitable would require a level of patrolling that is unattainable considering the staff and funding available in most protected areas in Tanzania. This result was based on the simplifying assumption of a linear relation between patrolling effort and likelihood of apprehension, necessitated by the lack of detailed knowledge about the system's response to variation in patrolling effort. However, the assumption is likely to be correct across much of the continuum due to the very low current patrolling effort (and the very large area of the Kilombero Valley). Inspection of current likelihoods of apprehension furthermore reveals that, although the relation to patrolling effort may be non-linear at high levels, a very large increase in patrolling frequency is required.
Hunters in USFR had the lowest cost-benefit ratios. This is partially due to the very short time required to check traps that are often set in close proximity to agricultural fields, near the forest boundary, and the resulting low likelihood of apprehension. However, hunting in USFR is not very profitable compared to KGCA. This is also true when time spent per trip is taken into consideration, because of the low opportunity cost of time. Fewer people are therefore involved, resulting in a small sample size, which complicates analysis.
Traders can be detected more easily, carrying meat along bush trails to villages. Existing checkpoints on roads and controls on the train could also be upgraded, for instance by using trained dogs to target non-local traders. However, simulations indicated that, for traders too, a considerable increase in likelihood of apprehension is required. Furthermore, only a proportion of the meat is exported to other markets in Tanzania, as local demand is amplified by a large number of military households residing in the area.
Results indicate that the cost-benefit ratio can most easily be manipulated for retailers. However, the impact on the quantity traded is likely to be minimal, as the trade may simply shift to other actors in the value chain. Most traders already sell the meat themselves and entry barriers for retailers are low (Nielsen et al. Reference Nielsen, Meilby and Smith-Hall2014 b) suggesting that they can easily be replaced. Retailers are furthermore hired as casual labourers paid per package sold (e.g. TSh 300 package−1 sold for TSh 3000, 2011 prices), and hence have very limited costs. They may furthermore not be expected to replace confiscated stock if caught. A simulation based on this information reveals that retailers have the lowest cost-benefit ratio of any group (at 0.08).
Hence, analysis based on the actor groups’ cost-benefit ratios and insights into the organization of the value chain suggests no single actor group for whom the cost-benefit ratio can easily be manipulated to enable regulation of the trade through enforcement alone, given current budget and capacity constraints. The calculated cost-benefit ratios, however, only represent a partial description of the possible concerns of the various actors and assume that they are risk neutral and fully informed to make rational decisions, which is unlikely to be the case. For instance, the analysis does not encompass risk of physical injury by wildlife or enforcement staff, or the opportunity cost of prison time. Furthermore, due to the low likelihood of apprehension, a number of factors remain poorly described, including the relationship between the duration of a trip and the likelihood of apprehension, the proportion of the stock value actually lost when apprehended (part of the stock may be hidden or already sold) depending on actor group, and the relationship between fine/bribe and species hunted/traded. Finally, the effect of enforcement activities will depend on consumers’ willingness to pay, as suppliers will include increasing cost of fines and bribes in the price of bushmeat. This indicates that decisions on management strategies must consider consumers’ willingness to pay.
Prices of bushmeat species
We found that bushmeat was significantly cheaper than domestic animal meat, which may provide room for suppliers to increase prices to cover additional costs of enhanced enforcement efforts. This finding is typical in rural areas at a range of locations (Wilkie et al. Reference Wilkie, Starkey, Abernethy, Effa, Telfer and Godoy2005; van Vliet et al. Reference van Vliet, Nebesse, Gambalemoke, Akaibe and Nasi2012), including the Serengeti, where bushmeat is more easily available and considerably cheaper than alternatives (Loibooki et al. Reference Loibooki, Hofer, Campbell and East2002; Ndimbalemba & Songorwa Reference Ndimbalemba and Songorwa2007; Mfunda & Røskaft Reference Mfunda and Røskaft2010). The effect of the price of substitute meat in the model of the price of bushmeat was in this respect very small indicating that domestic animal meat and bushmeat are relatively distinct products with limited relation in terms of price as has been observed in other locations (van Vliet et al. Reference van Vliet, Nebesse, Gambalemoke, Akaibe and Nasi2012).
We found that a price premium was paid for meat of some species. This is contrary to other locations where the price of bushmeat appears to be unrelated to species or rarity (Wilkie & Godoy Reference Wilkie and Godoy2001; Macdonald et al. Reference Macdonald, Johnson, Albrechtsen, Dutton, Seymour, Dupain, Hall and Fa2011; van Vliet et al. Reference van Vliet, Nebesse, Gambalemoke, Akaibe and Nasi2012). It has therefore been suggested that bushmeat hunters in Africa do not select prey based on consumer preferences (Macdonald et al. Reference Macdonald, Johnson, Albrechtsen, Dutton, Seymour, Dupain, Hall and Fa2011). However, people in Africa, as well as Africans abroad, eat bushmeat even when cheaper alternatives are available (Bennett Reference Bennett2002; Chaber et al. Reference Chaber, Allebone-Webb, Lignereux, Cunningham and Rowcliffe2010), and studies indicate that consumers differentiate between species and that wildlife cannot be considered a generic food group (Schenk et al. Reference Schenck, Nsame, Starkey, Wilkie, Abernethy, Telfer, Godoy and Treves2006). In the Kilombero Valley, the price premium was paid for fresh meat of some species caught in KGCA (plus bush pig) and we assume that this willingness to pay higher prices per package reflects taste, cultural or other preferences, as observed in other locations (East et al. Reference East, Kümpel, Milner-gulland and Rowcliffe2005; Schenck et al. Reference Schenck, Nsame, Starkey, Wilkie, Abernethy, Telfer, Godoy and Treves2006; Ndibalema & Songorwa Reference Ndimbalemba and Songorwa2007), although we cannot exclude minor effects of differences in package weight. Whereas scarcity of a particular species in the market in basic theory would be expected to slow consumption and encourage substitution with alternative species (Albrechtsen et al. Reference Albrechtsen, Macdonald, Johnson, Castelo and Fa2007), demand may respond differently if consumption of these species is driven by strong preference or culturally determined and substitutes are not readily accepted (Fa et al. Reference Fa, Albrechtsen, Johnson and Macdonald2009). Thus, if preference and hence demand for particular species is sufficiently strong, this may drive up the price, provide incentive for targeting these species, and encourage search for ways around increased enforcement and other supply constraints (Wilkie & Godoy Reference Wilkie and Godoy2001; Cowlishaw et al. Reference Cowlishaw, Mendelson and Rowcliffe2005 b).
We also found that more packages were supplied of species that command higher prices, suggesting that more of these animals were killed. However, most of the preferred species also produce a higher number of packages per animal and the situation is complicated by the problem of estimating the total number of animals killed from number of packages available considering uncertainty about the proportion of the meat consumed in actors’ households or exported to other markets. The possibility that price is a parameter in hunters’ ‘foraging strategy’ is supported by the observed significant (as well as non-significant) decline in the abundance of most of the relevant species.
Our results indicate that the situation was opposite in relation to species caught in USFR that were characterized by low availability and price suggesting low catch and limited preference. Hunting of these species was mainly conducted with traps and the meat may therefore be less fresh, hence explaining the lower price. In combination with the possible increase of hunting in USFR during the agricultural period this may explain the negative effect of agricultural period in the model of the price of a package of bushmeat (Table 2). The indication of low demand for species from USFR is good news from a conservation perspective as the forests in the Udzungwa Mountains support high levels of endemism (Burgess et al. Reference Burgess, Butynski, Cordeiro, Doggart, Fjeldså, Howell, Kilahama, Loader, Lovett, Mbilinyi, Menegon, Moyer, Nashanda, Perkin, Rovero, Stanley and Stuart2007). However, alternative explanations for the low availability is that most mammal populations in USFR already are severely depleted (Nielsen & Treue Reference Nielsen and Treue2012; Rovero et al. Reference Rovero, Mtui, Kitigile and Nielsen2012) or that the destination for most of the meat is villages on the Iringa side of USFR, outside the present study area. The price of bushmeat may also decrease in the agricultural period simply because people, partly through protection against crop damage, generally have greater access to wildlife in their farms, both on the slopes of USFR and within KGCA, thereby reducing the demand for bushmeat and forcing traders to reduce prices.
Managing the bushmeat trade
This study has provided information facilitating design of targeted strategies for management of bushmeat hunting in the Kilombero Valley. This includes evidence that bushmeat hunting is commercially oriented and overwhelmingly motivated by income generation as a year-round stable income generating activity rather than a gap-filler or a safety net. Information on actors’ cost-benefit ratios furthermore revealed that high profitability of the trade makes a sufficient increase in the likelihood of apprehension untenable as a sole management strategy. This conclusion is supported by choice experiments in the Kilombero Valley, indicating that the effect of patrolling frequency and magnitude of fines on the choice to engage in hunting and trading bushmeat was very low compared to a salary in an alternative occupation (Nielsen et al. Reference Nielsen, Jacobsen and Thorsen2014 a). Enforcement alone will furthermore not reduce demand, is complicated by high prevalence of corruption of enforcement staff (Nielsen et al. Reference Nielsen, Meilby and Smith-Hall2014 b), and is therefore unlikely to be sustainable once the initial enthusiasm wears off (Milner-Gulland & Clayton Reference Milner-Gulland and Clayton2002; Bowen-Jones et al. Reference Bowen-Jones, Brown and Robinson2003). Higher prices were paid for certain species reflecting preferences that may lead hunters to target these species. Preference may thus drive up prices for these species if increased enforcement restricts supply, encourage hunters to seek ways around these constraints and shift the trade through other actors in the value chain, thereby reducing efficiency of enforcement efforts.
However, a group who may constitute an effective entry point for curbing illegal hunting activities that was not included in this study is the firearms owners. Most hunters depended on renting firearms from retired or active staff from the nearby national service military station, and from others owning licensed firearms. Owners of licensed firearms constitute relatively easy targets for management interventions through the registered information. TANAPA has previously almost eliminated licensed as well as unlicensed firearms in nearby locations through use of local informers and a period of safe conduct with compensation for handing over firearms (Nielsen Reference Nielsen2011). This would also reduce incidences where such weapons have been used in highway robbery. Tanzania has been reviewing its firearms legislation in order to comply with international protocols on small arms control. To what extent the new legislation helps to reduce the number of existing firearms and stops influx from surrounding countries remains to be seen. Finally, a promising approach to arrest current declines in wildlife populations is through decentralized natural resource management (Nielsen & Treue Reference Nielsen and Treue2012). By devolving wildlife ownership and management rights and securing a fair distribution of benefits, incentives could be generated for communities to regulate access to wildlife and ensure long-term sustainable use.
ACKNOWLEDGEMENTS
We are grateful to the actors in the Kilombero Valley bushmeat trade for entrusting Martin R. Nielsen with information about their activities. We are indebted to Bonny Kisoma who has been an invaluable fieldwork assistant through the past 10 years, but tragically passed away after this project. We extend our condolences to his family. Thanks to Rolf D. Baldus and Francesco Rovero for useful information and comments on earlier drafts. The work was funded by the Centre for Macro Ecology, Evolution and Climate under the University of Copenhagen and the Danish National Research Foundation.
Supplementary material
To view supplementary material for this article, please visit Journal.cambridge.org/ENC