I. INTRODUCTION
Airborne dust, on construction sites, can contain mixtures of crystalline and amorphous substances that may be hazardous to workers' health. Occupational hygienists are often restricted to the gravimetric analysis of the total amount of inhalable dust to assess the workers' exposures because an analytical method is not yet available to distinguish between different components. The term “inhalable” refers to a health-related particle size definition for the fraction of particles that can be inhaled into the nose and mouth (CEN, 1993). The inhalable size definition includes particles with aerodynamic diameters below 100 µm. Inhalable dust measurement is a widely used approach for the assessment of a construction carpenter's exposure to wood dust; however, it does not specifically measure the component of interest within the matrix. Gravimetric analysis may overquantify the proportion of wood in the dust sample because other substances are present in the atmosphere. Also, the measurement of the total sample is not informative, since the hygienist has to make assumptions about the proportion of the hazardous substance/s within the matrix.
The aim of this study was to evaluate the performance of a potential approach to obtain a more comprehensive picture of workers' exposures by quantifying the contribution of each crystalline component in a personal dust sample. This work was done to support an exposure survey for the measurement of carpenters at construction sites. Dust collected by personal inhalable sampling of carpenters at construction sites may contain mixtures of mineral (e.g., quartz, gypsum, or calcite) and wood dust. In this scenario, there was a need to assess both the wood dust and the proportion of minerals that were part of the exposure matrix. The Rietveld method does not calculate the amorphous proportion unless an internal standard is added. The measurement strategy employed was to use the external standard measurement of one common component as an internal standard for Rietveld to more accurately determine the proportions of both the amorphous and crystalline material.
X-ray powder diffraction (XRPD) is a powerful technique to identify and quantify different crystalline phases in polycrystalline samples. The most commonly employed XRPD method used for the analysis of hazardous components in aerosols collected onto filters is an external standard method (Pickard et al., Reference Pickard, Walker and West1985; HSE, 2014). This approach involves the calibration of a single hazardous analyte (e.g., respirable crystalline silica) collected on a filter and uses an external monitor to correct the intensity for the deterioration of tube drift. It is commonly assumed that matrix absorption of X-rays is minimal because the sample is a thin layer, however, absorption does occur at certain sample loadings and deposit areas (Mecchia et al., Reference Mecchia, Pretorius, Stacey, Mattenklott and Incocciati2013). This matrix absorption is then corrected using the attenuation of the reflection from a silver filter placed under the air sampling filter (NIOSH, 2003; ISO, 2015). Some analytical methods involve the recovery of the aerosol dust from the sampling filter and its deposition onto a silver filter (NIOSH, 2003). Analytical methods involving recovery are not appropriate for multicomponent analysis, since the process of collecting dust from the aerosol to the analysis filter can alter the chemical composition of some components. Relative intensity ratio (RIR) and Rietveld are two methods widely used for the analysis of crystalline phases in bulk material. The RIR method (Hubbard and Snyder, Reference Hubbard and Snyder2013) is an internal standard method which involves a comparison of the intensity of the strongest reflection of the measurand with that of a reference (usually alumina). The reference is either added to the sample, which is difficult to achieve with an aerosol sample, or measured externally using the local measurement conditions. Published RIR ratios are available from powder diffraction reference files to facilitate analysis without the need to measure the reference, however, they are generally considered to provide only semi-quantitative results (Hillier, Reference Hillier, Worden and Morad2009). The “Rietveld method” is a computational process used with XRPD.
Rietveld fits a calculated profile to match the XRPD pattern. It was first used to refine the crystal structures from neutron diffraction data (Rietveld, Reference Rietveld1969). The difference between the collected XRPD pattern and the calculated profile is reduced to the lowest least squares fit for each intensity position on an X-ray diffraction pattern (Bish and Post, Reference Bish and Post1993). The method relies on the correct identification of the structures of crystalline components of interest from databases. The Rietveld method uses information about the crystalline structure and atomic position data, either determined directly from the literature or from a database such as the International Centre for Diffraction Data (ICDD) PDF-4+ 2019 database (ICDD, 2018) to calculate the volume of the crystal cell to provide quantitative values. Hill and Howard (Reference Hill and Howard1987) first discussed the use of the Rietveld method for quantitative analysis of compounds where the mass of a crystalline component in a powder was proportional to its intensity scale and the mass and volume of the unit cell. Later, Bish and Post (Reference Bish and Post1993) demonstrated the value of Rietveld for XRPD quantitative mineralogical analysis using a variety of matrices and X-ray sources. Results obtained by Bish and Post (Reference Bish and Post1993) were generally within 2.5% (absolute) of the expected values. It was not until 2012 that Rietveld analysis was evaluated for its use in measuring quartz in bulk samples from workplaces (Martin et al., Reference Martin, Beauparlant, Lesage and Van Tra2012). Martin et al. (Reference Martin, Beauparlant, Lesage and Van Tra2012) reported an absolute error of <2%. Rietveld has several advantages over other quantitative approaches used in X-ray diffraction. For example, it uses the whole X-ray pattern and the algorithm can adjust for factors like preferred orientation (e.g., elongated or platy crystals lying on a flat surface), microabsorption, and extinction (with larger crystals) (Bish and Post, Reference Bish and Post1993). The significant advantage of this method is that Rietveld can potentially provide a multicomponent analysis without the need for specific calibrations. Moreover, the use of an internal standard corrects the results obtained for the presence of any amorphous component and potentially improves its accuracy.
Despite the excellent results obtained on bulk samples, the performance of the Rietveld method for quantification of aerosol dust collected on sampling filters has not yet been reported. Jancsek-Turóczi et al. (Reference Jancsek-Turóczi, Hoffer, Nyírő-Kósa and Gelencsér2013) conducted the Rietveld analysis on the PM10 particle size fraction of re-suspended road dust. No performance data were provided and PM10 is different from the inhalable fraction.
II. METHODS AND MATERIALS
A. Preparation of calibration and test samples
Test samples were prepared to compare the performance of the Rietveld method against the proportion of the gravimetric mass of each analyte loaded onto the aerosol sampling filters and to compare the Rietveld method with the external standard method, commonly employed in on-aerosol filter XRPD analysis methods.
Analysis of samples from new build construction worksites showed that gypsum, kaolinite, quartz, and calcite were common components. Calibrations for the external standard method were prepared for each analyte. The following materials were used for calibration and preparation of test samples: analytical grade gypsum (Fisher Scientific Ltd, Loughborough, Leicestershire, UK), calcite (Specpure, JMC, Johnson Matthey Chemicals Ltd, Royston, Hertfordshire, UK), kaolinite (Georgia, USA), and quartz (Quin1B, INRS, France). The calibration filters contained a single analyte deposited onto the filter. The Rietveld method does not require calibration.
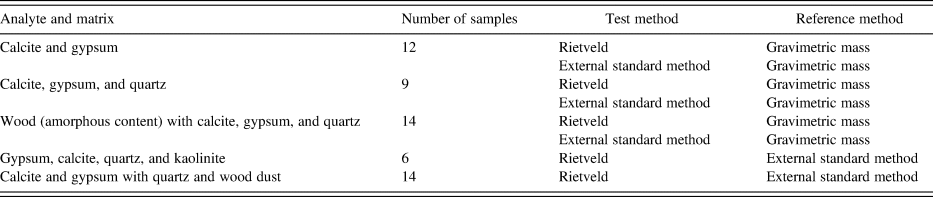
Test filters containing mixtures of dust were used to test the Rietveld and external standard methods. Samples were prepared by collecting aerosolised dust onto 25 mm diameter quartz (QMA) fibre filters (Fisher Ltd, UK). Quartz fibre filters were used because they were needed by a thermal gravimetric measurement for wood content on later worksite samples. An aerosol of each test dust was generated inside a glass bowl by applying pressurised air. The samples were collected with an inhalable Button sampler operating at 4 L min−1. The flow rate through the Button sampler was calibrated using a TSI 4100 primary calibrator (TSI Inc., Shoreview, USA). The dust bowl equipment is the same as that described in the HSE published Methods for the Determination of Hazardous Substances (MDHS) 101 (HSE, 2014) and used to prepare standards for respirable crystalline silica analysis. The glass jar was earthed (grounded) to reduce static and agglomeration of particles. Testing the Rietveld method's performance on replicate samples was not possible because the amount loaded onto each filter from an aerosol of dust cannot be accurately repeated with this the type of sample preparation for aerosol sampling filters. The performance of Rietveld was assessed by comparing the expected and measured proportions of each component over a range of mass loadings. Proportions of each component were loaded sequentially on a proportion of test filters. The mass of each component was determined gravimetrically and through XRPD measurement using external standard calibrations. Test samples containing all four mineral components were prepared by aerosolising a dust mixture rather than loading each sequentially. The different test sample preparation was done to reduce the total loading and provide low individual analyte masses to test the limitations of the analytical approach. The test samples and methods applied for comparison are outlined in Table I.
Matrix, number of test samples, and methods applied.

The Rietveld values for the test samples with four components are only compared with the measured XRPD values. Wood dust was loaded on top of 14 samples containing a matrix of quartz, gypsum, and calcite. One test sample with wood dust contained only two mineral components (calcite and gypsum).
B. Data collection
An X-pert pro MPD XRPD instrument (Panalytical Ltd, Hertfordshire, UK) with Bragg–Brentano focusing geometry was used for analysis. This instrument had automatic divergence and anti-scatter slits set at 18 mm, a nickel filter for reduction of CuKβ radiation and a 20 mm diameter mask positioned after the X-ray tube in front of the 0.04 rad soller slits. The X-ray power was set to 45 kV and 40 mA. A silver filter was used as a backing filter during each analysis for absorption correction (Mecchia et al., Reference Mecchia, Pretorius, Stacey, Mattenklott and Incocciati2013). The analytical programme scanned the range 6–55° 2θ for the characterisation of the aerosol collected on the filter samples. The instrument scan used a measurement rate of 45 s per 0.03° step. Rietveld analysis is usually undertaken on patterns collected with fixed slits. The patterns were therefore converted to 1° fixed slit patterns using the software available in Xpert Highscore™ (Panalytical Ltd). External standard calibrations were prepared to compare with percentage values produced by Rietveld analysis. One of the measured components would also provide an internal standard to quantify the amorphous components (wood dust) for the Rietveld analysis. The external standard calibration uses a separate measurement to correct for the intensity of the X-ray source. An aluminium plate was used as the external standard.
The test and calibration samples were placed on top of a silver filter for potential depth and absorption correction following X-ray absorption correction equation in the National Institute for Occupational Safety and Health method 7500 (NIOSH, 2003).
C. Data analysis
Identification of crystalline phases in the XRPD pattern was done using the PAN ICSD 2012 database (Belsky et al., Reference Belsky, Hellenbrandt, Karen and Luksch2002; Hellenbrandt, Reference Hellenbrandt2004). Reference patterns were selected by the analysts from the list provided by Xpert Highscore™ software.
1. Rietveld method
Rietveld analysis for quantification was performed using the Xpert Highscore™ software package (Degen et al., Reference Degen, Sadki, Bron, König and Nénert2014). The algorithms available in Xpert Highscore ™ modelled the background from the filter. This modelled background was used for the Rietveld analysis rather than the options available in the Highscore software's Rietveld analysis process because none of the available options in the Rietveld software package seemed to match the background produced by the filter material. Parameters for the intensity scaling (I), temperature factor (B), slight changes in crystal lattice (a,b,c and occasionally α,β,γ), and shape of the peaks (W and U) were refined together in the manual mode. No other peak shape and position parameters were refined. The parameters were applied sequentially for very low-intensity reflections, i.e. scale and temperature factors were applied before crystal lattice and peak shape factors. The background peaks from the silver backing filter were included in the initial Rietveld fitting and then removed from the analysis for the final reporting of the proportions of each crystalline material in the sample. The Rietveld method needs addition of an internal standard in order to provide a value for the proportion of amorphous material (assumed to be wood in this case). It is not possible to uniformly add an internal standard to an aerosol sampling filter, so the proportion of one external standard method measured component was entered into the Rietveld software.
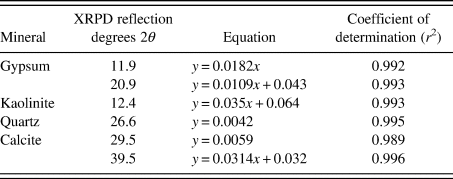
2. External standard method
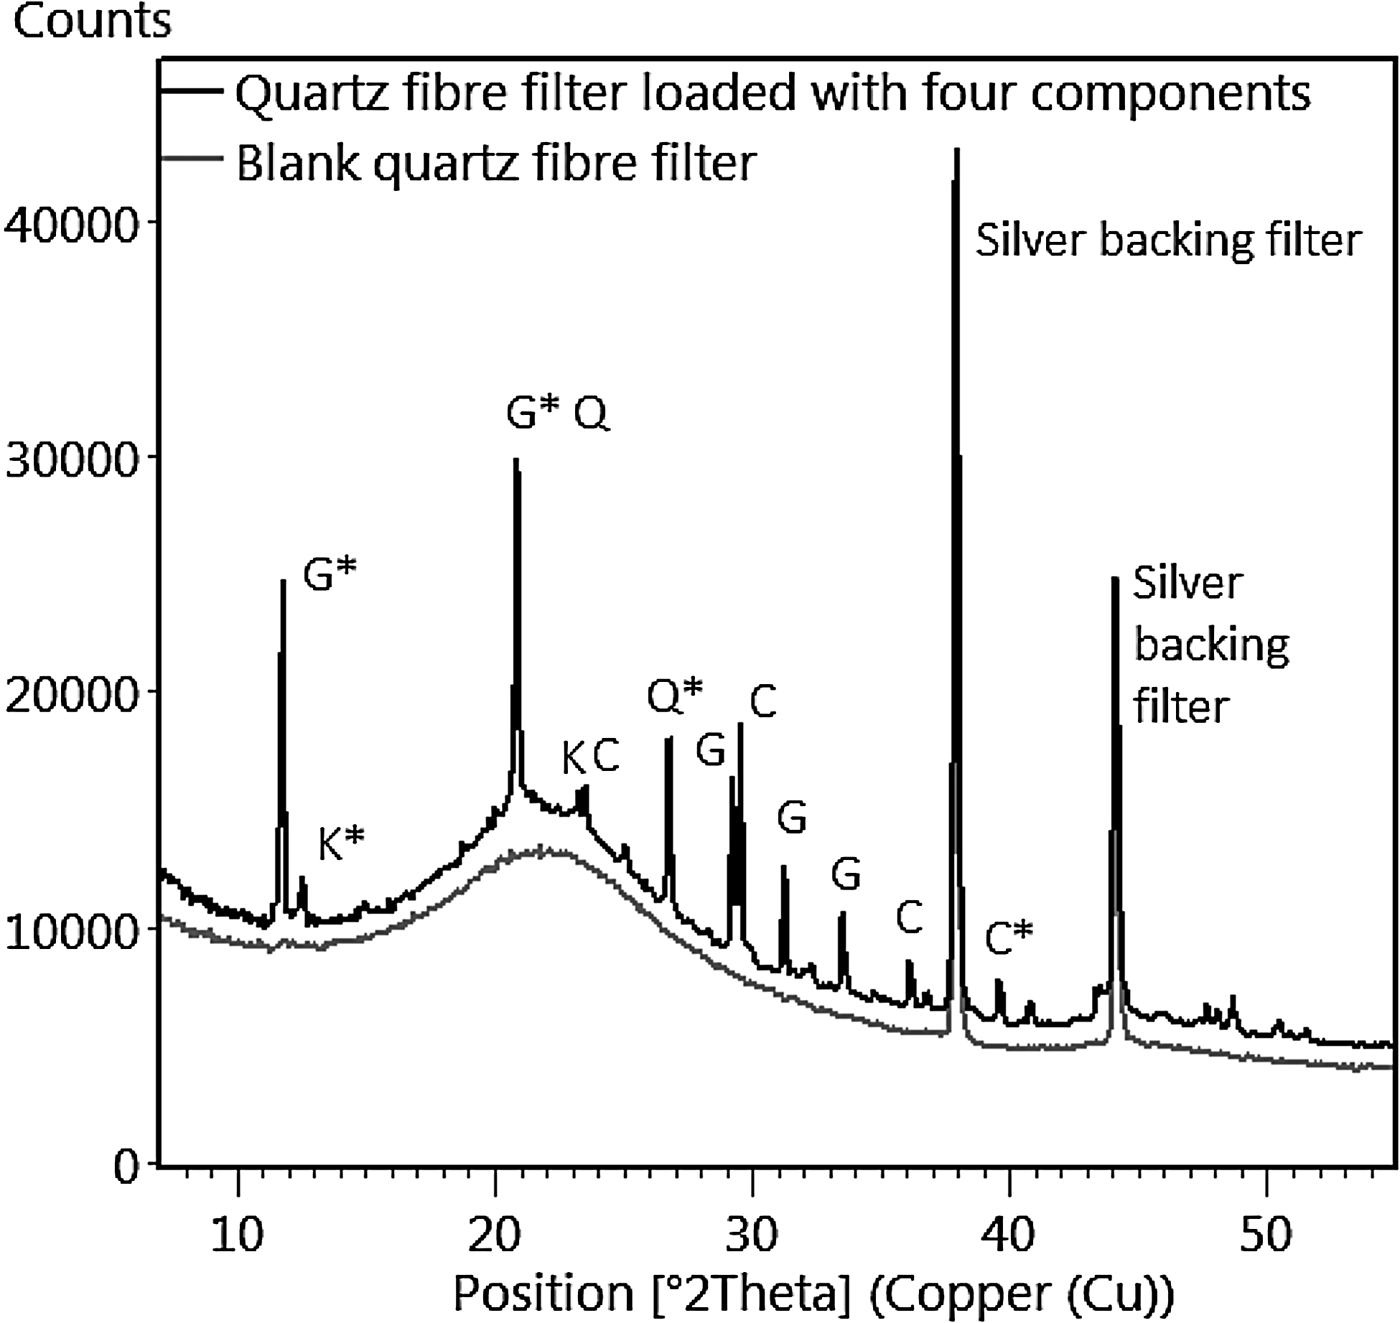
The calibration for gypsum was obtained by measuring the area intensity of the diffraction reflections at 11 and 20.9° 2θ. Calcite was quantified using both the 29 and 39.5° 2θ reflections, kaolinite was measured using 12.4° reflection and the 26.6° 2θ reflection was used for quartz. Figure 1 shows the profile of the quartz fibre filter and the reflections measured for each component. Coincident reflections for calcite and gypsum are at 29.5° 2θ. The secondary quartz peak is positioned under the major gypsum reflection at 20.9° 2θ. The pattern for a blank quartz fibre filter (QMA Blank) is shown under the loaded filter for comparison. The intensity scale for the blank quartz fibre filter was adjusted by 0.8, so that the pattern of the blank is clearly separated from the loaded filter pattern.
An X-ray diffraction scan showing the analyte reflections for gypsum (G), kaolinite (K), quartz (Q), and calcite (C). The reflections used for the external standard measurement are shown with the * symbol. The intensity of blank quartz filter scan was multiplied by 0.8 to clearly separate it from the scan of the loaded filter.

The XRPD mass values were corrected for absorption when the total loading on the 25 mm diameter filter was >1 mg (Mecchia et al., Reference Mecchia, Pretorius, Stacey, Mattenklott and Incocciati2013).
D. Evaluation
Rietveld reports the proportion of material in a sample and not a mass value. The mass values determined using the external standard method were compared with those obtained on the same samples with the Rietveld method by converting them to percentages using the total gravimetric mass of loaded material. Graphs compared the absolute and relative differences between the values obtained from each method and the loaded mass of each component determined gravimetrically. The absolute difference is the difference between the mass proportion of mineral determined by the reference method and the measured value. The relative difference is the absolute difference divided by the known proportion of mineral. The significance of variability of the absolute differences of the Rietveld and external standard methods from the loaded mass was compared using an F test. The amorphous content calculated by Rietveld was compared with the mass proportion added and an estimate of the wood content calculated by subtracting the sum of all the external standard method measurements from the total gravimetric mass of inhalable dust.
1. Limits of detection for the external standard method
Six quartz fibre filters were measured as blank filters. Area intensity measurements were measured manually using Dataviewer™ software (Malvern Panalytical Ltd) to determine a limit of detection (LOD). A straight line was drawn in approximately the middle of the background scatter on a blank filter pattern for 1° 2θ centred on the measurement reflection. This was done for each measurement reflection for each analyte. A standard deviation was calculated from the six area intensity measurements from the Dataviewer™ software. The LOD was calculated for each measurement reflection in terms of mass by multiplying the standard deviation by three and the external standard calibration coefficients.
2. Limits of detection for the Rietveld method
Another approach to estimate a LOD is needed when using the Rietveld method for routine work because calibration coefficients are not available to convert the variability of the background scatter into a mass. A method was therefore needed that could be used on individual filters with the Rietveld method and not require analyte calibrations.
The variability of background scatter of each of the six blank filters was measured using a short computational script written in Matlab, 2011a (Mathworks, Cambridge, UK). The script was applied to plot a line of best fit using a polynomial equation. The calculated standard deviations of the data points from the best fit line were multiplied by three to estimate a 99% level of confidence and then divided by two. They were divided by two because the usual approach for estimating a LOD on filter samples only measures the area above the baseline drawn on the background, whereas, the computational modelling approach includes differences that are also below the fitted line. RIRs were used to estimate the mass attributable to the variability of the background scatter. This could then be converted to the proportion of the component when divided by the gravimetric mass of inhalable dust. RIR values are conveniently contained in powder diffraction reference patterns containing the crystalline structure data used for Rietveld analysis. An RIR is a ratio of the 100% XRPD reflection of the material with that of the 100% reflection of the certified reference material SRM 674a alumina (Hubbard and Snyder, Reference Hubbard and Snyder2013). Hence, it is possible to estimate the mass at a LOD for any substance by correcting a previously measured calibration coefficient (count rate per unit mass) of a single component with ratios of RIR values for each component found in a sample. A simple ratio can be applied because matrix absorption is negligible when the sample is a thin layer (Mecchia et al., Reference Mecchia, Pretorius, Stacey, Mattenklott and Incocciati2013). When applying this approach, it is not necessary that the calibrated component or test component is in the measured sample, simply that the samples are measured using the same instrumental conditions.
Quartz was used as the reference component. A simple ratio of RIR values was multiplied with the slope calibration coefficient for quartz.
 $$\displaystyle{{{\rm RI}{\rm R}_{{\rm Ref}}} \over {{\rm RI}{\rm R}_C}},$$
where RIRRef was the ratio for the reference quartz component, and RIRC is the ratio for the analyte. Results from the RIR estimate approach were compared to the LODs calculated from the external standard method (HSE, 2014).
III. RESULTS
Calibrations were obtained for calcite, gypsum, kaolinite, and quartz on quartz fibre filters (Supplementary Information). Table II lists the trend line slope and determination coefficients. For convenience, the y axis was mass (mg) and the x axis was the intensity in counts per second (cps). The trend line includes the intercept when it is significantly different from zero at the 95% level of confidence.
Slope and determination coefficients for each external standard calibration.

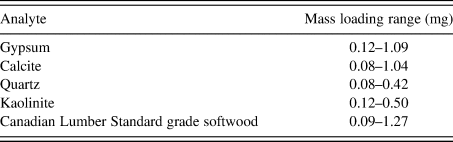
The total loadings obtained from the preparation of test samples were between 0.3 and 2.2 mg. The loading ranges for the individual components are shown in Table III.
Sample loading ranges obtained for the minerals and wood dust collected by the inhalable sampler.

There were 41 quantifications conducted by Rietveld and 115 using the external standard method. Thirty-five Rietveld quantifications were used to compare the external standard and Rietveld values with gravimetrically determined mass loadings of an analyte. The remainder were used to compare the Rietveld with the external standard method values when a measured component was used as an internal standard for the Rietveld analysis.
A. Comparison with gravimetric mass
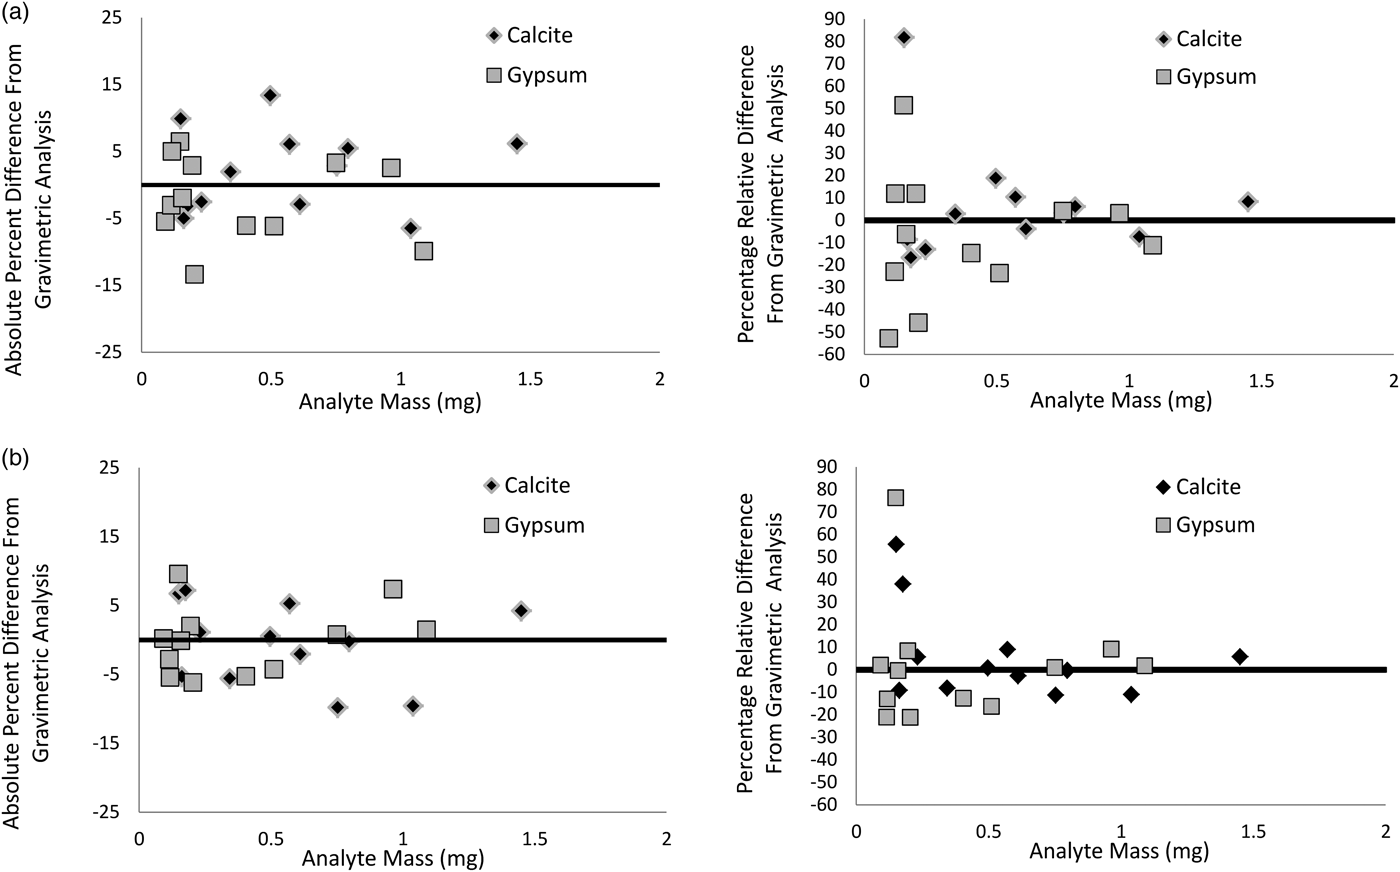
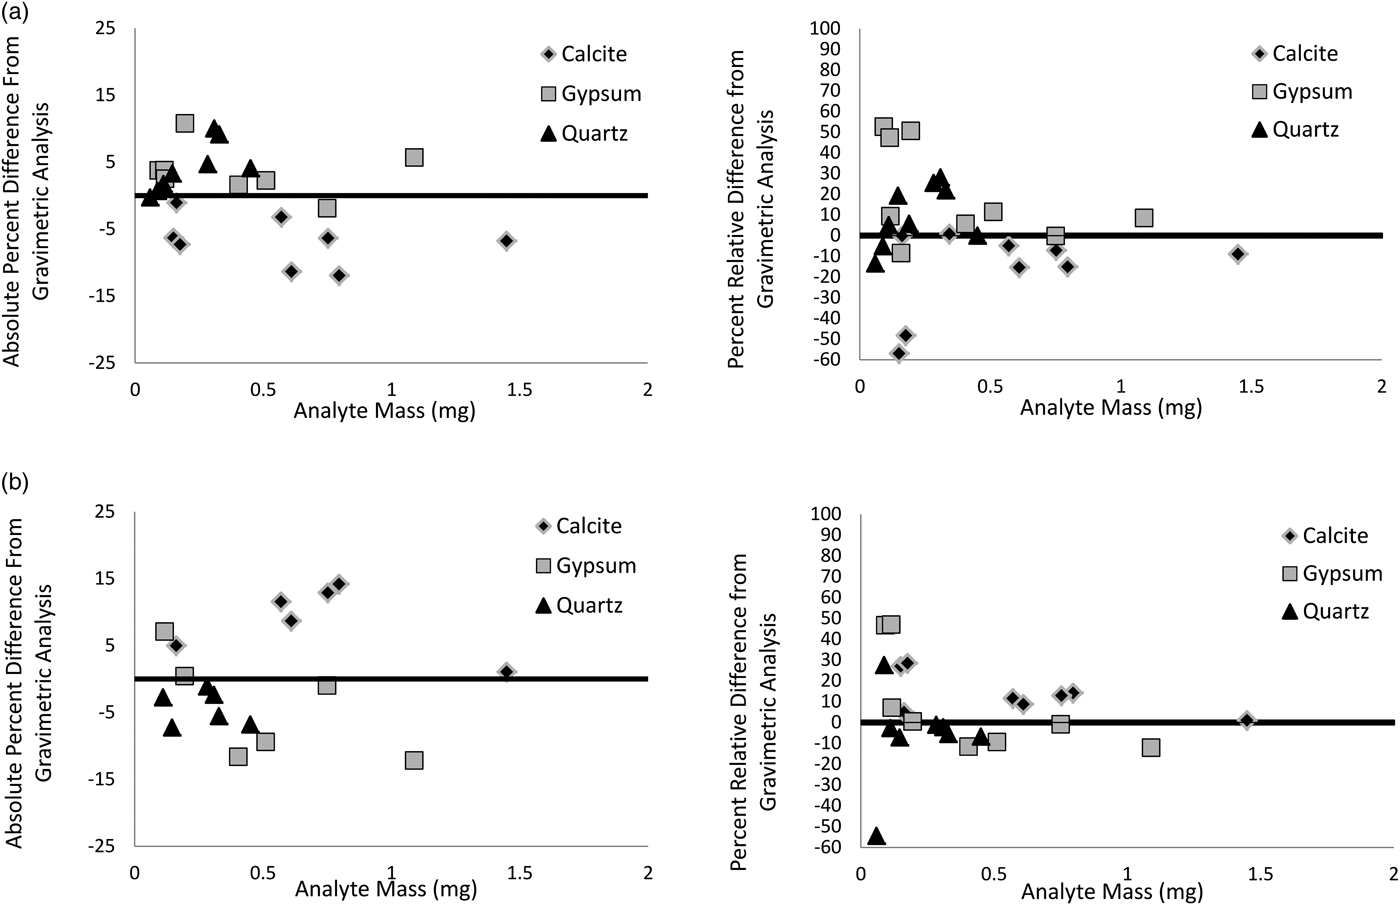
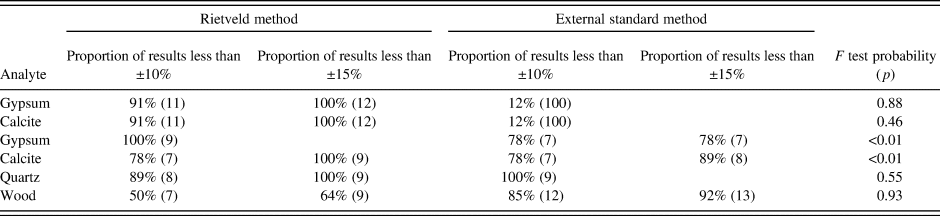
Figure 2 compares the absolute and relative per cent differences of the external standard method and Rietveld values with the weighed proportion of loaded analyte for a two-component mixture (calcite and gypsum). Figure 3 compares these XRD methods when measuring samples containing three components (quartz, calcite, and gypsum). The F test probability (p) showed that the variability of the absolute differences was not significantly different for a two-component system (calcite, p = 0.87, gypsum, p = 0.46). The F test probability for the two analyses (calcite and gypsum) in the three-component samples was significantly different (p < 0.01 for calcite and gypsum and p = 0.55 for quartz). Overall, the standard deviation of absolute errors for the external standard method was 11% compared with 7% for the Rietveld method (F test, p < 0.01). This difference is influenced by results from two samples using the external standard method measuring calcite and gypsum in a three-component system. The standard deviation for the external standard method is also 7% when results from these two samples are excluded. The x axis in Figures 2 and 3 was the measured mass (mg) of each component in the mixture. Table IV lists the proportion of Rietveld and external standard method results within 10, or 15% difference from the mass proportion of crystalline and amorphous components. Goodness of fit values for the Rietveld fitted profiles were between 10 and 40.
Comparison of absolute and relative differences from the gravimetrically determined mass of analyte for the Rietveld and external standard methods in a two-component mixture of calcite and gypsum. (a) Rietveld analysis against mass of analyte. (b) External standard method against mass of analyte.

Comparison of absolute and relative differences from the gravimetrically determined mass of analyte for the Rietveld and external standard methods in a three-component mixture of quartz, calcite, and gypsum. (a) Rietveld method against mass of analyte. (b) External standard method against mass of analyte.

Number of tests, proportion of absolute differences within 10, or 15% of the gravimetrically measured values mineral and amorphous components and F test probabilities.

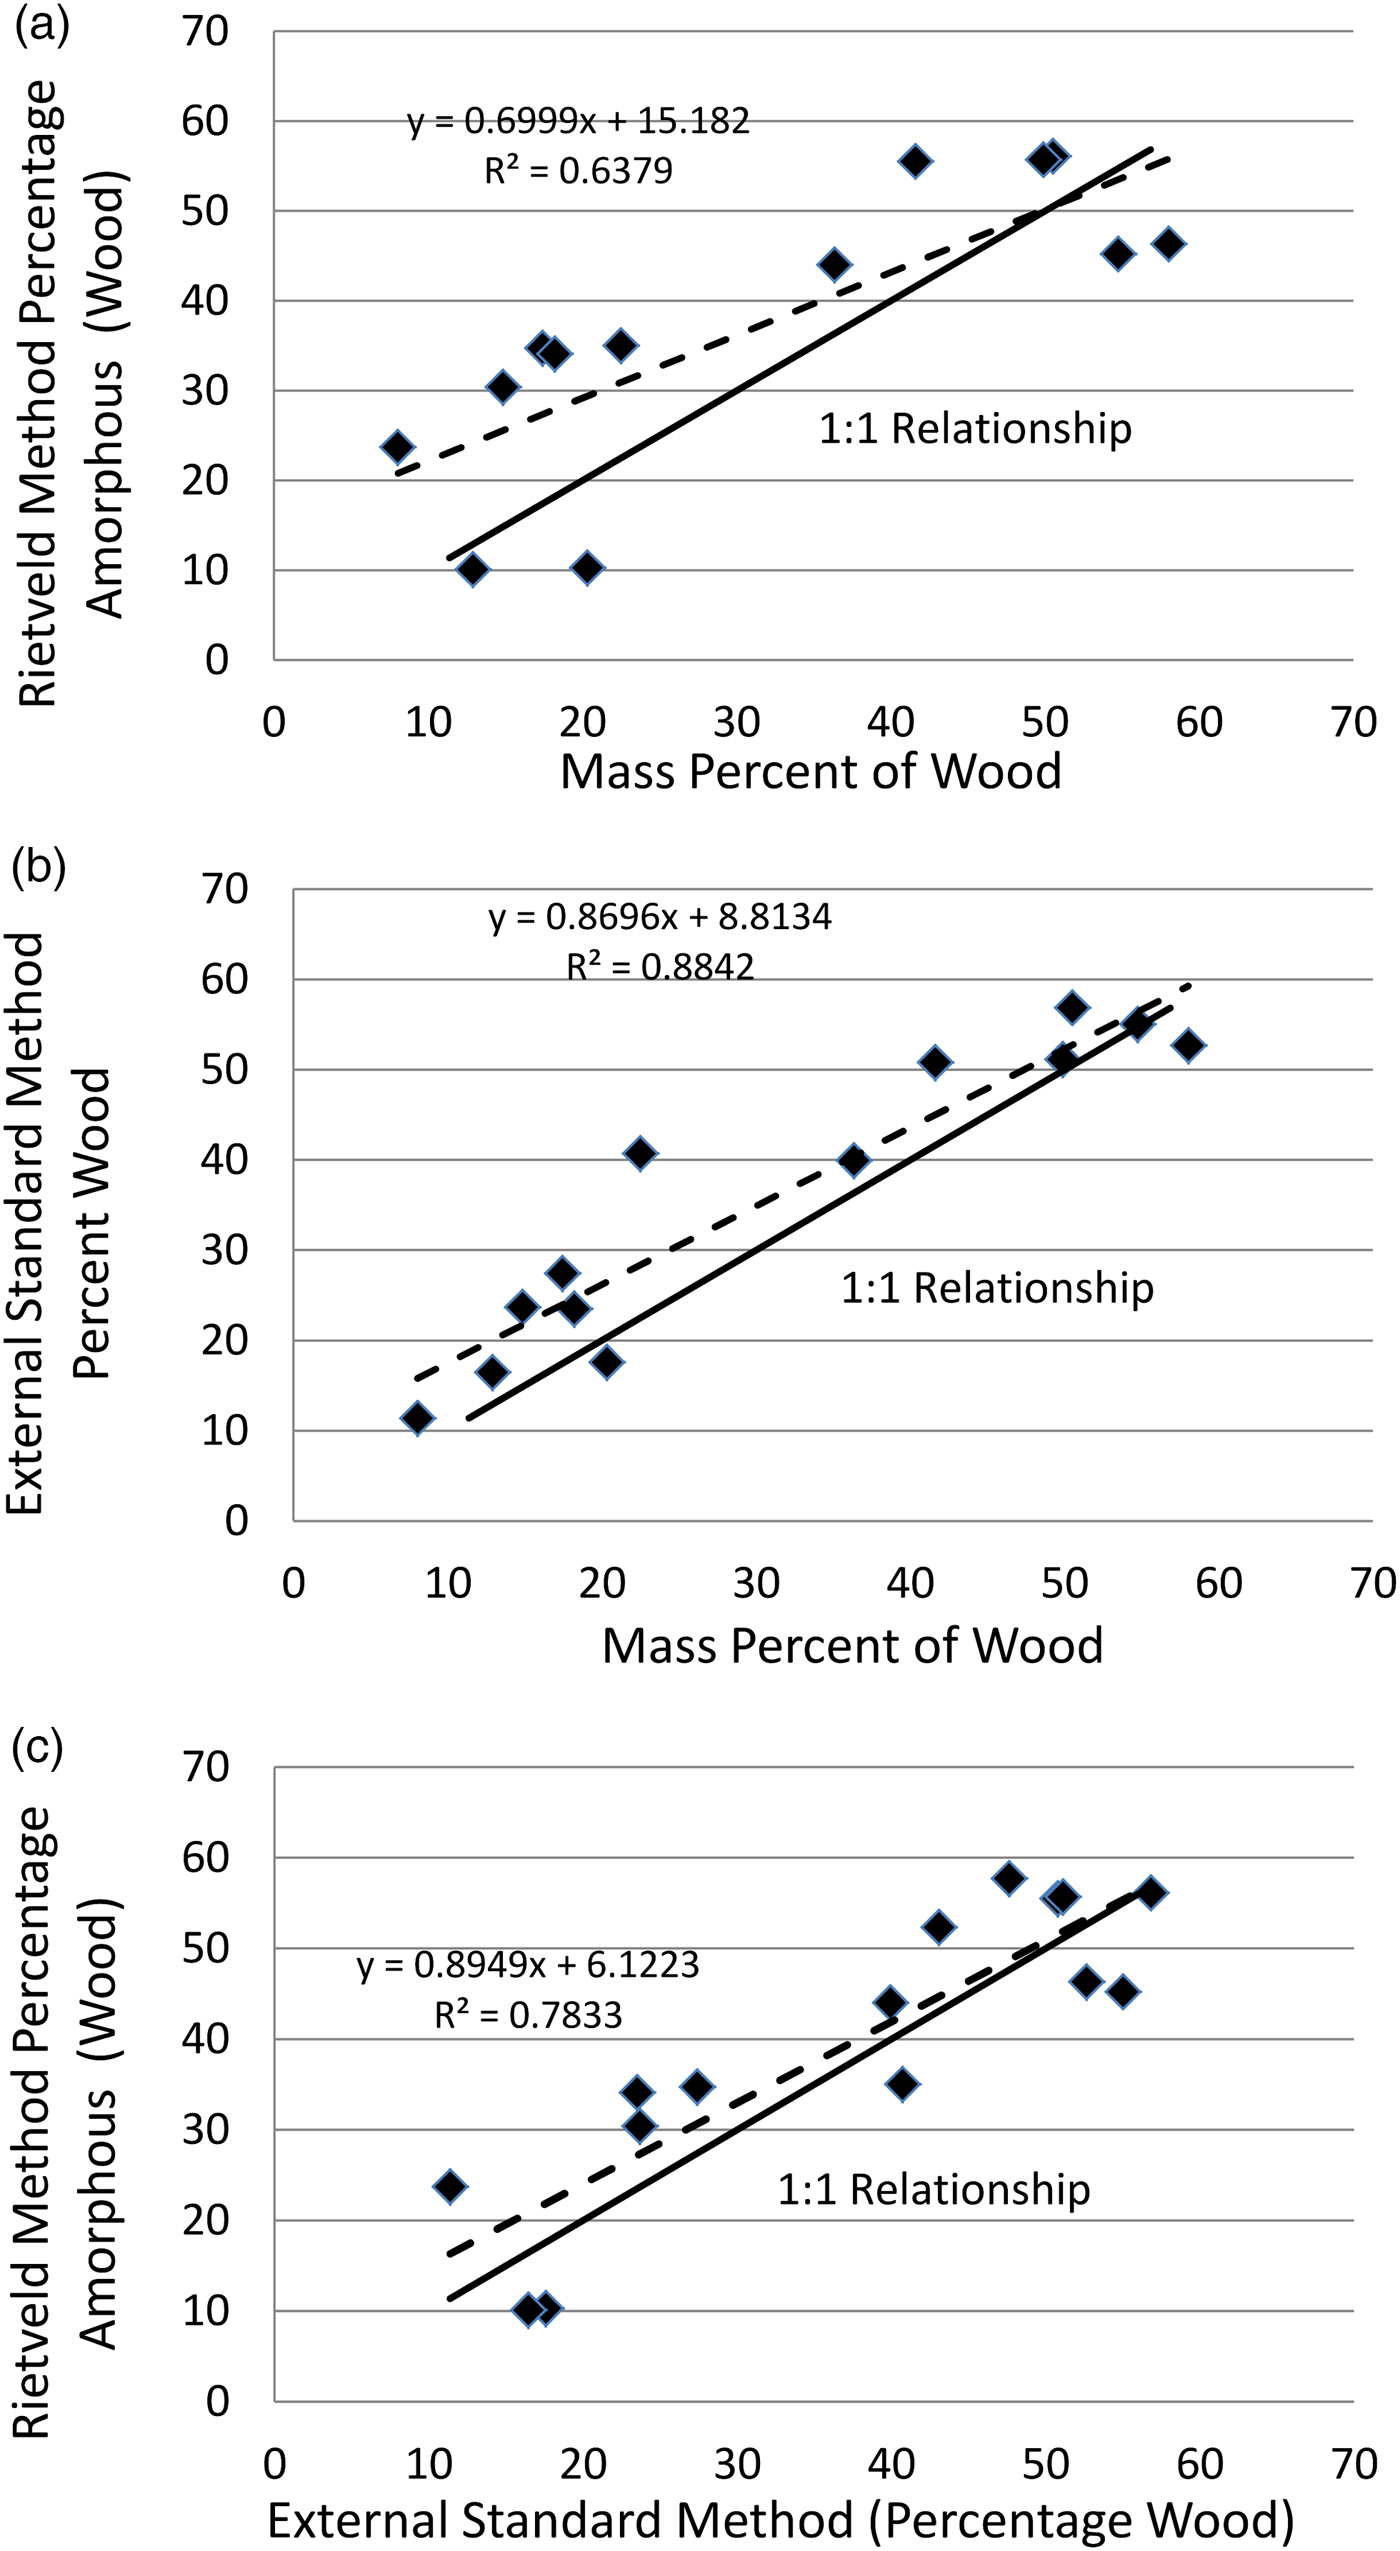
Figure 4 compares the percentages obtained by, (a) the mass proportion of wood and the Rietveld measured amorphous proportion, (b) the mass proportion of wood and the wood content determined using the external standard method, (c) the Rietveld amorphous proportion and the external standard method wood content. Wood is the fourth component in a mixture of gypsum, calcite, and quartz. The standard deviation of absolute differences for the Rietveld method was 11% compared with 6% when the external standard method is compared with the mass proportion of wood. The standard deviation is 7% when the Rietveld amorphous value is directly compared with the external standard method. The F test probability (p) comparing the variability of absolute differences between the Rietveld and external standard methods was 0.93.
A comparison of the Rietveld and external standard method values when measuring wood in a matrix of calcite, gypsum, quartz, and wood on a quartz fibre aerosol filter. (a) Rietveld method against mass of wood. (b) External standard method against mass of wood. (c) Rietveld and external standard methods.

B. Comparison with the external standard method
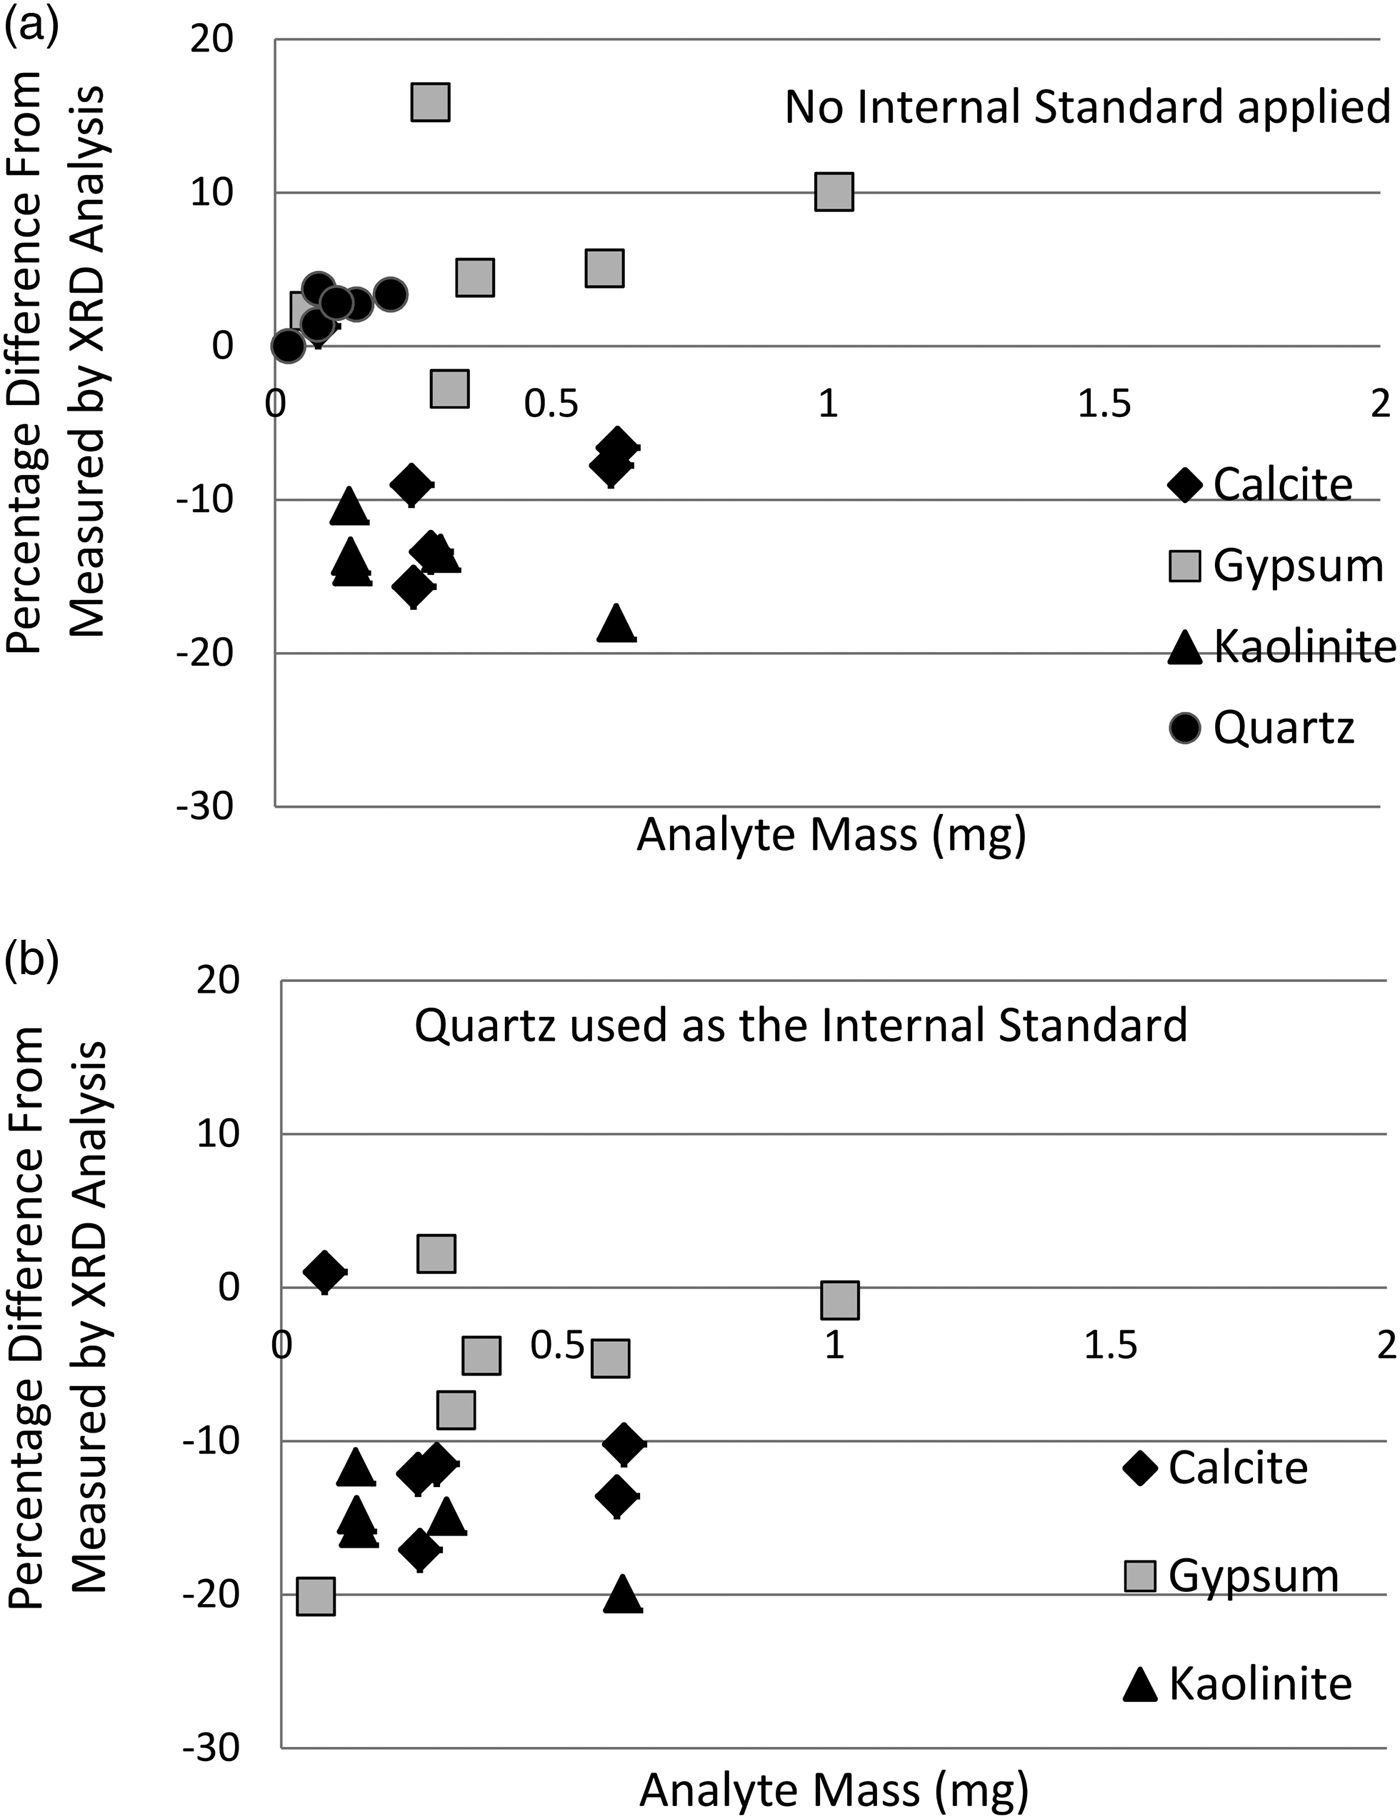
Overall, the 95% level of confidence for the absolute differences comparing the Rietveld with the external standard method values is 15%. The majority of these absolute difference values (82%) were <10%. Half of the values >10% were attributable to one set of six samples involving the quantification of minor kaolinite and calcite in a mixture of four minerals (gypsum, calcite, quartz, and kaolinite). Figure 5 shows the absolute per cent differences between the Rietveld-determined proportion for each analyte and the measured external standard method values for these six samples involving four components. Figure 5 also shows the effect of applying the measured value of one of the components (quartz) as an internal standard. The variability of absolute differences before and after applying the internal standard was not significantly different. F test gave probabilities of p = 0.69 (gypsum), p = 0.93 (calcite), and p = 0.88 (kaolinite). Four of the six values for the major component (gypsum) were closer to the external standard method value. The values for the minor components of calcite and kaolinite were −1 to −2% further from the external standard method value. The mass loadings for these two components were all around or <0.5 mg. In this case, the sum of the measured values for all components using the external standard method was from 108 to 130% more than the loaded mass of dust for five of the six samples. Figure 5S (Supplementary Information) shows the absolute and relative differences between the external and Rietveld proportions of calcite and gypsum in the four-component mixture of quartz, gypsum, calcite, and wood dust when the measured mass of quartz was used as an internal standard. All absolute differences between the two methods were within 10%. Gypsum was the main component in eight samples. Sixty four per cent (n = 9) of relative difference values for both gypsum and calcite were within 15%. Only one relative difference >15% had an analyte mass loading of more than 0.5 mg.
Absolute differences between the external standard and Rietveld methods when measuring minerals in a four-component mixture of calcite, gypsum, kaolinite, and quartz. Chart (b) shows the same results when the internal standard (quartz) is applied to the Rietveld method.

C. Limits of detection
LODs calculated using the external standard method and the method based on RIRs are compared in Table V.
Calculated limits of detection for six analyte reflections.

IV. DISCUSSION
Most Rietveld values were within an absolute difference of ± 10% of the gravimetrically determined mass of analyte at the low mass levels measured in this study. When the mass loading is close to 1 mg, an absolute difference of 10% equates to the mass of 0.1 mg, whilst 10% at a loading of 0.5 mg would equate to a relative difference of 20%. Most absolute and relative values >10% were at mass loadings around or below 0.5 mg (Figures 2 and 3). Consistently, larger negative absolute differences were found for calcite and kaolinite when comparing the external standard method values in a mixture of four minerals (Figure 5), however, the sum of external standard measured components was found to overquantify the total mass. This indicates that the external standard method had probably reported values for some analyses that were higher than was present. Differences in background profile and coincident reflections can affect the positioning of the baseline used to calculate a net peak area for quantification with an external standard method, especially when the mass of analyte is relatively low.
Almost all the patterns needed a slight correction (0.1–0.2° 2θ) for the displacement of the angles of reflection before Rietveld processing. The displacement was attributed to the imperfect focusing geometry of the instrument when analysing a sample on a filter. Correction for displacement helped with the selection of the reference patterns for the Rietveld analysis (particularly for gypsum) and greatly reduced analysis time. Changing parameters to fit the Rietveld model to the XRPD pattern can be time consuming. There is potential to overfit the background or the reflections, which would lead to spurious values. However, once a methodical process is established, very little adjustment is needed to ensure good results. Like any other method, Rietveld has difficultly when modelling or measuring near LODs (Figures 2 and 3). Many of the individual analyte loadings were low (<0.5 mg). For example, the largest negative differences in Figure 4 (>20%) were for calcite mass of 0.078 mg (LOD = 0.069 mg) and gypsum with a mass of 0.08 mg (LOD = 0.036). Better visual fits at low mass loadings were frequently obtained by using fewer parameters. There are a number of measures produced by Rietveld processing software to help assess the quality of the fitted profile. Goodness of fit values were discussed by Martin et al. (Reference Martin, Beauparlant, Lesage and Van Tra2012) when measuring quartz in bulk samples. Low values for goodness of fit represent good quality data. Values for goodness of fit for measurements on filters ranged from about 9 to 40 which are not as good as those obtained for bulk analysis. These and other statistical indicators of fit were not fully appropriate when measuring material on filters with a high background and reflections from the silver backing filter underneath the sample. This was potentially because of the imperfect fitting of the background and artefacts from the silver backing filter. Also, the dominance of the silver would potentially present a false impression of the goodness of fit. The silver is the most significant component of the matrix but not the sample. The silver was also modelled as part of the matrix and reflections from the silver oxides or chlorides were not always included in the Rietveld processing.
Nevertheless, this article shows that good results can be obtained on challenging samples with the toleration of poorer fit factors. The use of the whole diffraction pattern to provide a quantitative estimate gives Rietveld an advantage over other analytical approaches. Internal or external standard measurement usually selects specific XRPD reflections for the quantitative measurement. The most intense reflections are often selected because they permit the most sensitive measurements, however, the analyst may have to select a less sensitive analyte reflection if interference is present. The loss in sensitivity will increase the LOD and imprecision when measuring low masses. A classic example is interference of the most intense reflection of calcite with a significant peak for gypsum (Figure 1). In this article, the calcite reflection at 39.5° 2θ was used for most measurements using the XRPD external standard calibration. In addition, the secondary reflection for quartz is at the same position at the 20.9° 2θ reflection for gypsum, which may compromise the measurement of gypsum for this reflection. The Rietveld process is able to profile fit each peak in the pattern. The profile fitting is refined by adjusting the parameters (e.g., scale factor, changes in the crystal lattice, and width of the reflection). However, the refining process can have problems. Initial Rietveld tests obtained some results for gypsum more than 20% higher than the mass proportion. These were attributed to Rietveld modelling the gypsum reflection at 29.5° 2θ as the coincident calcite reflection and vice versa (Figure 1). This was resolved by checking for an initial position displacement of the raw scan and more careful selection of the gypsum reference pattern from the database.
The Rietveld method appears to report more amorphous material when the proportion of wood in a sample is low (<30%) compared with the mass proportion of added wood dust and is more variable than the external standard method values (11% compared with 6%). However, the Rietveld amorphous values were not significantly different from those estimating the mass of wood by subtracting the sum of the external standard method measurements from the gravimetric mass of inhalable dust. The process of repeated weighing and sampling to determine the mass proportions of minerals and wood dust may have introduced an error. For example, mineral dust or quartz filter fibres could be lost during transfer into and out of the inhalable sampler filter cassette, which would mask an increase in the proportion of wood. In addition, the Rietveld measures all amorphous components and not just any added wood dust. Background scatter and other unquantified trace components (e.g., any demihydrate) from the XRPD may also contribute to the Rietveld amorphous value.
The reliance on the external standard method measurement of a single component in a sample as an internal standard to provide an amorphous value is not a completely satisfactory solution. The single component might not always be present in all aerosols generated in workplaces. It would be better to measure a component of known mass within the filter matrix to enable the correction of absorption and act as an internal standard for Rietveld. Potentially, a mass could be attributed to the silver peaks from the silver filter which is placed behind the quartz fibre filter during XRPD measurement. This would then be able to also act as an internal standard for Rietveld since its proportion would be known from the gravimetric mass of the sample and the mass attributable to the silver. This may prove useful in future analyses but was not investigated further in this work.
LODs for some analyte reflections prepared using a traditional approach measuring blank filters were quite high (>0.02 mg). An unknown peak was observed on some blank filter samples at 12° 2θ. This peak was attributed to the silver filter but could not be assigned to a silver chloride or oxide reflection. Reflections from silver chloride and oxide are more evident on blank filters or those with low loadings. These spurious reflections may limit the lifetime of the silver backing filter when they are continually used.
The 39.5° 2θ reflection for calcite obtained a lower LOD when using the modelled background and RIR approach. This is because the 39.5° 2θ reflection is close to the 38° 2θ reflection for silver which slopes the background. The Matlab computation model can follow the background more closely than a straight line drawn between two points.
It is possible the background would be more easily fitted with other filter types which would make the pattern easier to the model. For example, quartz fibre filters had a much higher background than glass fibre (GFA) filters (Santos et al., Reference Santos, Matos, Carvalho, Sant'agostino and Korn2013). In this work, quartz fibre filters were needed as a thermal gravimetric approach was used for a wood-specific measurement of dust construction carpentry samples on the workplace samples.
Quarter and a half working shift sampling in an atmosphere of 2 mg m−3 using a sampler at 4 L min−1 would collect between 1 and 2 mg of inhalable dust on a filter. The loading ranges measured on test samples in this study are mostly lower than 1 mg but remain relevant since the focus is in measuring the proportion contaminating the sample: which is less than the total weight of inhalable dust. Inhalable dust mass loadings below 1 mg are not normally significantly affected by sample absorption (Mecchia et al., Reference Mecchia, Pretorius, Stacey, Mattenklott and Incocciati2013). The performance of the Rietveld method may improve at higher loadings (e.g., for full shift sampling) where the sample would be more representative of the bulk samples evaluated in other Rietveld work (Martin et al., Reference Martin, Beauparlant, Lesage and Van Tra2012) and background effects from the filter would be minimal.
V. CONCLUSION
The measurement of individual components within a mixed dust sample and the determination of the amorphous contribution (wood dust) by XRPD external standard method and Rietveld were achieved despite the challenging measurement conditions. The Rietveld and external standard methods do produce comparable values. The absolute precision of the analysis on surrogate test samples on mass loadings below 1 mg is acceptable (mostly within 15%) although not as good when using Rietveld to analyse samples of bulk material. Larger relative differences are more likely when analyte loadings are below 0.5 mg. There is potential for improvement, e.g. the incorporation of an internal standard as part of the matrix rather than a measured component.
The use of RIR values to calculate LODs obtained similar values when compared with the traditional approach using the repeated measurement of blank filters and calibration coefficients for each individual component. This RIR approach will enable the reporting of an estimated LOD for any crystalline substance. The RIR values are conveniently located in the same data file as the structural parameters used by Rietveld and together with calculation of the variability of the background scatter may provide an alternative automated approach for the determination of LODs on individual samples.
This analytical approach has the potential to provide a methodology for a more complete characterisation of the inorganic and amorphous components that can contribute to occupational disease.
SUPPLEMENTARY MATERIAL
To view supplementary material for this article, please visit https://doi.org/10.1017/S0885715619000423.
Acknowledgements
The authors thank Timothy Yates (HSE) who wrote most of and tested the matlab script and Dr. Anthony Bell (Sheffield Hallam University), Susan Hambling (HSE) and Laurie Davies (HSE) who conducted the internal technical and editorial reviews. This publication and the work it describes were funded by the Health and Safety Executive (HSE).