1. INTRODUCTION
Modern Global Navigation Satellite Systems (GNSS) signals have introduced new features such as subcarriers, a pilot channel and secondary codes. The secondary code brings several advantages: it facilitates synchronisation with the data, it offers a better cross-correlation between satellites or constellations and it helps mitigate interference thanks to closer spectral lines. However, a secondary code complicates the acquisition for two reasons: there is a potential sign transition between every period of the primary code and the extension of the coherent integration time is more difficult (Borio et al., Reference Borio, Fantino and Lo Presti2008; Lo Presti et al., Reference Lo Presti, Zhu, Fantino and Mulassano2009; Leclère et al., Reference Leclère, Botteron and Farine2014; Foucras et al., Reference Foucras, Julien, Macabiau, Ekambi and Bacard2016; Leclère et al., Reference Leclère, Botteron and Farine2017). This article focuses on the second problem.
Three traditional methods are available for dealing with the extension of the coherent integration time in the presence of a secondary code: (1) Computing the correlation with the secondary code to synchronise with it. This enables long coherent integration times and high sensitivity, but involves a significant computational burden (Leclère et al., 2017; Hegarty et al., Reference Hegarty, Tran and Van Dierendonck2003; Yang et al., Reference Yang, Hegarty and Tran2004; Leclère and Landry, Reference Leclère and Landry2016; Leclère et al., Reference Leclère, Andrianarison and Landry2017b); (2) Testing all the possibilities for the sign transitions between consecutive primary code correlations. Since the number of possibilities grows exponentially, this solution is limited to short coherent integration times, typically of four or five primary code periods. The use of the term short here is relative, it depends on the signal considered, for example, the GPS L1C signal has a primary code of 10 ms, therefore coherent integration times of 40 or 50 ms can be reached with this method, which is definitely not a short coherent integration time (Corazza et al., Reference Corazza, Palestini, Pedone and Villanti2007; Shivaramaiah et al., Reference Shivaramaiah, Dempster and Rizos2008; Borio, Reference Borio2011). Moreover, non-coherent integration cannot be performed in this second case, because the number of possibilities has a double exponential growth; (3) Computing a partial correlation with the secondary code, by using less than one secondary code period as input, leading to an intermediate integration time (again, the term intermediate is relative to the context), and non-coherent integration can be performed (Borio, Reference Borio2011). However, even if less input is used, it is still needed to test all the possible delays as with the full correlation, making this method less efficient than the full correlation in terms of complexity.
Recently, the authors proposed a method enabling moderate to high sensitivity, while maintaining reasonable complexity (Leclère and Landry, Reference Leclère and Landry2018). The method consists of combining secondary code correlation results to reduce the complexity by testing fewer delays, combining inputs (which reduces the number of primary code correlations), and by using the fact that the modified local secondary code is shorter and may contain zeros. Moreover, non-coherent integrations can be used with this method. In return, there is a loss in the Signal-to-Noise Ratio (SNR) compared to the full correlation, which means in another way that more input data should be used than the integration time. The goal is that the complexity reduction is more important than the coherent integration time reduction.
For example, with the L5 signal, an equivalent coherent integration time of 12 ms can be obtained using 20 ms of input data, while the complexity is reduced by a factor greater than four (Leclère and Landry, Reference Leclère and Landry2018). It was also shown that doing this twice and adding the results together leads to a higher SNR (since the coherent integration time becomes 24 ms) and a lower complexity than the traditional implementation, therefore it is possible to win on both sensitivity and complexity. The drawback is the use of longer input data, requiring a larger input memory. This additional memory requirement is compensated by the reduction of the number of accumulators in the secondary code removal process; thus, the overall memory requirement may be lower with the proposed method, as shown later.
The number of results combined is flexible. If more results are combined, the complexity is reduced but the sensitivity is generally reduced as well. However, the actual performance is specific to every code. For example, the L5 signal combining five results gives a better sensitivity than combining four results (Leclère and Landry, Reference Leclère and Landry2018).
In this article, this method is applied to the Galileo E5 signal, which has the particularity of having long secondary codes and each satellite has its own secondary code for the pilot channel. Two cases will be discussed: (1) When the input is a full period of the secondary code, or a multiple of it, as in Leclère and Landry (Reference Leclère and Landry2018). However, here the method will also be compared to the partial correlation method, which was not done in Leclère and Landry (Reference Leclère and Landry2018); (2) When the input is less than a full period of the secondary code, to reduce the amount of input data needed.
Note that this paper deals only with the complexity and gain brought after the primary code correlation. The consequences of extending the coherent integration time can already be found in the literature, such as in Borio (Reference Borio2011) for the detection probabilities or in Gaggero (Reference Gaggero2008) for the oscillators' requirements and are thus not discussed in this paper.
The rest of this paper is organised as follows. Section 2 introduces the acquisition process, the architecture considered, and shows the importance of extending the coherent integration time and using non-coherent integration. Section 3 presents the three traditional methods for doing this. Section 4 briefly describes the proposed method and shows the results when a full period of the secondary code is used as the input. Section 5 discusses the impact of using less than a full period of the secondary code as input. Finally, Section 6 provides conclusions on the application of the method to the Galileo E5 signal.
2. ACQUISITION OF GNSS SIGNALS WITH A SECONDARY CODE
2.1. Description of GNSS signals
A GNSS signal contains three essential elements: navigation data, such as ephemeris, time information and various corrections, which are needed by the receiver to compute its position; a Pseudorandom Noise (PRN) code, also called ranging code, which is used for measuring the distance between the receiver and the satellites (pseudoranges) and allows the satellites to share the spectrum and a carrier, as for any radio signal.
Modern GNSS signals may include new features such as: a pilot channel without any data; allowing the use of long coherent integration times and the use of discriminators offering better sensitivity for tracking loops; a subcarrier, which changes the modulation (from Binary Phase Shift Keying (BPSK) to Binary Offset Carrier (BOC) typically) to improve the position accuracy and better mitigate multipath and a secondary code, which allows an easier synchronisation with the data, better cross-correlation between satellites or constellations, and better interference mitigation (Kaplan and Hegarty, Reference Kaplan and Hegarty2017; Betz, Reference Betz2015) With the arrival of the secondary code, the PRN code is now sometimes called the primary code.
A GNSS signal transmitted by a satellite can thus be expressed as:
 $$s_{\rm t}\lpar t\rpar =a_{\rm t\comma d} c_{\rm d}\lpar t\rpar d\lpar t\rpar \cos \lpar 2\pi f_{\rm L}t+\varphi_{\rm t\comma d}\rpar +a_{\rm t\comma p}c_{\rm p}\lpar t\rpar \sin \lpar 2\pi f_{\rm L}t+\varphi_{\rm t\comma p}\rpar \comma \; $$
where the subscripts d and p denote the data and pilot channels respectively, a is the amplitude of the signal, c contains the primary code and possibly the secondary code and the subcarrier, d is the navigation data, f L is the carrier frequency and φ is the carrier phase. Note that the data and pilot channels are not always in quadrature, hence the use of different φ for the data and pilot channels (Foucras, Reference Foucras2015).
A received GNSS signal differs from a transmitted one in four main points: due to the distance travelled by the signal, the received power is much lower; again due to the distance travelled, the received code has an unknown delay; due to the speed of the satellites and of the receiver, the frequency of the carrier and of the code are shifted and there is a noise superimposed (Van Diggelen, 2018). A received GNSS signal can thus be expressed as:
 $$\eqalign{s_{\rm r}\lpar t\rpar & = \displaystyle{{1}\over{L}}s_{\rm t}\lpar \lpar 1+\alpha\rpar t-\tau\rpar +\eta \lpar t\rpar \cr & = a_{\rm r\comma d}c_{\rm d}\lpar \lpar 1+\alpha\rpar t-\tau\rpar d\lpar \lpar 1+\alpha\rpar t-\tau\rpar \cos \lpar 2\pi \lpar f_{\rm L}+f_{\rm D}\rpar t +\varphi_{\rm r\comma d}\rpar \cr & \quad +a_{\rm t\comma p}c_{\rm p}\lpar \lpar 1+\alpha\rpar t-\tau\rpar \sin \lpar 2\pi \lpar f_{\rm L}+f_{\rm D}\rpar t +\varphi_{\rm r\comma p}\rpar \comma \; } $$
where L corresponds to the travel loss, η is the noise, α represents the Doppler effect, τ is an unknown delay, and f D is the Doppler shift on the carrier (equal to α f L). For a static receiver on Earth, the maximum Doppler shift f D is around 5 kHz and 3.8 kHz for GPS L1 and L5 band signals respectively, and around 4 kHz and 3 kHz for Galileo L1 and L5 band signals respectively (Van Diggelen, 2018; Leclère et al., Reference Leclère, Landry and Botteron2018).
2.2. Acquisition principle
The receiver is designed to decode the navigation data and synchronise with the code. For this, it needs to estimate the Doppler shift f D to remove the carrier, and to estimate the delay τ to synchronise with the code. This is the aim of the acquisition.
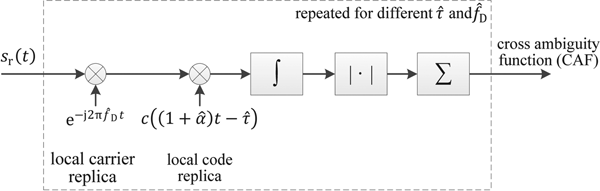
The basic implementation of the acquisition is relatively straightforward, since the acquisition tests the different possibilities for the Doppler shift and the code delay until it detects the signal. The testing is performed by multiplying the incoming signal with local replicas of the carrier and code at a specific frequency and delay, integrating the result and taking the magnitude since the local carrier is complex, as shown in Figure 1. Therefore, after the carrier removal, this corresponds to a correlation.
Acquisition principle
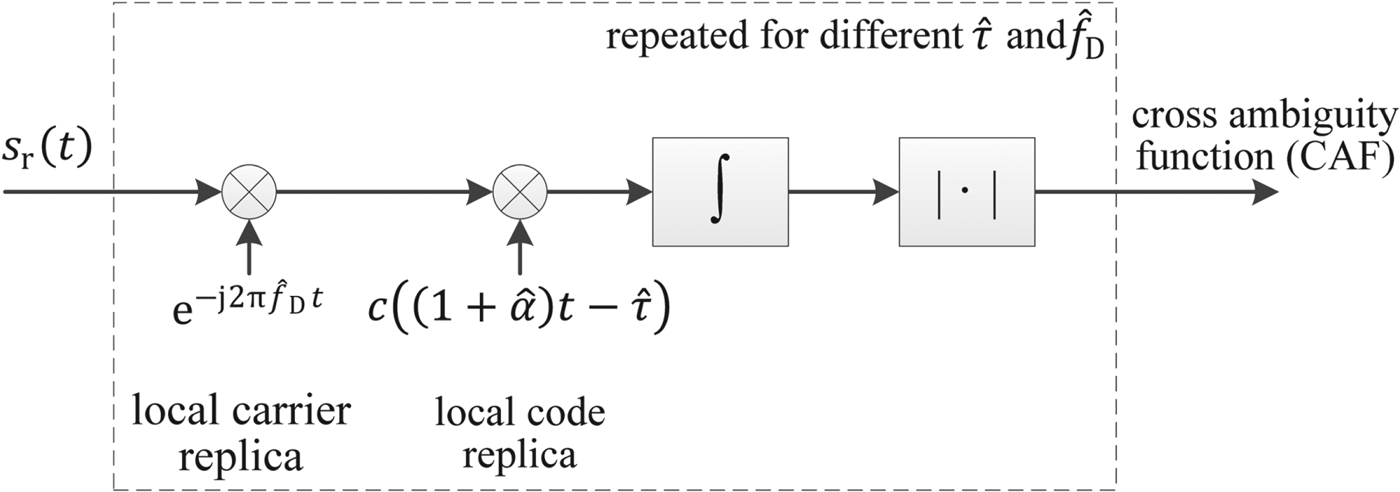
Basically, if the frequency of the local carrier matches the frequency of the incoming carrier and if the delay of the local code matches the delay of the incoming code, that is, if  $\hat{f}_{\rm D}\approx f_{\rm D}$ and
 $\hat{\tau }\approx \tau $, a high value should be obtained at the output. If one of these two local parameters does not match the incoming one, that is,
 $\hat{f}_{\rm D}\ne\ f_{\rm D}$ or
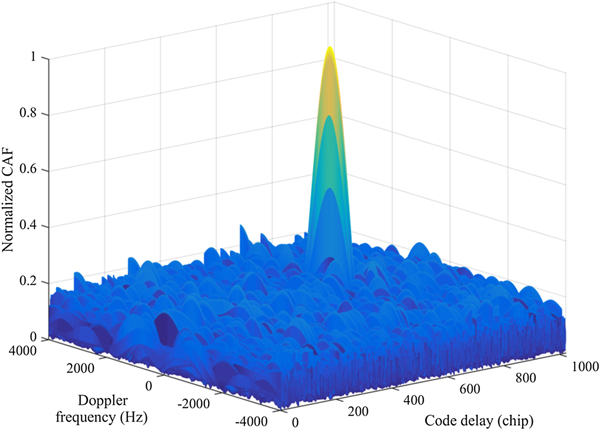
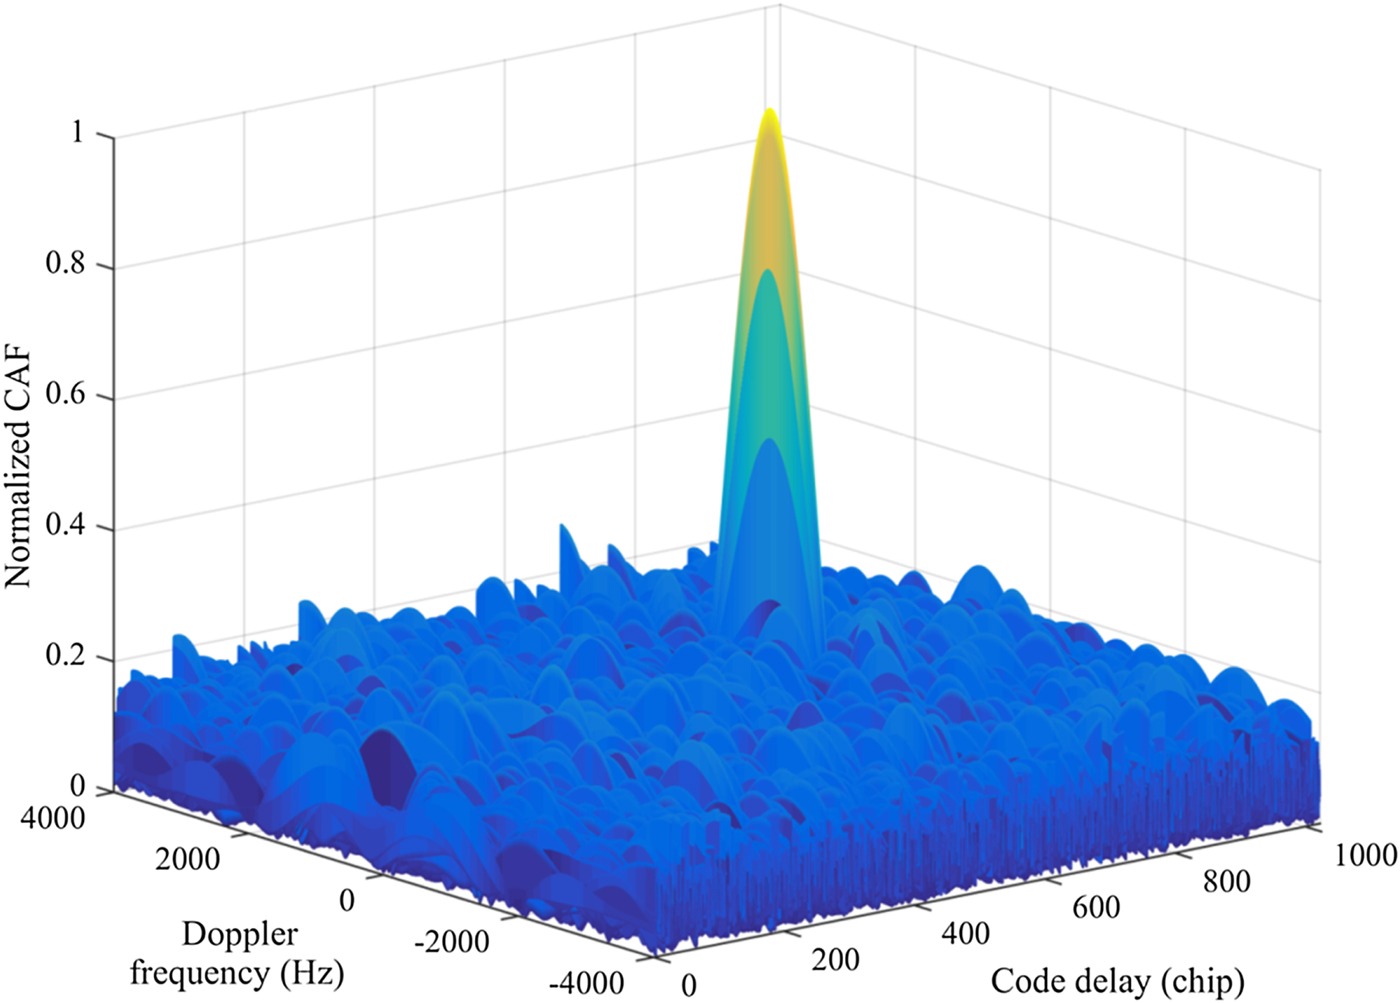
 $\hat{\tau }\ne\ \tau $, a low value should be obtained at the output (Borre et al., Reference Borre, Akos, Bertelsen, Rinder and Jensen2007). This is illustrated in Figure 2, where it can be seen that the peak progressively decreases when the local parameters move away from the incoming ones. For the carrier, the peak decreases progressively as a sinc function to reach its first null after 1/T C (T C being the coherent integration time, which is discussed later), while for the code the peak decreases linearly to reach a null after one chip for a BPSK signal (Foucras, Reference Foucras2015; Van Diggelen, Reference Van Diggelen2009) (for BOC signals the decrease is faster and there are multiple peaks within one chip (De Wilde et al., Reference De Wilde, Sleewaegen, Simsky, Van Hees, Vandewiele, Peeters, Grauwen and Boon2006)).
Illustration of the acquisition output with f D = 1000 Hz and τ = 700 chips.
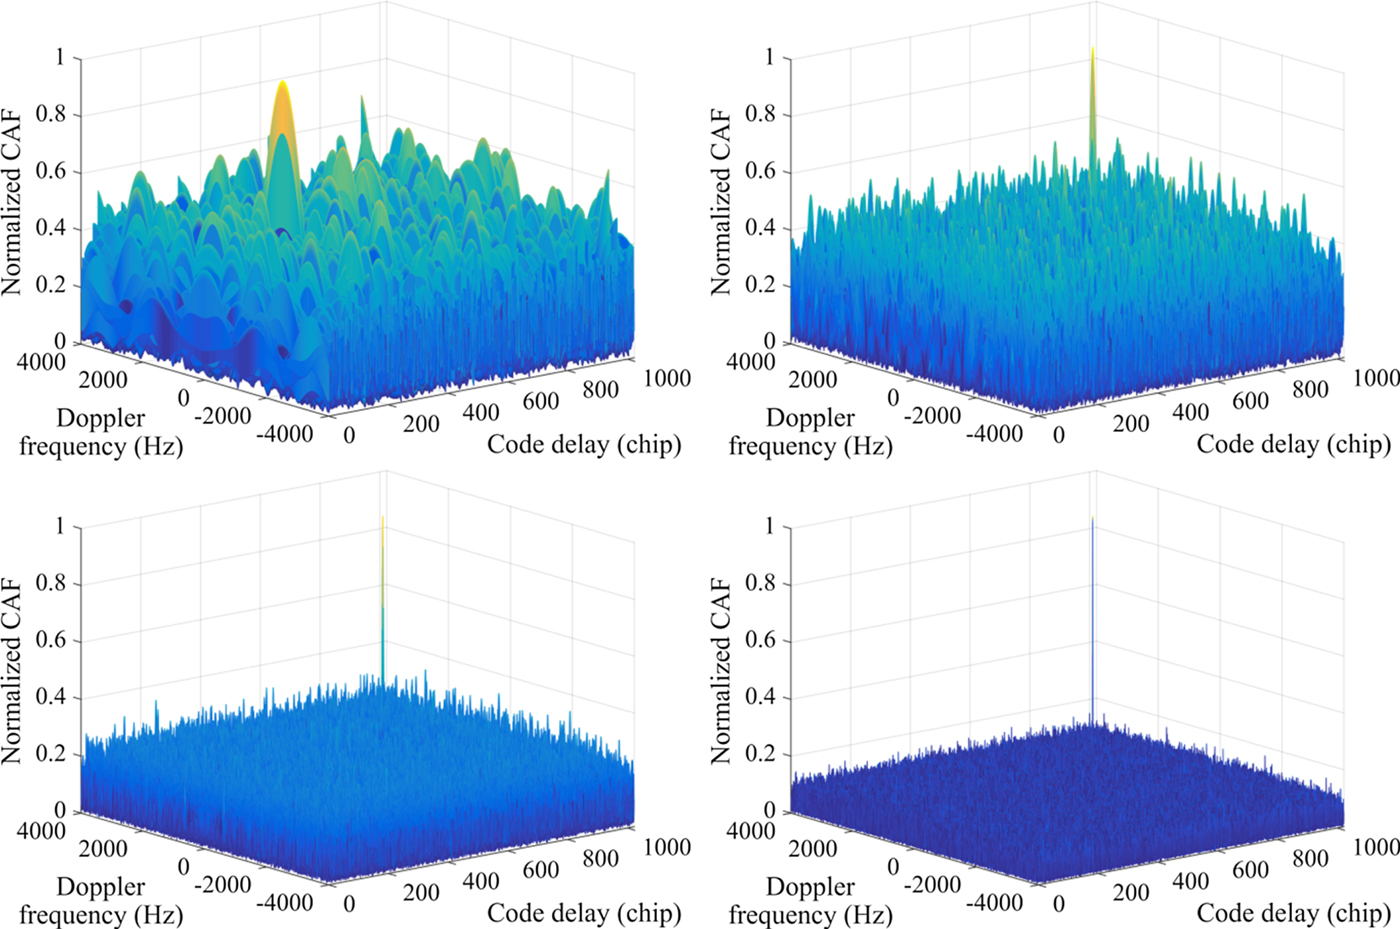
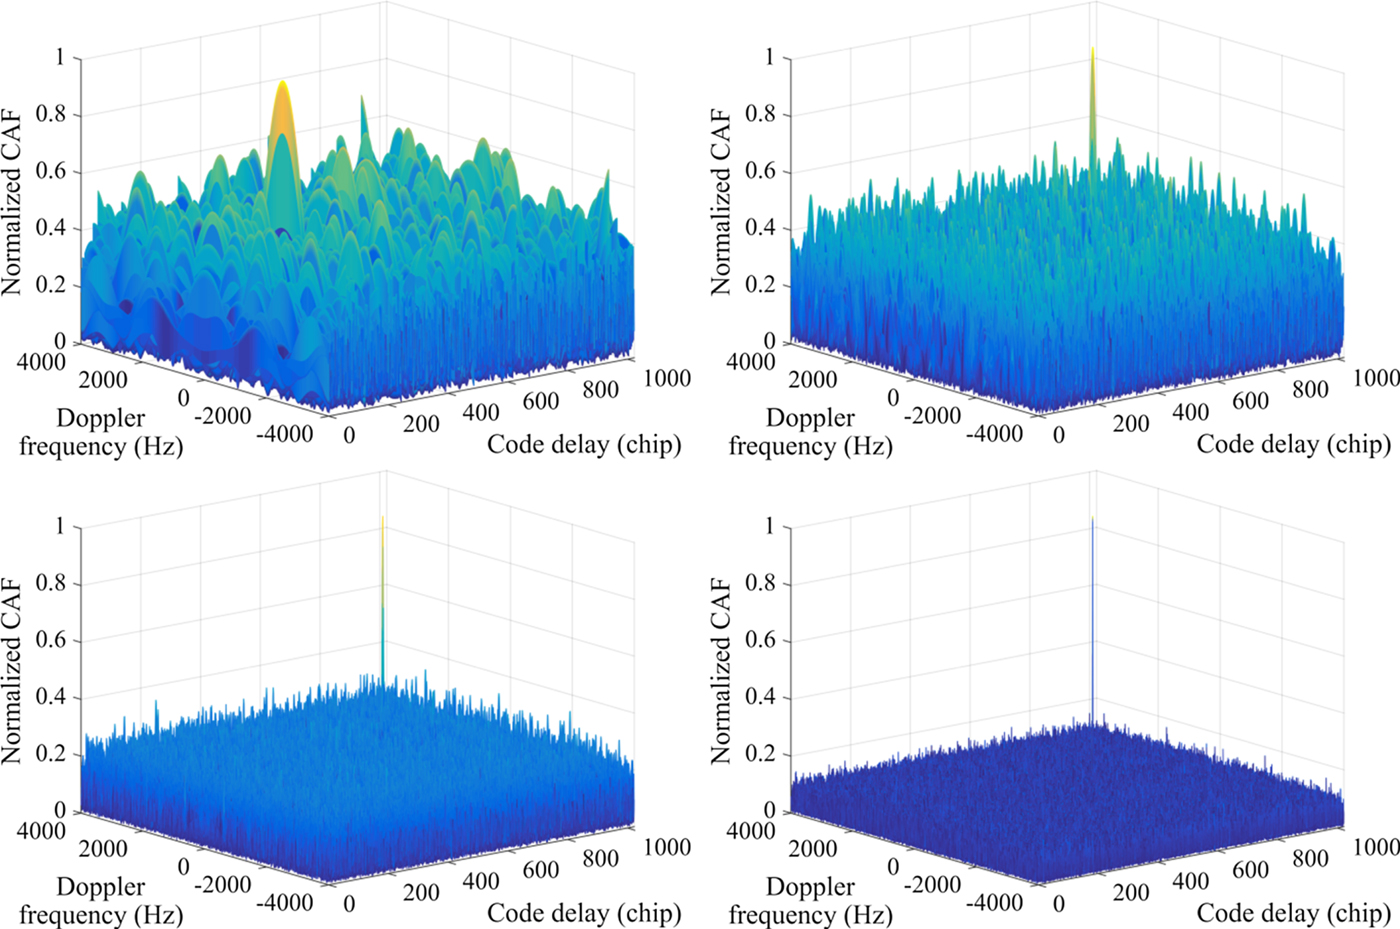
Of course, the output depends on the signal power, noise power and integration time, which should be long enough to raise the signal out of the noise. The longer the integration time, the higher the SNR (Van Diggelen, Reference Van Diggelen2009). Figure 3 illustrates this by showing the acquisition output for different integration times for a signal weaker than that shown in Figure 2.
Illustration of the impact of the integration time on the acquisition output for a signal weaker than Figure 2 Top left: 1 ms, top right: 5 ms, bottom left: 20 ms, bottom right: 100 ms.
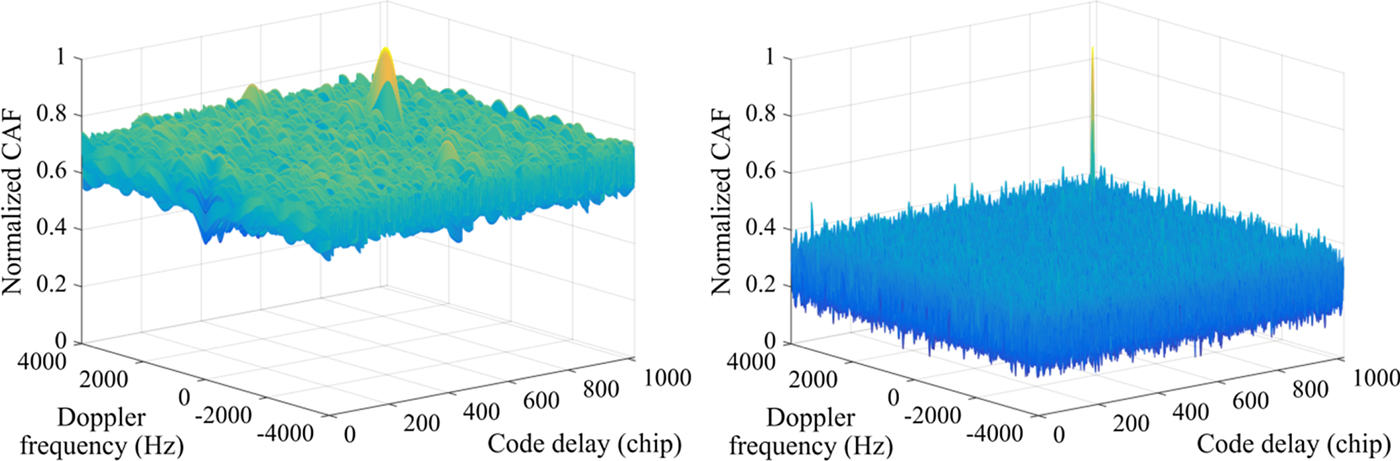
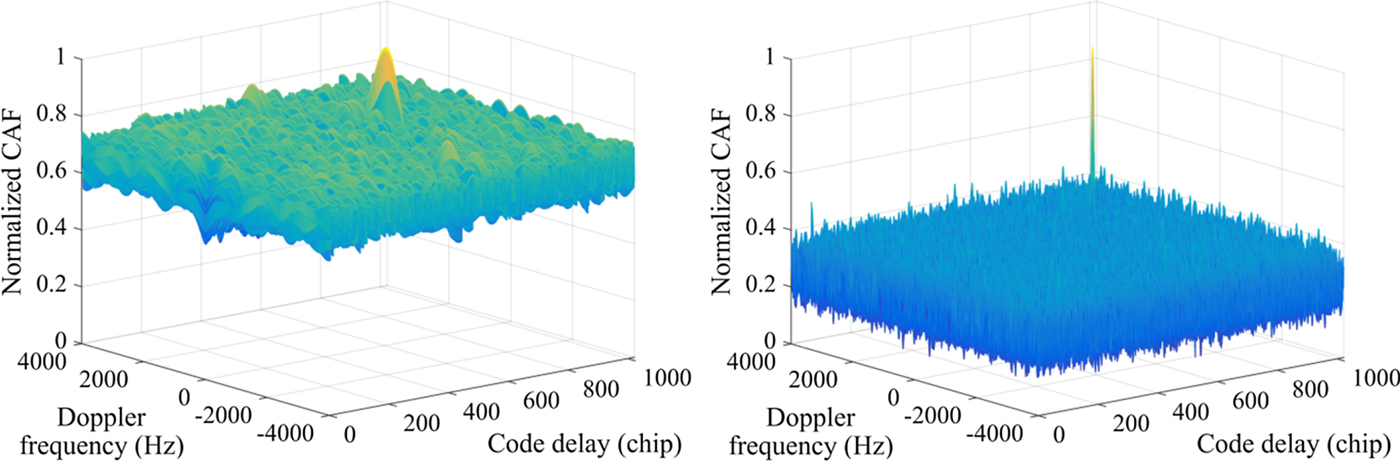
However, the integration time is limited by different factors: data (for data channels); dynamics, which can change the Doppler during the integration and thus shift and spread the correlation peak and local oscillator variations, with the same consequences or the frequency resolution, which would decrease too much (since it is inversely proportional to T C) and imply too many possibilities to test (Van Diggelen, Reference Van Diggelen2009). One way to overcome these drawbacks, or alleviate their effect, is to continue integrating after the computation of the magnitude, as shown in Figure 4. The integration before the magnitude computation is called coherent integration, and the integration after is called non-coherent integration. However, in terms of detection, the coherent integration is more efficient than non-coherent integration (Van Diggelen, Reference Van Diggelen2009). This is illustrated in Figure 5 where, in both cases 100 ms of signals are integrated, but a longer coherent integration time is used in the right figure. It is clearly seen that with a longer coherent integration time the noise floor is much lower, and thus the SNR is much higher. This is why, in terms of sensitivity, it is best to use the longest coherent integration time possible, and then use non-coherent integration (Van Diggelen, Reference Van Diggelen2009; Pany et al., Reference Pany, Riedl, Winkel, Wörz, Schweikert, Niedermeier, Lagraste, López-Risueño and Jiménez-Baños2009).
Acquisition principle with coherent and non-coherent integrations.

Illustration of the impact of coherent and non-coherent integration times on the acquisition output for a similar total integration time. Left: coherent integration of 1 ms followed by 100 non-coherent integrations, right: coherent integration of 10 ms followed by 10 non-coherent integrations.
2.3. Acquisition methods
There are different ways to implement the acquisition. The basic way following Figure 4, called serial search, is very time consuming and not in current use. Modern implementations use either massively parallel correlators or Fast Fourier Transform (FFT)-based techniques (Van Diggelen, Reference Van Diggelen2009; Reference Van Diggelen2014). The FFT can be used to parallelise the search in the frequency dimension to perform a Parallel Frequency Search (PFS) (Spangenberg and Povey, Reference Spangenberg and Povey1998; Mathis et al., Reference Mathis, Flammant and Thiel2003) in the code delay dimension to perform a Parallel Code Search (PCS) (Borre et al., Reference Borre, Akos, Bertelsen, Rinder and Jensen2007; Leclère, Reference Leclère2014) or in both simultaneously (Ziedan and Garrison, Reference Ziedan and Garrison2004; Akopian, Reference Akopian2005; Foucras, Reference Foucras2015). The PCS is an efficient method that offers a good balance between performance and memory requirements and is able to easily manage the Doppler effect on the code (Leclère et al., Reference Leclère, Botteron and Farine2013). Therefore, this is the implementation considered in this paper to illustrate our method. Note that the further discussions and the proposed method are also valid with other implementations since the focus of this paper is only on the correlation of the secondary code.
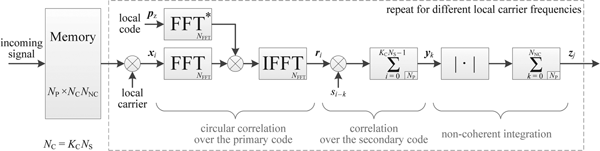
The architecture considered is given in Figure 6, which shows the memory storing the input data (typically used to process the samples at a rate faster than the sampling frequency to reduce the acquisition time (Leclère et al., Reference Leclère, Botteron and Farine2013)) and the correlation with the secondary code. In hardware receivers, the correlation with the secondary code and the non-coherent integration can be performed serially or in parallel, according to the priority (having lower processing time or lower memory resources) (Leclère et al., Reference Leclère, Botteron and Farine2017c; Leclère and Landry, Reference Leclère and Landry2018). Next, only the parallel implementation is considered, since the comparison between serial and parallel implementation was already done in Leclère and Landry (Reference Leclère and Landry2018) and Leclère et al. (Reference Leclère, Botteron and Farine2017c).
Parallel code search acquisition with secondary code correlation and non-coherent integration.

For our discussion, we will focus only on the correlation between the primary code correlations results and the local secondary code. Therefore, the operation considered is simply a circular correlation:
 $${\bi y}_{k}=\sum_{i=0}^{N_{\rm C}-1} s_{i-k}{\bi r}_{i}\comma \; $$
with k = 0, 1, …, N SN S the length of the secondary code, N C the number of primary code periods accumulated coherently (equal to N S or a multiple of it with a full correlation, lower than N S with a partial correlation), s the secondary code (its subscript is modulo N S), and r the primary code correlation results.
2.4. Galileo E5 secondary codes correlation properties
As shown in Equation (3), the operation performed by the receiver is a correlation. Therefore, knowing the auto- and cross-correlation properties of the secondary codes is important when looking at the detection statistics. Moreover, since the proposed method combines the secondary code correlation results, it is definitely useful to look at the correlation properties of the secondary codes.
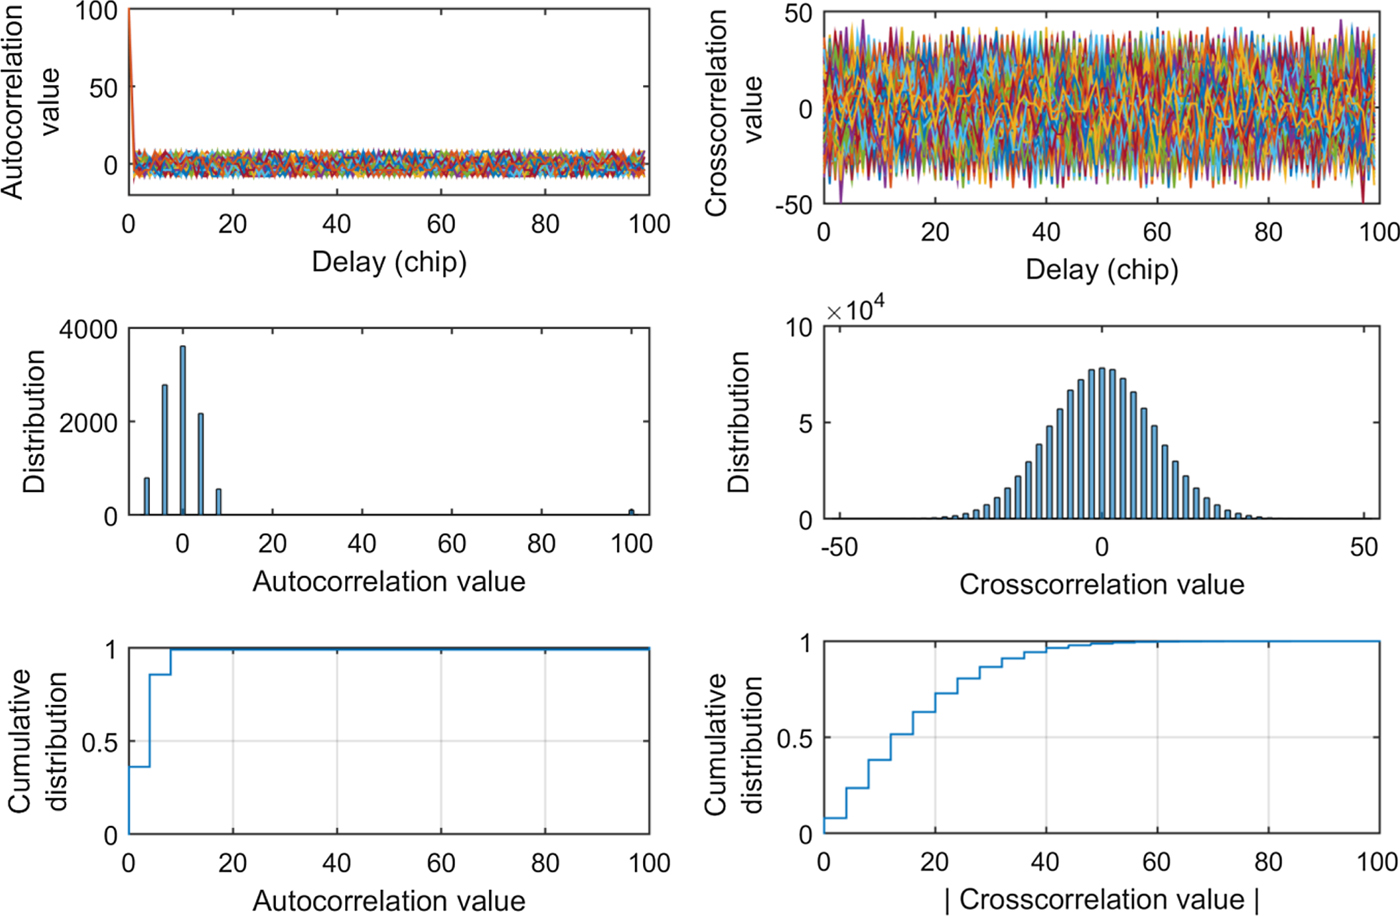
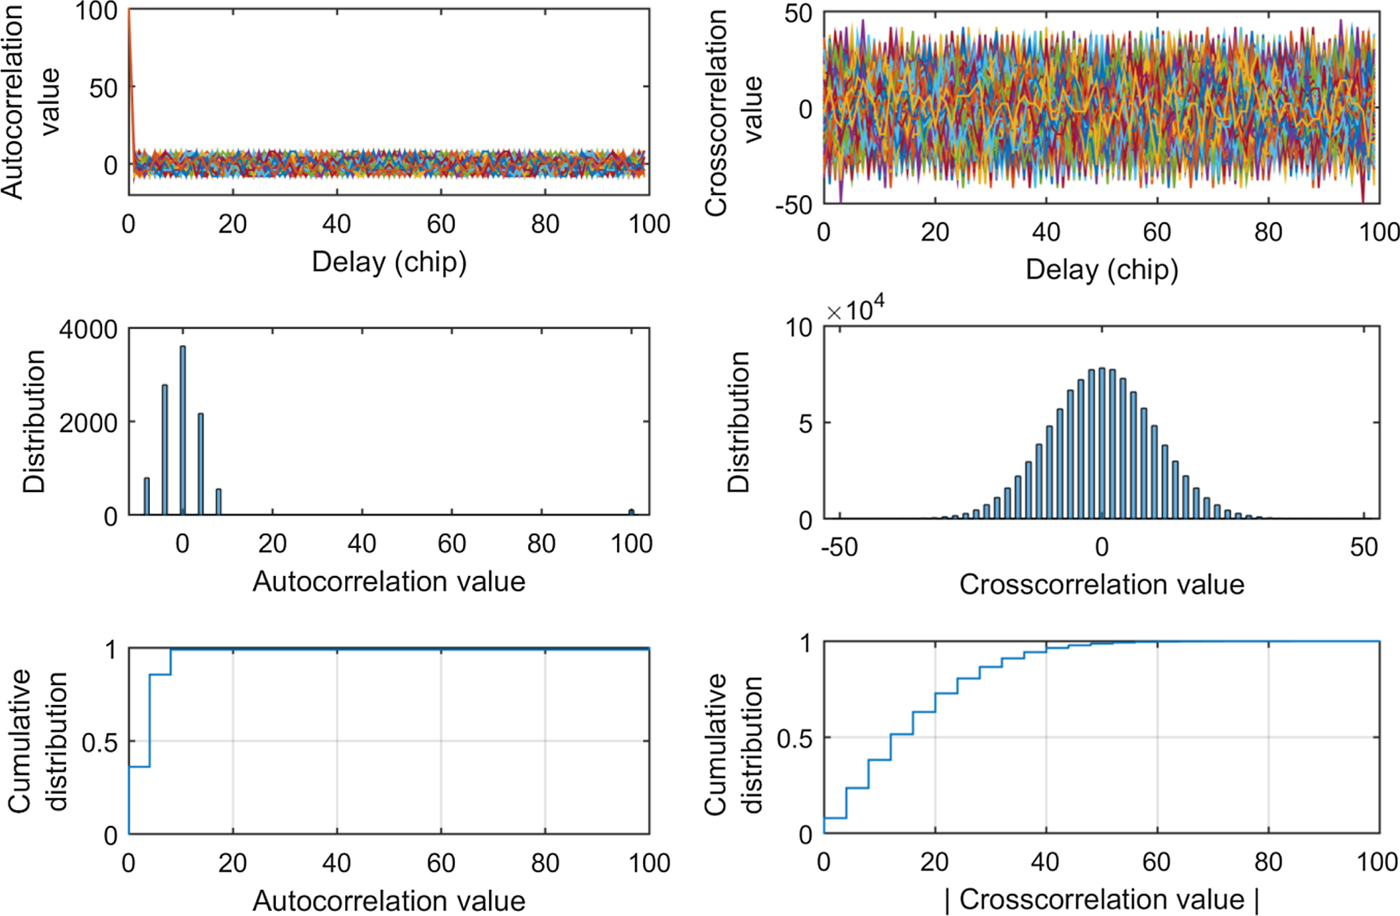
The Galileo E5a and E5b signals have the particularity of having one secondary code per satellite on the pilot channel. There are thus 100 secondary codes defined for the pilot channels of the E5 signal (50 for the E5a signal and 50 for the E5b signal) (European Union, 2016). These codes are 100 chips long, and since one chip is 1 ms, they are 100 ms long. Figure 7 shows the autocorrelation and cross-correlation of the E5 codes as well as their distribution. Their autocorrelation sidelobes can be 0, ±4 or ±8, with a magnitude average of 3·08 and a standard deviation of 2·67, whereas their cross-correlations are much more important since they can be between −50 and 42, with a magnitude average of 7·97 and a standard deviation of 6·06.
Autocorrelation (left) and cross-correlation (right) statistics of the E5 secondary codes.
3. EXTENSION OF THE COHERENT INTEGRATION TIME IN THE PRESENCE OF A SECONDARY CODE
As mentioned in the introduction, there are three main ways to extend the coherent integration time in the presence of a secondary code: (1) using a short coherent integration time (T C ≤ 5T PC typically, with T PC the period of the primary code) by testing all possibilities; (2) using a long coherent integration time (T C ≥ T SC, with T SC the period of the secondary code) by computing a full correlation or (3) using an intermediate coherent integration time (5T PC < T C < T SC) by computing a partial correlation.
3.1. Short coherent integration by testing all possibilities
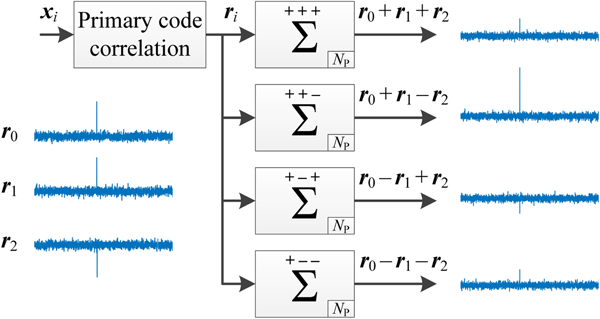
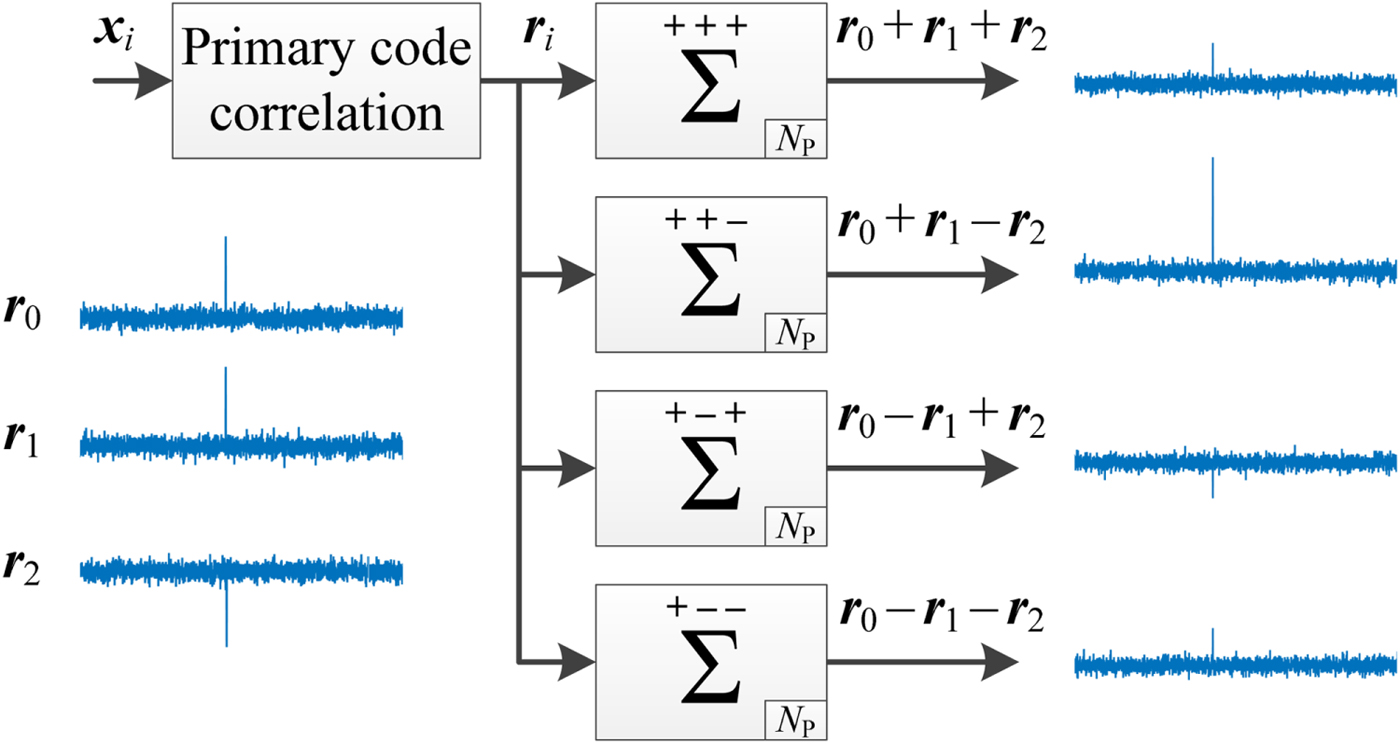
With a short coherent integration time, all the possible sign sequences should be tested to combine consecutive primary code correlation results. With coherent integration only, the number of possibilities grows exponentially as  $2^{N_{\rm C}-1}$ as shown in Figure 8. This is why the coherent integration time is short.
Illustration of short coherent integration with coherent integration only, with N C = 3.
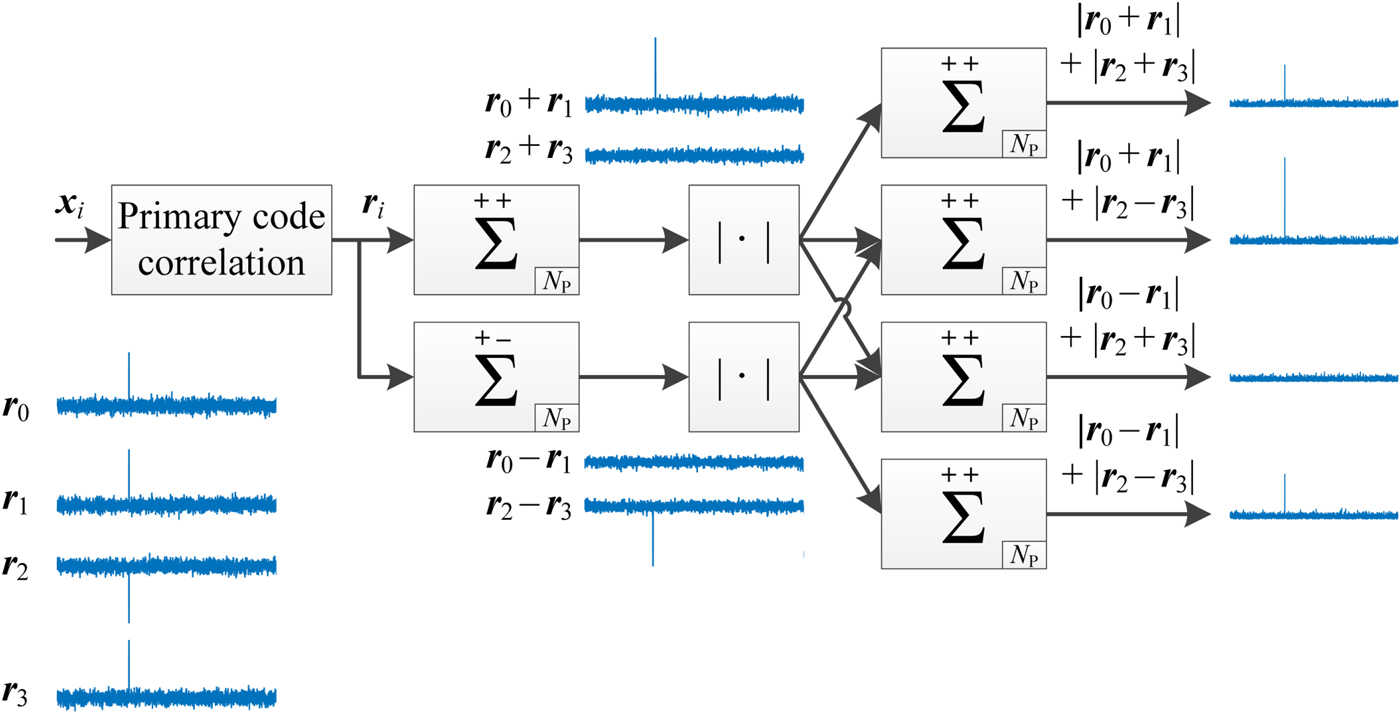
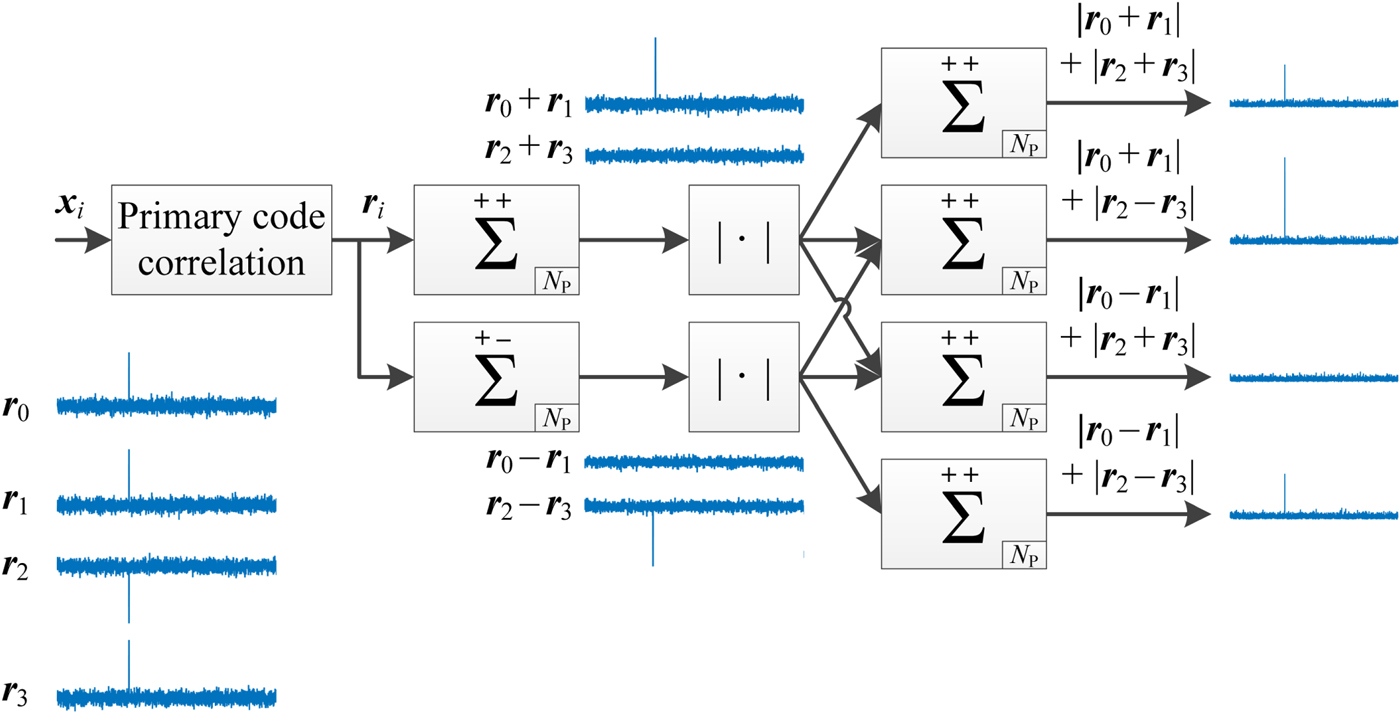
If non-coherent integration is also used, the number of possibilities grows even faster as  $\lpar 2^{N_{\rm C}-1}\rpar ^{N_{\rm NC}}$ as shown in Figure 9. Therefore, non-coherent integration cannot be used without rapidly exploding the number of accumulators needed, which is a strong limitation.
Illustration of short coherent integration with coherent and non-coherent integrations, with N C = 2 and N NC = 2.
The correlation properties of the secondary codes are not exploited here. Indeed, next to the correct combination giving the maximum peak, the combinations having only one sign different will give a peak relatively close (N C − 2 instead of N C, assuming normalisation), and so on. Therefore  $\lfloor N_{\rm C}/2\rfloor +1$ peaks from N C to 1 or 0 with a step of 2 will be observed (still assuming normalisation).
3.2. Long coherent integration by computing a full correlation
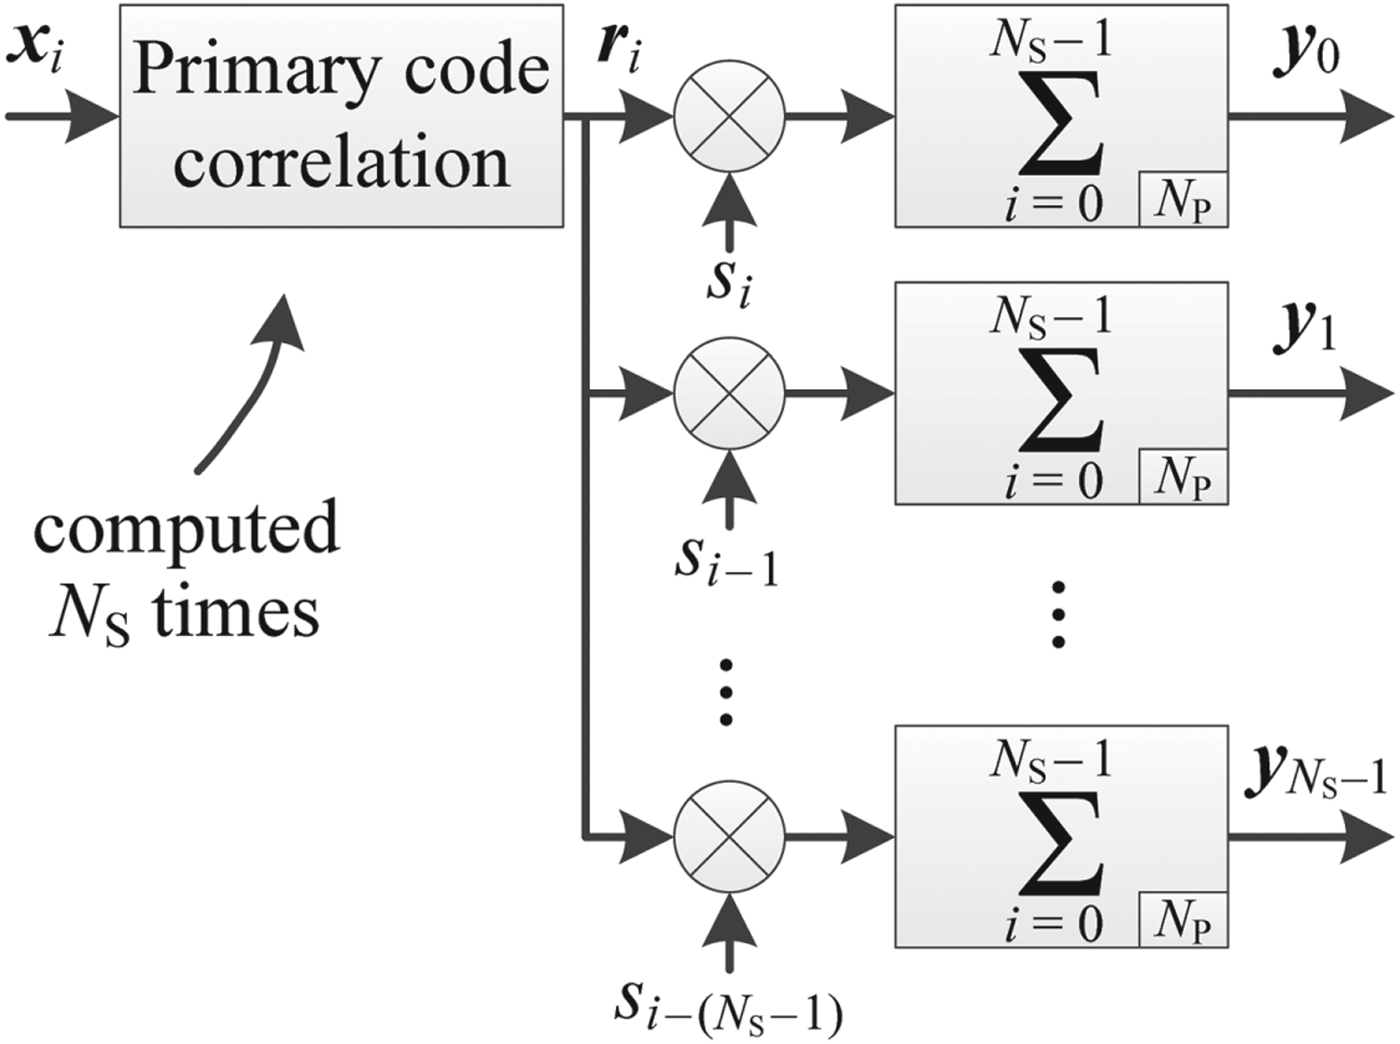
If the full correlation with the secondary code is computed over one period (that is, following Equation (3) with N C = N S), the implementation is the one shown in Figure 10, where N S different delays should be tested and N S samples are accumulated. This allows a long coherent integration time; however it implies a significant computational burden, and a significant amount of memory with a parallel implementation. This is especially true for the Galileo E5 signal, whose secondary codes are 100 chips long (much longer than the 20 chips of the L5 signal or the 25 chips of the E1 signal) and whose primary codes are also long (10,230 chips). Note that the non-coherent integration is not shown in Figure 10, but it can of course be added after each accumulator.
Traditional parallel implementation computing a full correlation.

3.3. Intermediate coherent integration by computing a partial correlation
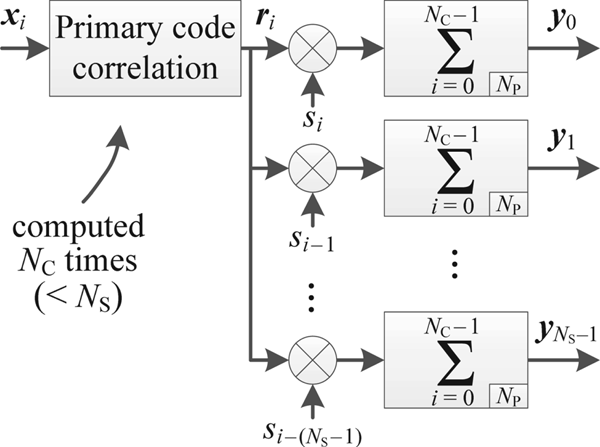
If one wants to reduce the complexity associated with the previous implementation, it is possible to simply use less than one secondary code period as input data. This is like computing a partial correlation, that is, following Equation (3) with N C < N S (Borio, Reference Borio2011; Reference Borio2008). The implementation is the one shown in Figure 11, it differs from Figure 10 by a number of factors: the number of primary code correlations computed (N C instead of N S); the length of the local secondary code (N C instead of N S, where each code is a portion of the secondary code) and the number of coherent accumulations after the product with the local secondary code (N C instead of N S) but the number of delays to test is still N S. Therefore, although the coherent integration time is reduced by a factor N S/N C, the complexity is reduced by a smaller factor. Thus, we can say that this implementation is less efficient than the one computing the full correlation.
Traditional parallel implementation computing a partial correlation.

The correlation properties of the codes are not kept at all when less than one code period is used. This can be easily shown with a simple example. For the traditional correlation given by Equation (3), if the input is a full period of the secondary code, the correlation result exhibits the same values regardless of the delay of the input secondary code, except that they are shifted. For instance, with the five-chip code  $\lsqb \matrix{1& 1 &1 &1 &-1}\rsqb ^{\rm T}$, the correlation yk for the five possible input delays is:
 $$\left[\matrix{5 & 1 & 1 & 1 & 1 \cr 1 & 5 & 1 & 1 & 1 \cr 1 & 1 & 5 & 1 & 1 \cr 1 & 1 & 1 & 5 & 1 \cr 1 & 1 & 1 & 1 & 5\cr}\right]\comma \; $$
where each column corresponds to one yk for a different delay of the input code.
Now, with the same five-chip code, but considering only four chips for the input, the correlation result becomes:
 $$\left[\matrix{4 & 2 & 2 & 2 & 2 \cr 2 & 4 & 0 & 0 & 0 \cr 2 & 0 & 4 & 0 & 0 \cr 2 & 0 & 0 & 4 & 0 \cr 2 & 0 & 0 & 0 & 4 \cr }\right]. $$
The main correlation peak is reduced since fewer inputs are used, and the correlation for the other delays is also changed. Moreover, the correlation side peaks depend on the delay of the incoming partial code. This will have an impact on the discussion in Section 5.
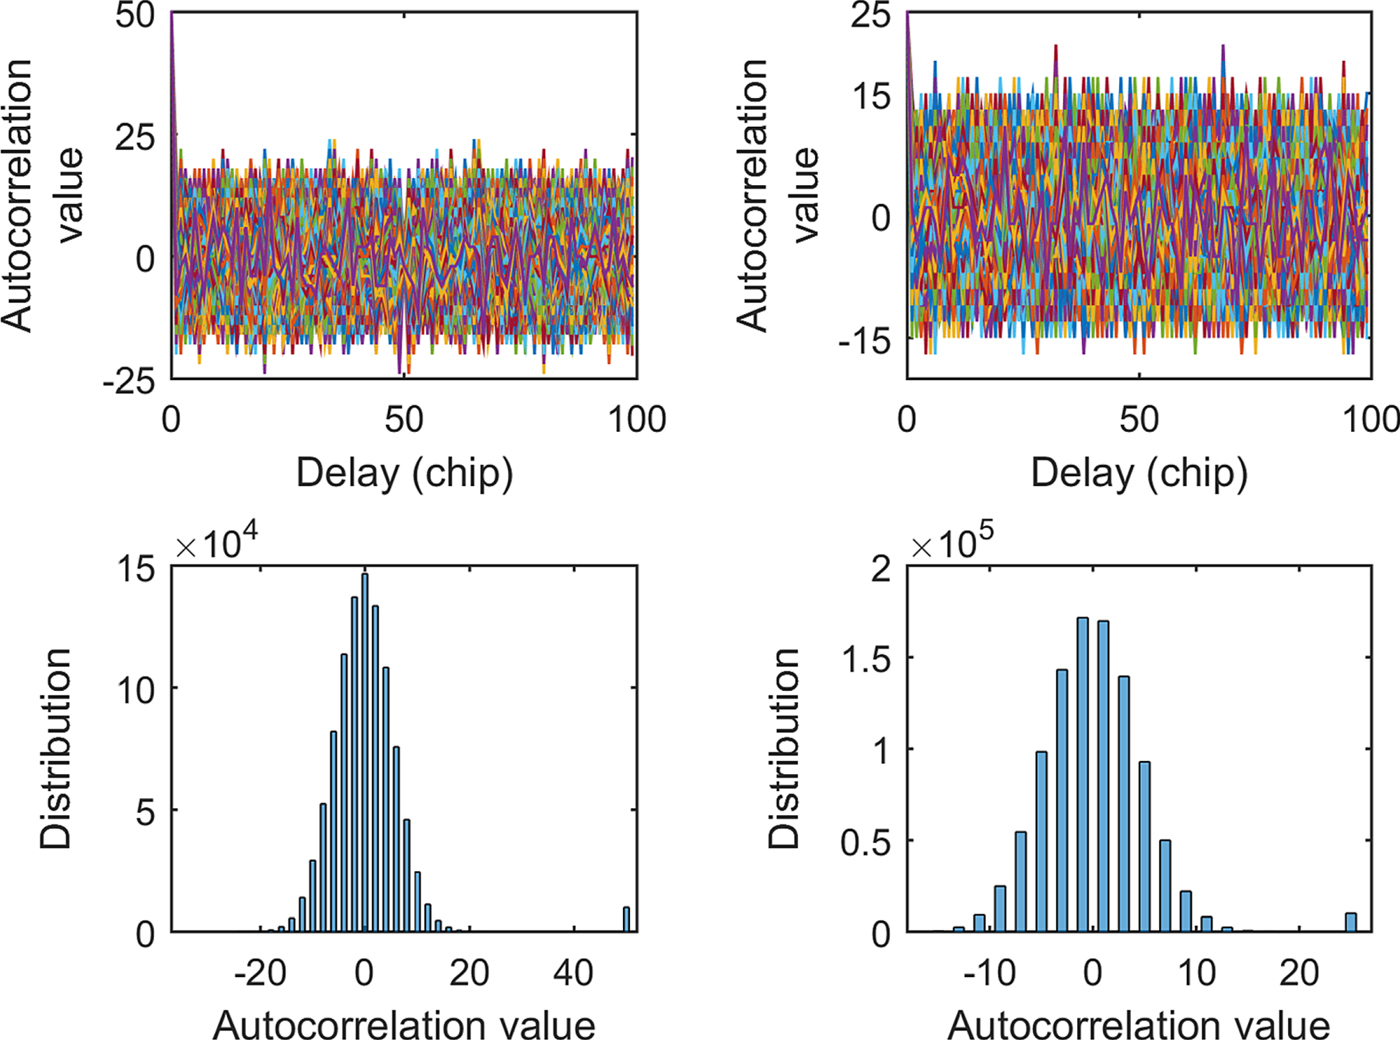
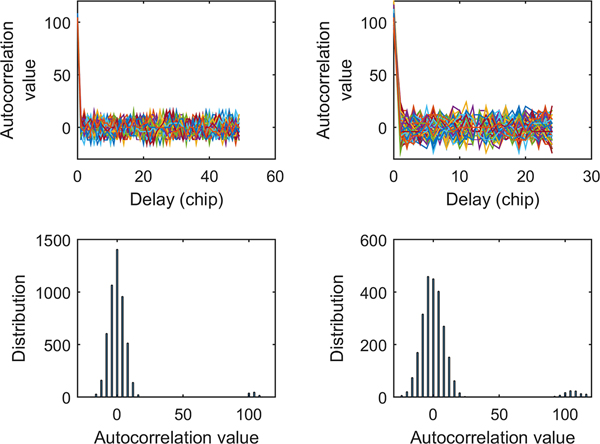
To illustrate this, Figure 12 shows the autocorrelation of the E5 secondary codes when using 50 and 25 chips instead of 100 chips, respectively. The peak at the correct alignment is the number of chips used, and for the other delays the autocorrelation is much higher than with the entire code, since the values can reach 24 and 21 respectively, instead of eight. Therefore, the ratio between the peak at the correct alignment and the other peaks is drastically reduced, which can have an impact on the detection probabilities.
Autocorrelation statistics of the E5 secondary codes when 50 chips are used in input (left) or 25 chips are used in input (right).

4. COMBINING SECONDARY CODE CORRELATIONS USING A FULL SECONDARY CODE PERIOD
4.1. Combining secondary code correlations principle
The proposed method consists of computing the combination of one or several outputs yk to reduce the complexity. The idea is not to compute the yk and then combine them, but to combine the elements first to compute less outputs and thus reduce the overall complexity. Since the method has been already detailed in Leclère and Landry (Reference Leclère and Landry2018), only a summary is given in this section.
In order to maximise the complexity reduction, the results combined should be distant by a delay of N S/N RC, with N RC being the number of results combined. The combinations can be either only additions, or alternately additions and subtractions (this last pattern should also be circular and can be used for even N RC only) (Leclère and Landry, Reference Leclère and Landry2018). Following these rules, there are N RC times less delays to search, which means shorter processing time or less accumulators needed. N RC inputs can be combined, which means N RC times less primary code correlations to compute and N RC times shorter local secondary code, which again implies a shorter processing time. Therefore compared to the traditional integration over one secondary code period, the SNR gain is around N S/N RC on average, while the complexity is divided by about  $N_{\rm RC}^{2}$. Thus, this means that the complexity decreases faster than the gain decreases; this is why this method is interesting. Moreover, the modified local secondary code may contain zeros, which can reduce the complexity even more. Such factors are rough estimations, the actual value being more or less close depending on the code considered and depending on the platform considered.
The output of the proposed method can thus be expressed as:
 $${\bi y}^{\prime}_{k}=\sum_{l=0}^{N_{\rm RC}-1} \lpar sign\rpar ^{l}{\bi y}_{k+\displaystyle{{N_{\rm S}}\over{N_{\rm RC}}}l} =\sum_{i=0}^{N_{\rm S}/N_{\rm RC}-1} s^{\prime}_{i-k}{\bi r}^{\prime}_{i} $$
with k = 0, 1, …, N S/N RC − 1, sign = 1 or −1, and:
 $${\bi r}^{\prime}_{i}=\sum_{l=0}^{N_{\rm RC}-1} \lpar sign\rpar ^{l}{\bi r}_{i+\displaystyle{{N_{\rm S}}\over{N_{\rm RC}}}l}\comma \; s^{\prime}_{i}=\sum_{l=0}^{N_{\rm RC}-1} \lpar sign\rpar ^{l}s_{i+\displaystyle{{N_{\rm S}}\over{N_{\rm RC}}}l}. $$
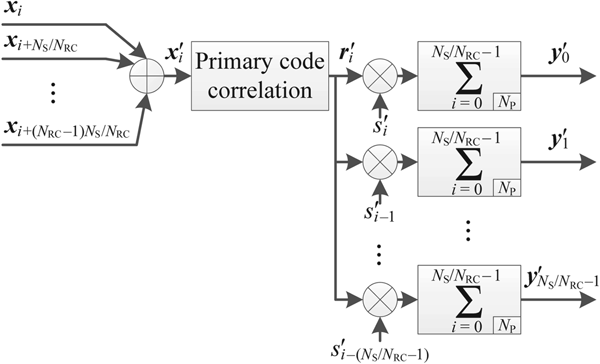
The corresponding implementation is shown in Figure 13. For example, with N S = 20 and N RC = 4, N S/N RC = 5, the combinations are:
Parallel implementation of the proposed method.

 $${\bi y}^{\prime}_{k}=\sum_{l=0}^3 {\bi y}_{k+5l} ={\bi y}_{k}+{\bi y}_{k+5}+{\bi y}_{k+10}+{\bi y}_{k+15}\comma \; $$
or
 $${\bi y}_{k}^{\prime}=\sum\limits_{l=0}^3 {\lpar -1 \rpar ^{l}{\bi y}_{k+5l}} ={\bi y}_{k}-{\bi y}_{k+5}+{\bi y}_{k+10}-{\bi y}_{k+15}. $$
Regarding the SNR, the correlation gain brought by the secondary code correlation for a coherent integration time of one secondary code period is:
 $$G=\displaystyle{{\left(\sum_{i=0}^{N_{\rm S}-1} s_{i-k}s_{i-m_{\rm S}}\right)^{2}}\over{\sum_{i=0}^{N_{\rm S}-1} s_{i-k}^{2}}}\comma \; $$
where m S is the delay of the incoming secondary code. In the traditional case of binary sequences, at the correct alignment (that is, k = m S),  $G=N_{\rm S}^{2}/N_{\rm S}=N_{\rm S}$.
When correlation results are combined, the gain becomes:
 $$\eqalign{G & =\left(\sum_{i=0}^{N_{\rm S}-1} s_{i-k_{1}}s_{i-m_{\rm S}} \pm \sum_{i=0}^{N_{\rm S}-1} s_{i-k_{2}}s_{i-m_{\rm S}} \pm \cdots \pm \sum_{i=0}^{N_{\rm S}-1} s_{i-k_{N_{\rm RC}}} s_{i-m_{\rm S}}\right)^{2} \cr & \quad /\sum_{i=0}^{N_{\rm S}-1} \lpar s_{i-k_{1}}\pm s_{i-k_{2}}\pm \cdots \pm s_{i-k_{N_{\rm RC}}} \rpar ^{2}\comma \; } $$
where  $k_{1}\comma \; k_{2}\comma \; \ldots\comma \; k_{N_{\rm RC}}$ are the delays of the local secondary code corresponding to the outputs combined (Leclère and Landry, Reference Leclère and Landry2018).
The drawback of this method is that the input data signal should be longer than the coherent integration time that will be obtained, and there is still an ambiguity in the secondary code delay. However, for this last point, once the Doppler shift and the primary code delay are found, the secondary code delay can be determined quickly.
4.2. Application to the E5 signal
As mentioned previously, in order to maximise the complexity reduction, the results combined should be distant by a delay of N S/N RC. In the case of the E5 signal where N S = 100, the possibilities are:
• N RC = 2 N S/N RC = 50 sign = 1 or −1.
• N RC = 4 N S/N RC = 25 sign = 1 or −1.
• N RC = 5 N S/N RC = 20 sign = 1.
•
 $N_{\rm RC}=10\quad N_{\rm S}/N_{\rm RC}=10 \ \ sign=1$ or −1.
• N RC = 20 N S/N RC = 5 sign = 1 or −1.
• N RC = 25 N S/N RC = 4 sign = 1.
• N RC = 50 N S/N RC = 2 sign = 1 or −1.

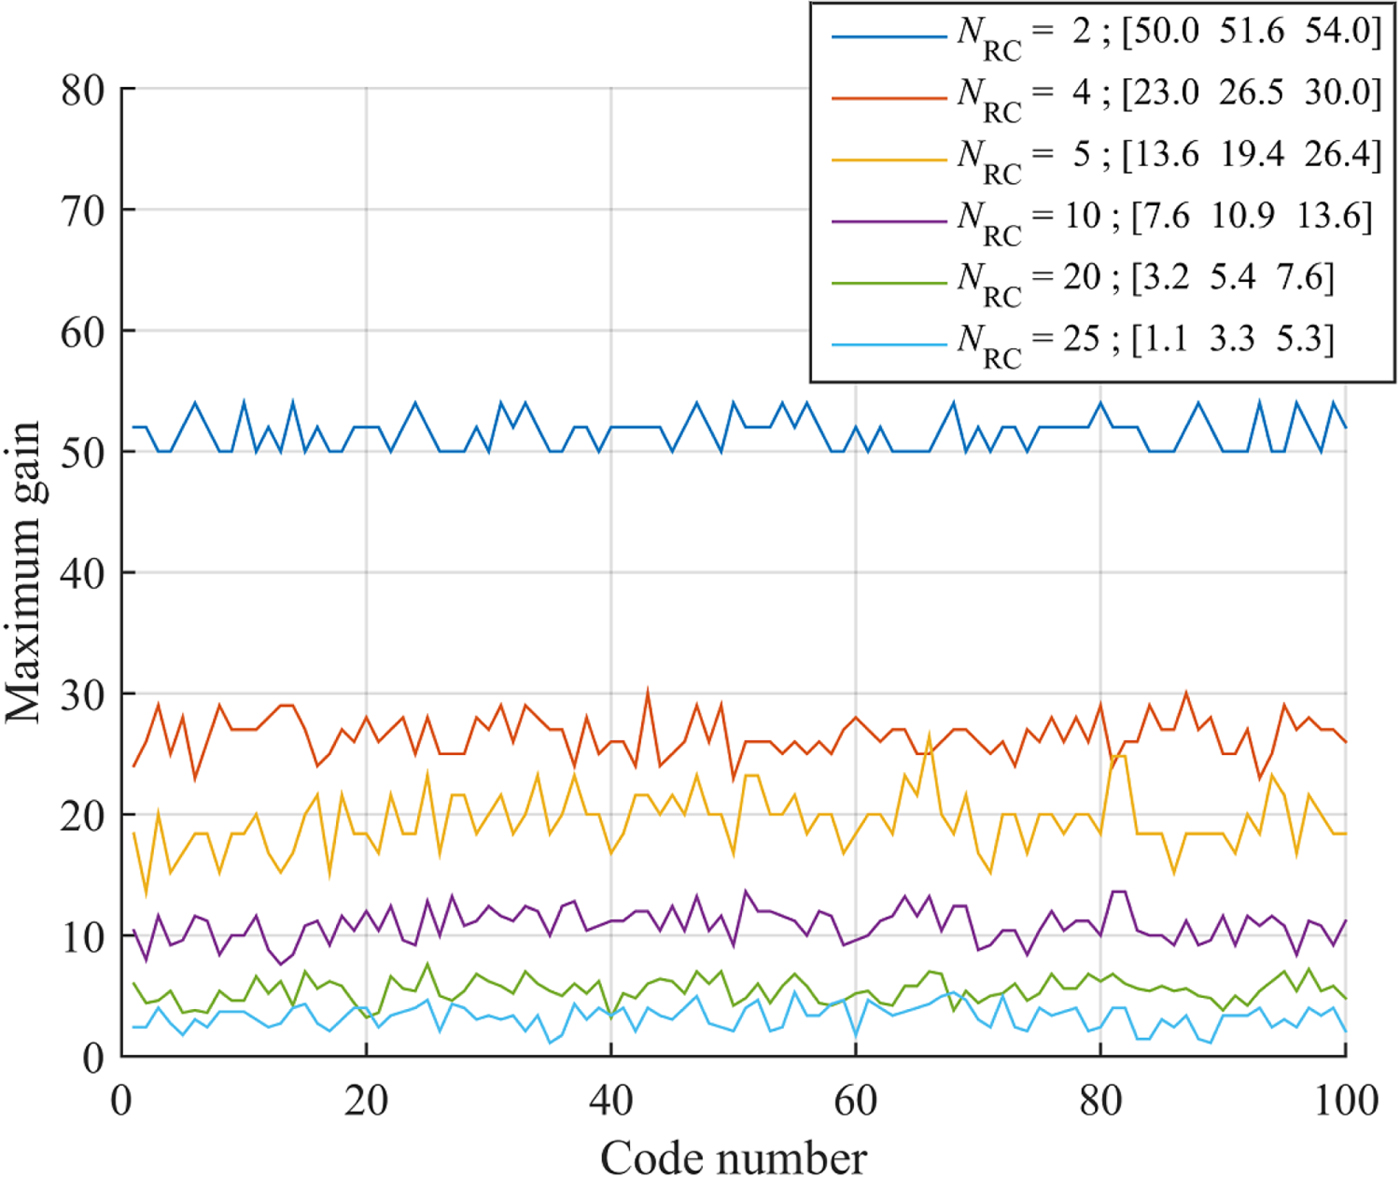
The last case would lead to very low gain and would be less efficient than the short integration time method, and it is thus not further considered. For the other cases, Figure 14 gives the gain obtained for each code for the different N RC, considering the best combination between plus only and alternative plus and minus As mentioned previously, it can be seen that the gain is around N S/N RC on average, and that not all the secondary codes provide the same performance.
Gain obtained with the method for the 100 E5 secondary codes, for different N RC. The legend indicates the minimum, average and maximum values across the codes.
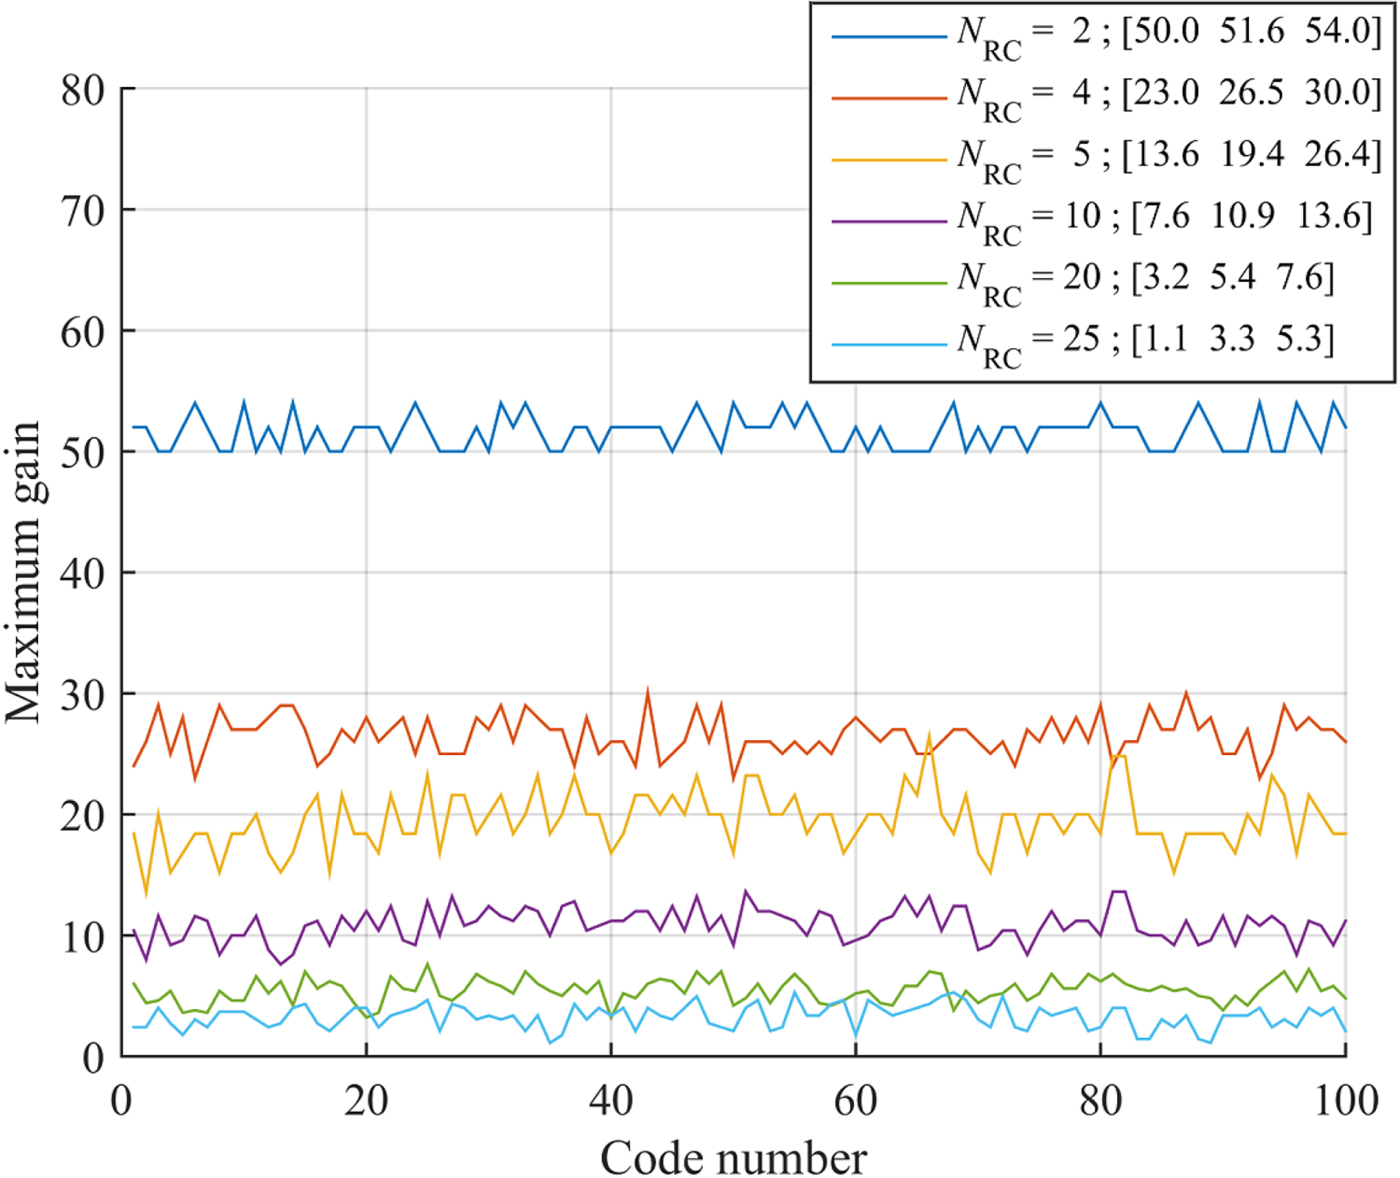
For N RC = 20 or 25, the gain is similar to what can be obtained with short coherent integration times. With N RC = 20 the proposed method would compute N S/N RC primary code correlations, and then do a correlation with a five-chip code for five delays, requiring five accumulators. The traditional implementation with a coherent integration time of 4 ms would compute four primary code correlations but would have eight accumulators, and with a coherent integration time of 5 ms, would compute five primary code correlations but would have 16 accumulators. Therefore, even for such high N RC, the proposed method can offer similar coherent integration time with a lower complexity, plus the possibility of using non-coherent integrations. In contrast, it would require much more memory for the input data, and the possibility to access 20 or 25 different portions of the input data, which may be difficult with hardware receivers.
For N RC between two and ten, the gain is similar to what can be obtained with the traditional method computing partial correlations. Comparing the proposed method and the one computing partial correlation with N C = N S/N RC, the number of primary code correlations is the same, and the length of the local secondary code is the same. However, with the proposed method the number of delays to test is N S/N RC instead of N S, which implies a significant saving in operations.
Now let us compare the memory. With the proposed method the input memory contains N PN S samples, and the N S/N RC accumulators contain N PN S/N RC samples. For the traditional method computing partial correlations, the input memory contains N PN S/N RC samples, and the N S accumulators contain N PN S samples. Therefore, the number of samples stored overall is the same, however the resolution of the samples in the input memory is much lower than the samples in the accumulators. Indeed, at the input the resolution is typically two or three bits, whereas after the primary code correlation the resolution is around 12 to 18 bits. Table 1 gives a quantitative comparison. It can be seen that the proposed method uses much less memory, up to 3.4 times less (that is, a reduction of 70%), corresponding to several Mbit. Moreover, this is without considering non-coherent integration, because if it was considered, the number of accumulators would be doubled which will be much more advantageous for the proposed method since it has less of those accumulators. In conclusion, the proposed method can offer better or similar gain than the traditional method using partial correlation, with a lower complexity and a significantly lower memory requirement. The main drawback of the proposed method here is that the gain obtained is not the same for all the codes, and variations from one to code to another can be relatively important.
Memory requirements for the traditional method computing partial correlation and for the proposed method with N S = 100, N S = 20 480, three input resolution of three bits, accumulators resolution of 15 bits.

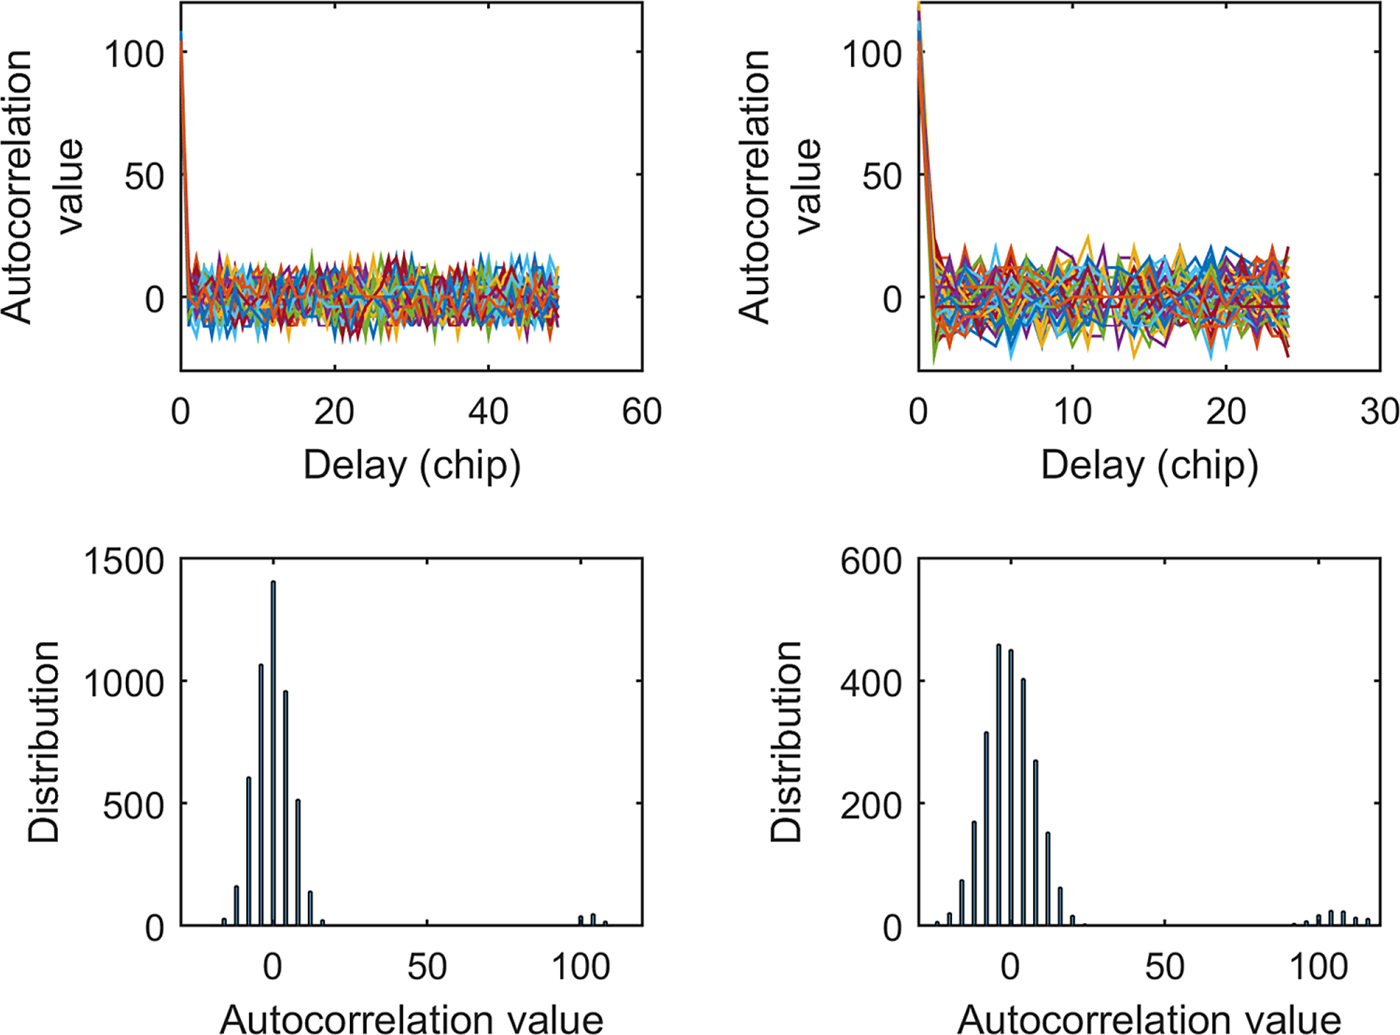
The proposed method does not change the correlation properties of the codes completely, unlike the partial correction. This is beacuse what is computed is the sum of the correlation for different delays. This is shown in Figure 15 for N RC = 2 (left) and N RC = 4 (right), where it can be seen that in both cases the main peak is still around 100, which is normal since its value is the sum of the main peak (which is 100) and one or three other peaks whose values can be 0, ±4 or ±8. In the same way, the values for the other delays are obtained as the sum of two or four peaks whose values can be 0, ±4 or ±8, which prevents a very high value as was the case with the partial correlation.
Autocorrelation statistics of the E5 secondary codes with the proposed method when N RC = 2 (left) and N RC = 4 (right).
5. COMBINING SECONDARY CODE CORRELATIONS USING LESS THAN A SECONDARY CODE PERIOD
In the previous section, it has been shown that the proposed method is efficient, however it requires a large amount of input signal, at least 100 ms with E5 (although it was also shown that it does not necessarily imply more memory overall). Therefore, in this section, we study the impact of using less than one period of the secondary code as input for the proposed method, that is, N C < N S in Equation (3).
The implementation is as identified in Figure 13, only the input combinations may be removed or reduced depending on N C and N S/N RC. Therefore, it can be first seen that using less input signal will clearly not reduce the complexity to the same proportion.
5.1. Impact of using less than a secondary code period on the correlation
In Section 3.3, it was shown that when using less than the code period as input, the correlation values are not the same according the input delay. This is problematic for the proposed method, because it means that when correlation results are combined, the final result will depend on the delay of the input secondary code, which is not desired. Moreover, when combining results, it may happen that the maximum does not correspond to the correct delay, which is definitively not desired since it would prevent the use of non-coherent integration or at least reduce the gain. The next sections quantify this.
5.2. Impact of using less than a secondary code period on the gain and SNR
Regarding the gain, Equations (10) and (11) still apply if less than one period of the secondary code is used as input, the only difference is that the upper limit of the sums is N C − 1 instead of N S − 1.
In Equation (11), the numerator of the gain depends directly on the correlation, and as shown previously when N C < N S the correlation depends on the delay of the input secondary code. Therefore the numerator of the gain depends also on the delay of the input secondary code.
The denominator of the gain is independent of the input secondary code delay only if N C = N S/N RC. This can be easily seen by expressing the operation with matrices where, after the combination, the size of the local circulant matrix is N S/N RC × N S/N RC. Therefore, if the number of inputs used is a multiple of N S/N RC, all the columns of the matrix will be used, whereas if it is not a multiple of N S/N RC, some columns will not be used, and consequently a different local code will be used for the different outputs.
Next, we focus only on the case N C = N S/N RC that gives a constant denominator for the gain.
5.3. Application to the E5 signal
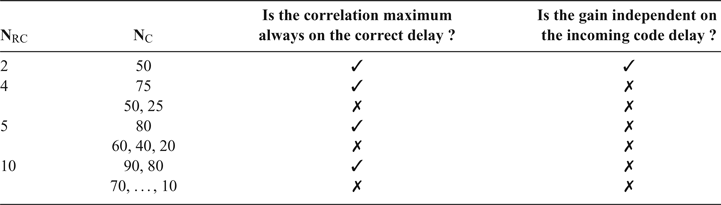
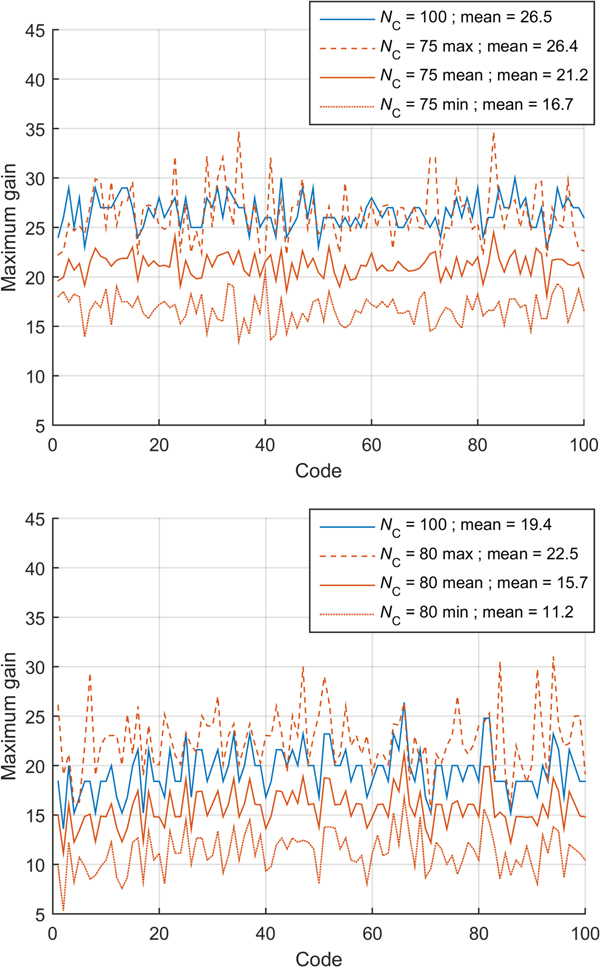
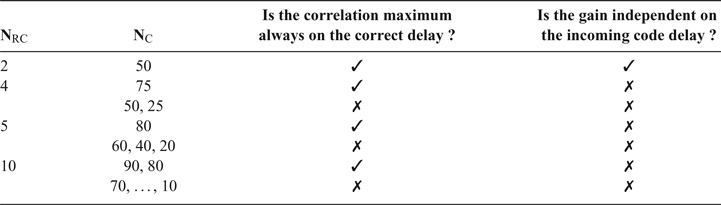
In this section, the combinations of the correlation results when N C = N S/N RC are studied, and two elements are observed. First, it is checked if the maximum is always obtained at the correct delay for any delay of the incoming secondary code. Second, it is checked if the gain is constant regardless of the delay of the incoming secondary code. Table 2 summarises this for different possibilities up to N RC = 10. It can be seen that for N RC = 2 and N C = 50, the delay is correctly estimated, and the gain is constant; whereas for the other cases, N C should be relatively high to always have the correlation maximum on the correct delays.
Summary of the combinations characteristics when N C < N S
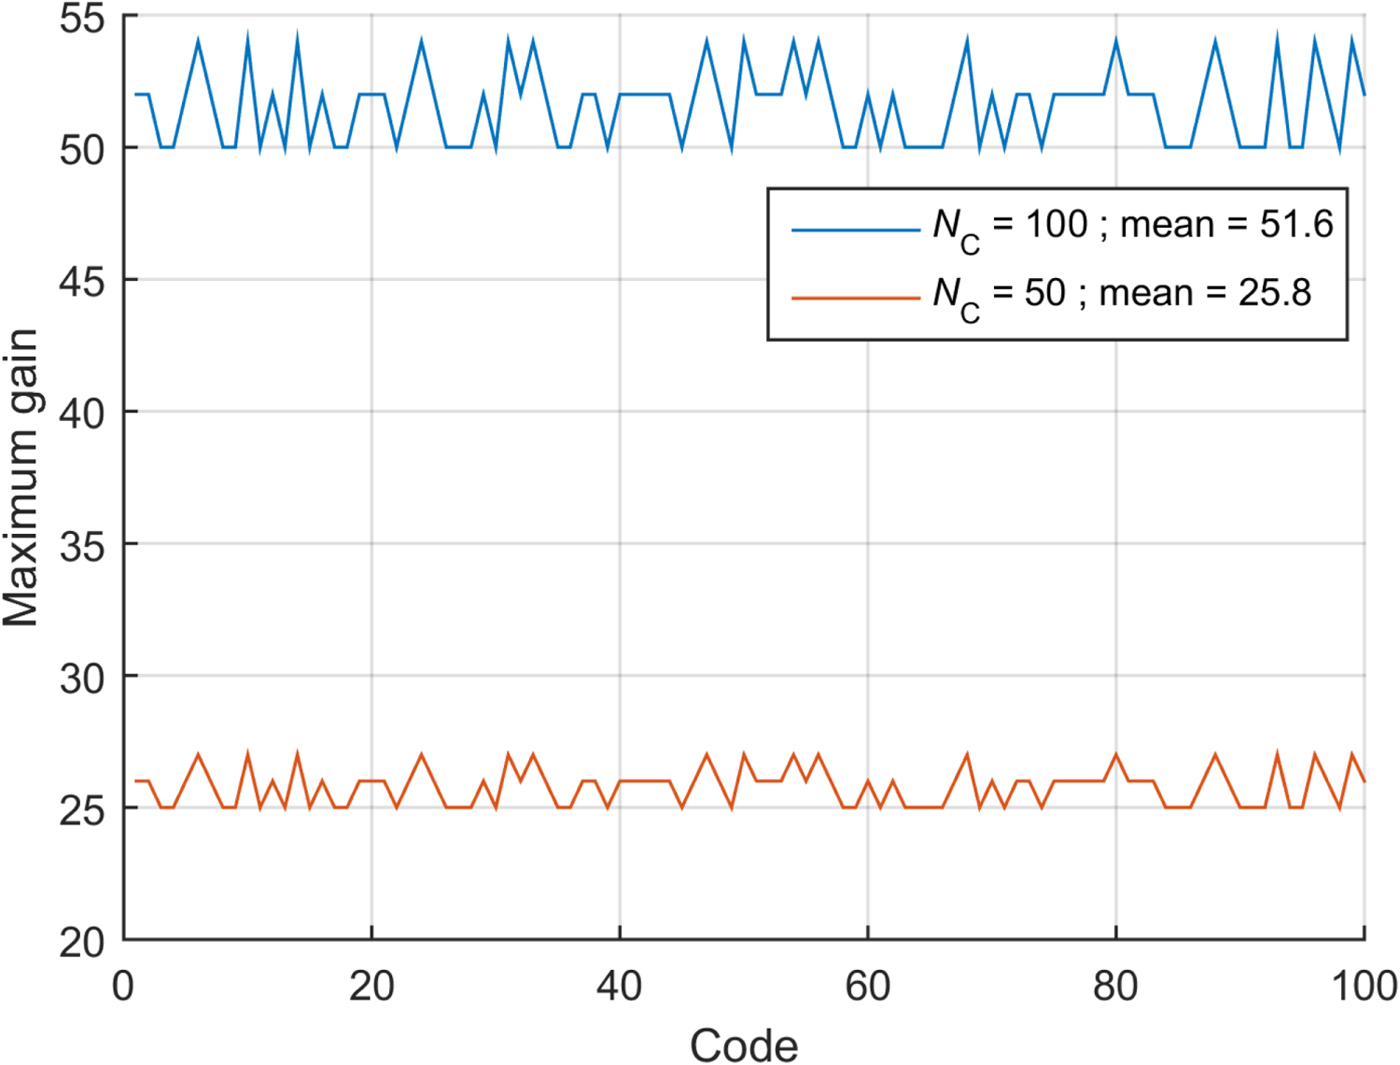
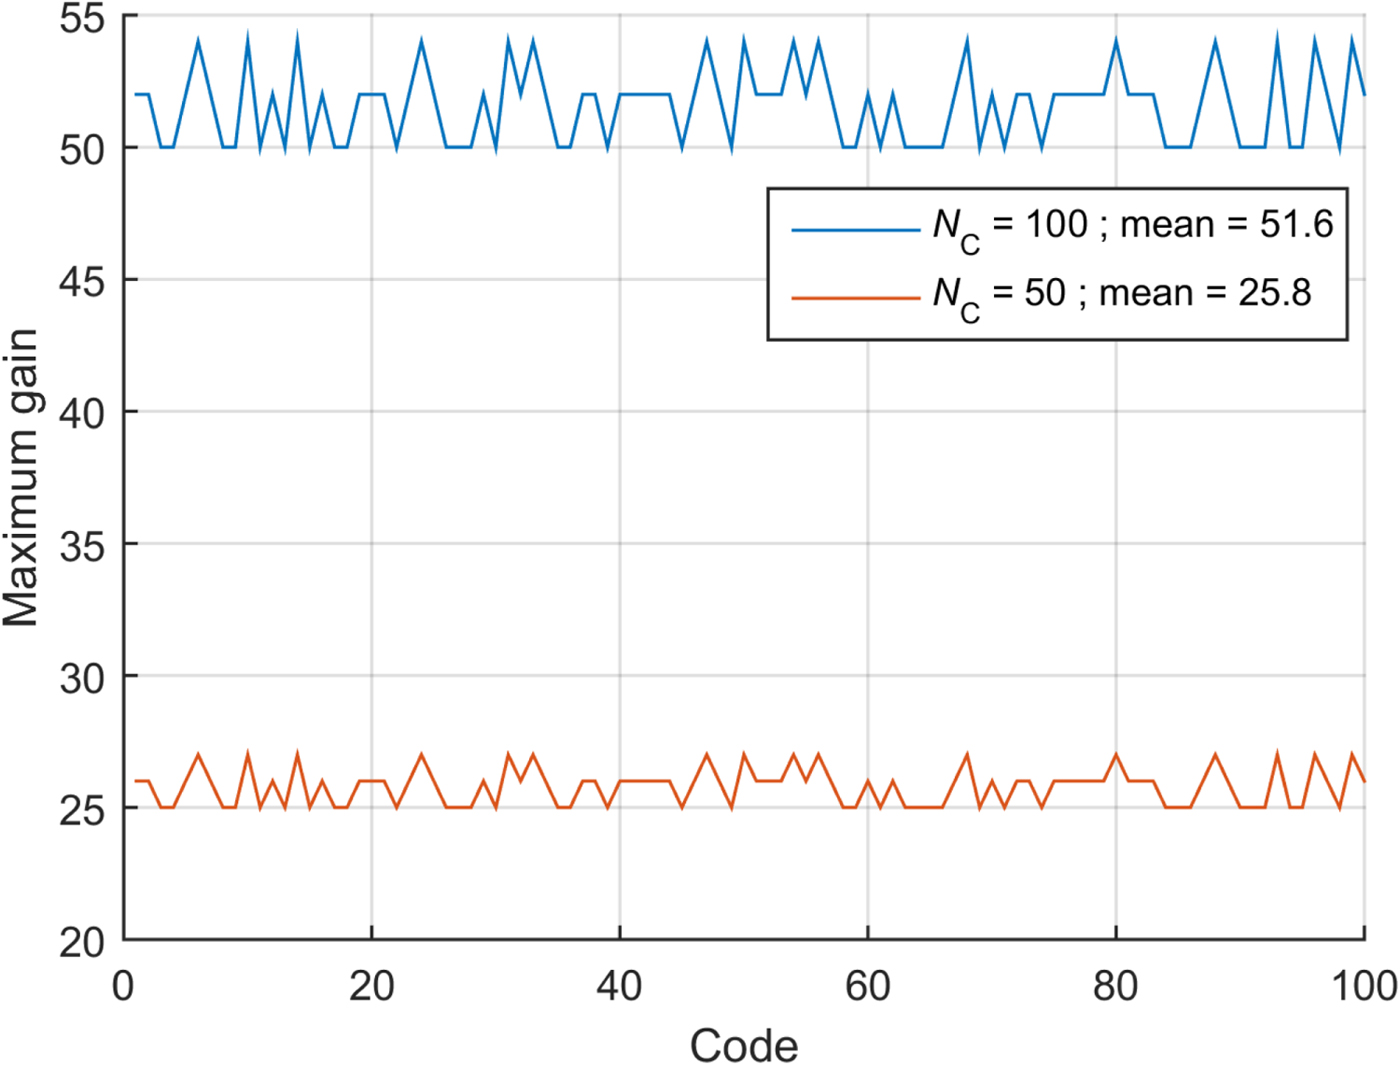
Figures 16 and 17 show the gain for the values of N C where the delay is correctly estimated. When N RC = 2, it can be seen that the gain is simply divided by two when N C = 50 compared to the case N C = 100. Using less input reduces the complexity by eliminating the combination of the inputs; however, overall, this is a slight reduction since the number of outputs computed and the local secondary code stay the same. The main advantage is to reduce the amount of memory to store the input signal. However, for the traditional implementation with N C = 50, the number of primary code correlations and their accumulations are the same, only the number of secondary code delays to test is still N S, while the gain is twice as high on average.
Gain obtained with the method for the 100 E5 secondary codes, for N RC = 2.
Gain obtained for N RC = 4 (top), and N RC = 5 (bottom). The minimum, average and maximum value are given across the delay of the incoming code.
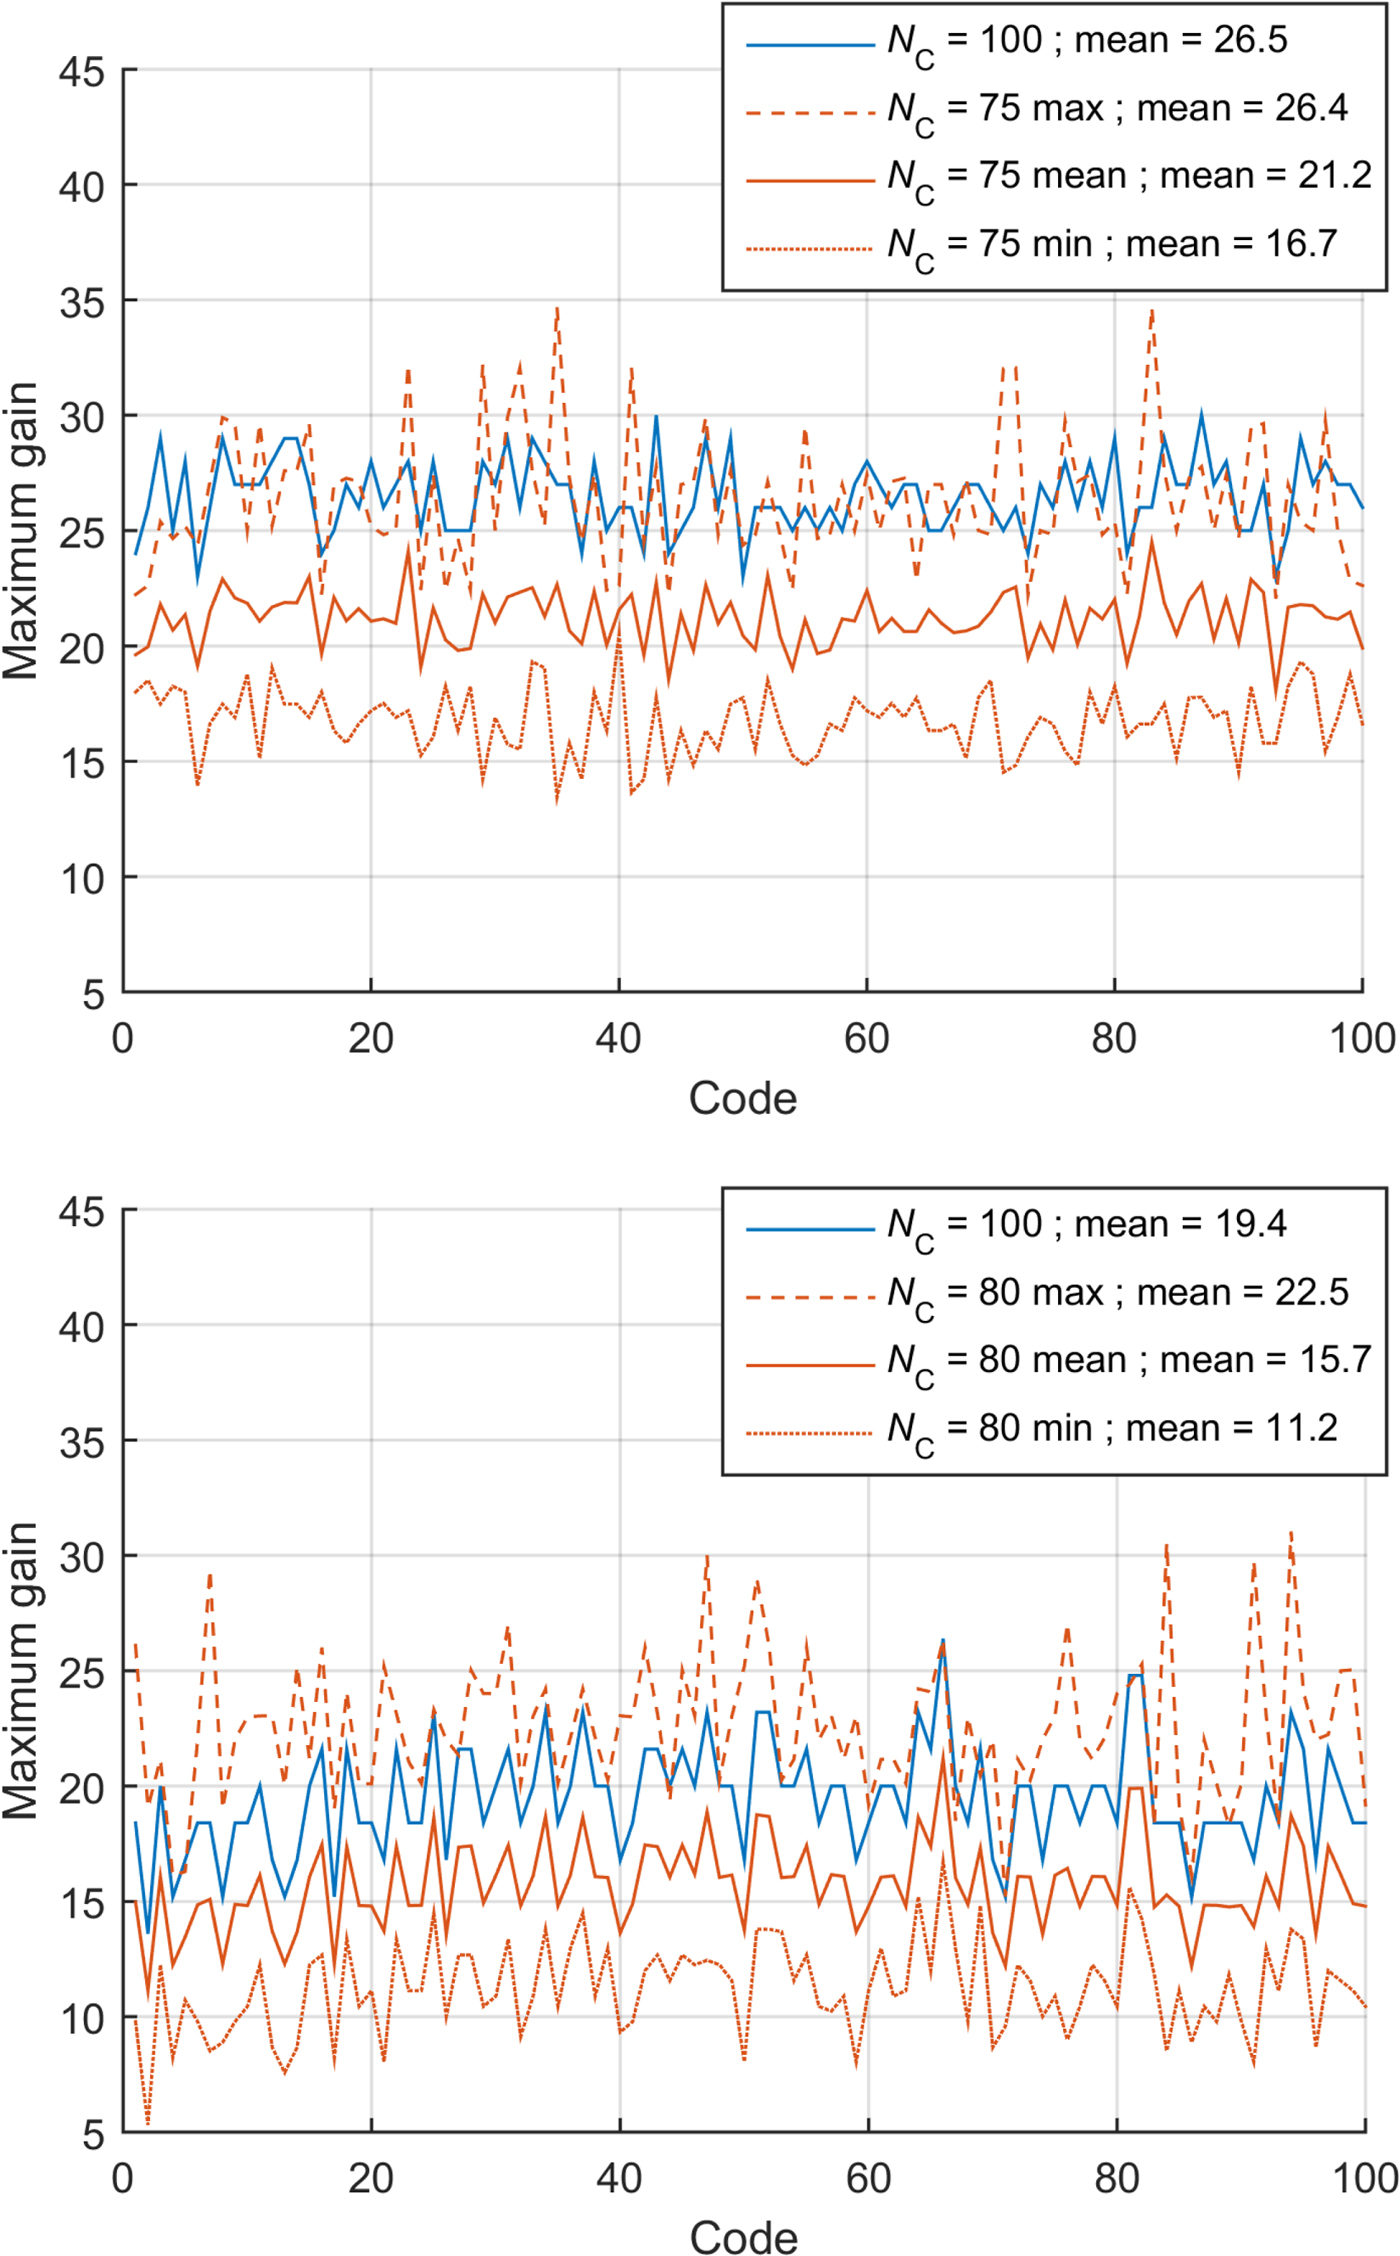
For the other cases, the average gain is reduced by approximately the same amount as the reduction in N C. As for the maximum gain, it can even be higher than the case N C = N S, however the minimum gain is also much lower.
6. CONCLUSION
This paper has shown that the method consisting of combining secondary code correlations to reduce the complexity applied previously to the GPS L5 signal can also be applied to the Galileo E5 signal. Compared to the traditional implementation, this method decreases both the complexity and the gain, but the complexity is reduced by a factor higher than  $N_{\rm RC}^{2}$ while the gain is reduced by a factor around N RC with N RC being the number of combined correlations. Due to the flexibility of the method, it can be applied for different contexts. It has been shown, for example, that it is possible that the proposed method offers a higher gain for a lower complexity compared to the traditional implementation if consecutive results are added. Otherwise, the core application of the proposed method is to provide intermediate coherent integration times (between 10 ms to 50 ms) with the possibility of using non-coherent integration. This is similar to the traditional implementation using partial correlation, but has much lower complexity and lower memory requirements, while keeping good autocorrelation properties. Even for a short coherent integration time, the proposed method can have a lower complexity than the short coherent integration method; however, in this last case the additional memory required to store the longer input and the high number of simultaneous accessing of the input data may be a brake (this typically depends on the context, if a hardware or software receiver is used).
Next, the possibility to use less than a full secondary code period as input in order to reduce the amount of memory to store the input signal has been studied. It has been shown that not using a full secondary code period changes the correlation result, which implies additional constraints on the proposed method. Except for the case where two results are combined, the gain obtained depends on the delay of the input secondary code, which may give inconsistent performance for a receiver. Moreover, it has been shown that the complexity of the proposed method is not significantly reduced when less than a full secondary code period, making it not more efficient than the traditional implementation.
In conclusion, the combining of secondary code correlations is efficient when one or a multiple of a secondary code period is used as an input, allowing the use of intermediate coherent integration time and non-coherent integration for reasonable complexity. However, it cannot be used when less than a full secondary code period is used as an input.