

The largest democracy in the world, India, witnesses religious violence between majority Hindus and minority Muslims. Although political struggles centered on religious cleavages pre-date Indian independence and concomitant Partition in 1947, post-independence religious riots happen in the context of democratic electoral politics and party competition. There exist a variety of explanations for such religious riots. For instance, the presence or absence of a robust civic culture that builds upon everyday interactions between people of different communities (Varshney Reference Varshney2002). The uneven spread of economic development leading to increased dissatisfaction in society has also been cited as an important source of religious animosity (Hasan Reference Hasan1982). Deeper historical perspectives have revealed that the creation of separate electorates for Hindus and Muslims by the British exacerbated religious cleavages (Verghese Reference Verghese2016). It has been observed, moreover, that religious riots were prevalent in regions ruled by Indian princes during the colonial era (Verghese Reference Verghese2016).
This paper addresses the research on the relationship between electoral competition and religious riots in India, which argues that political parties' quest for electoral gains motivates ethnic or religious ideologies that propagate a sense of “in-group” and “out-group,” which in turn exacerbates inter-religious tensions (Varshney Reference Varshney2002; Brass Reference Brass2003; Wilkinson Reference Wilkinson2004). These outbidding explanations—using insights from the broader research on ethnic political competition—focus on how the rise of political parties and electoral competition between them affects the likelihood of religious riots.
However, it remains unclear whether it is the presence of “communal parties”—as religious parties are termed in India—or the process of their emergence that increases or decreases the likelihood of rioting. Such a conflation of the effects of the presence of communal parties with the process of their emergence on the likelihood of rioting arises because scholars investigate effective number of parties (Wilkinson Reference Wilkinson2004), upcoming state or national elections (Brass Reference Brass2003; Engineer Reference Engineer1991), but ignore the role of party system stability/change in influencing the likelihood of religious riots.
Using a comparison of 15 Indian states from 1981 to 1995, we show that electoral volatility explains why riots are endemic to some states in India and not others. Specifically, as electoral volatility increases, the likelihood of religious riots also increases. Because electoral volatility is the net change in vote shares of political parties over elections (Pedersen Reference Pedersen1979), and therefore the extent of change in voting behavior of people, by doing so, we show that it is not the presence or increase in the number of parties that increases the likelihood of religious riots. Rather, the electoral volatility in the system—caused by voter behavior—increases the likelihood of religious riots. Such instability is indicative of voters' re-alignment with different parties, which predicts an increase in religious riots.
By showing that party system stability, measured in terms of electoral volatility, explains when political parties become associated with communal violence and when they do not, we imply that it is the net vote transfer from one party to another that explains levels of communal violence, not the effective number of parties. By doing so, we extend the research on ethnic outbidding by suggesting that the presence of parties with preset secular or religious oriented ideologies cannot by themselves explain religious violence in India. Rather, our findings imply that religious violence in India is contingent upon how voting behavior affects inter-party competition. Thus, shifting the direction of effect on religious violence from one that flows from political parties to citizens to one that flows from citizens to political parties.
In order to present the broader quantitative analysis of electoral volatility and religious riots in India, the rest of this paper is divided into three sections. The first section presents the broader research on ethnic parties and electoral volatility in order to show how our theory builds upon it and contributes to it. The following section focuses on the empirical tests, which find that electoral volatility is a significant explanatory factor for the occurrence of religious riots. The conclusion summarizes the paper, discusses its limitations, and discusses avenues for further research on India and other regions.
ETHNIC OUTBIDDING AND ELECTORAL VOLATILITY IN INDIA: EMERGING PARTIES OR VOTING BEHAVIOR
Ashutosh Varshney and Steven Wilkinson define instances of religious riots in India as (a) events characterized by violence and (b) in which members of two or more communally identified groups confront each other at some point during the violence (Wilkinson Reference Wilkinson2004, 255–56). Cross-regional research on the role of political parties, specifically ethnic parties, in fomenting and sustaining violence such as riots remains divided between those who claim that increases in the number of ethnic parties increases the likelihood of ethnic violence and those who argue that increases in the number of ethnic parties decreases the likelihood of such violence. Although the research on South Asian democracies also reflects this division, there has been an attempt to question the assumptions regarding such identity that underlie this debate. As this review shows, our theory builds upon the latter attempt by accounting for the effects of voter behavior in India rather than focusing on the presence of parties based on religious ideologies.
Longstanding scholarship considers ethnic parties as the primary motivators of the ethnic outbidding dynamic. Rabushka and Shepsle posit that such parties compete with each other for votes from certain ethnic groups by using increasingly extreme positions on those groups' causes and interests, which leads to a spiral toward ethnic conflict (Rabushka and Shepsle Reference Rabushka and Shepsle1972). Donald Horowitz (Reference Horowitz1985) extended this argument by showing societies riven by ethnic cleavages create party systems centered on these divisions. Moreover, Horowitz (Reference Horowitz1985) posits that ethnic parties are unable to create cross-ethnic coalitions because their appeal is bounded by the ascriptive identity of ethnicity. Jack Snyder (Reference Snyder2000, 19) argues that ethnic outbidding in newly democratic countries not only increases inter-group conflicts, but also hampers the process of democratization as nationalist demagogues abuse the newly free press to takeover political discourse for illiberal ends.
However, Frank Cohen (Reference Cohen1997) explains that the presence of ethnic parties reduces chances of conflict because they provide a legitimate voice for ethnic groups within the political system. In a more tempered claim, John Ishiyama posits that although ethnic parties can mobilize ethnic groups to protest, they do not have an independent effect on ethnic conflict (Ishiyama Reference Ishiyama2009). Rather, “the level of communal conflict was as high before the appearance of an ethnic party as it was after” (Ishiyama Reference Ishiyama2009, 78).
With regard to South Asian politics, Paul Brass (Reference Brass2003, 6) posits that religious riots benefit certain political parties in terms of organizational cohesion and electoral gains. Neil Devotta argues that outbidding by ethnic parties in Sri Lanka, facilitated by the decay of democratic institutions, exacerbated inter-ethnic competition between minority Tamils and the majority Sinhalese that ultimately led to civil war (Devotta Reference DeVotta2005). Ashutosh Varshney and Steven Wilkinson (Reference Varshney and Wilkinson2002) created their own dataset on religious riots because Indian official data were unreliable due to many political parties and organizations being implicated in such riots.
Wilkinson (Reference Wilkinson2004, 138) showed that higher electoral competition in India can lower the likelihood of riots because political parties need to appeal to minority voters. Because minority voters become more important in deciding elections when electoral competition increases, Wilkinson's argument also implies that ethnic parties contribute to increased riots if minority votes are not critical to winning elections.
On the contrary, Kanchan Chandra (Reference Chandra2005) argues that under certain conditions ethnic parties can strengthen democratic practices in a society. Specifically, if ethnic parties compete on multiple dimensions as opposed to the single dimension of identity, they can help sustain democracy. The presence of multiple dimensions of competition is in turn contingent on the fluidity of ethnic identity, differences within ethnic groups, party systems that divide ethnic groups, and institutions and electoral rules that compel alliances between ethnic parties.
Despite their above-mentioned differences, the broader research and its regional counterpart assume that changes in the presence of ethnic parties affect ethnic/communal violence. A core cause for their divergent views about the influence of the number of ethnic parties on violence is their dissimilar assumptions about whether ethnic parties exist in stable or unstable party systems.
However, the debate over the relationship between effective number of parties and religious riots ignores the fact that regions with higher levels of electoral volatility tend to experience riots. Because electoral volatility is the shift in vote share between political parties over elections (Pedersen Reference Pedersen1979), and therefore the extent of change in voting behavior of people, this may explain the puzzle of whether the number of parties increase or decrease communal violence.
Studies of Western Europe have shown that “ethno-linguistic diversity has reduced electoral volatility” (Bartolini and Mair Reference Bartolini and Mair1990). On the contrary, Raul Madrid's study of indigenous parties in Latin America shows that the process of the emergence of ethnic parties along social cleavages have increased electoral volatility in the short term as voters shift their loyalties from old parties to new and emerging ones (Madrid Reference Madrid2005). Nevertheless, even this study indicates that over time party systems will stabilize, and electoral volatility will decrease as each ethnic/indigenous group finds representation in the new parties.
With regard to South Asia, research on Sri Lanka has studied the effects of electoral volatility on violence, albeit in an indirect fashion, by arguing that the presence of ethnic groups provides a stable base upon which power sharing can occur (Birnir Reference Birnir2006). In other words, religion stabilizes voter preferences thereby reducing electoral volatility and violence. Consequently, only when factors exogenous to the electoral system—such as leaders of opposed groups polarizing the electorate and encouraging the repression of other groups—become prominent, does violence become imminent (Birnir Reference Birnir2006, 161).
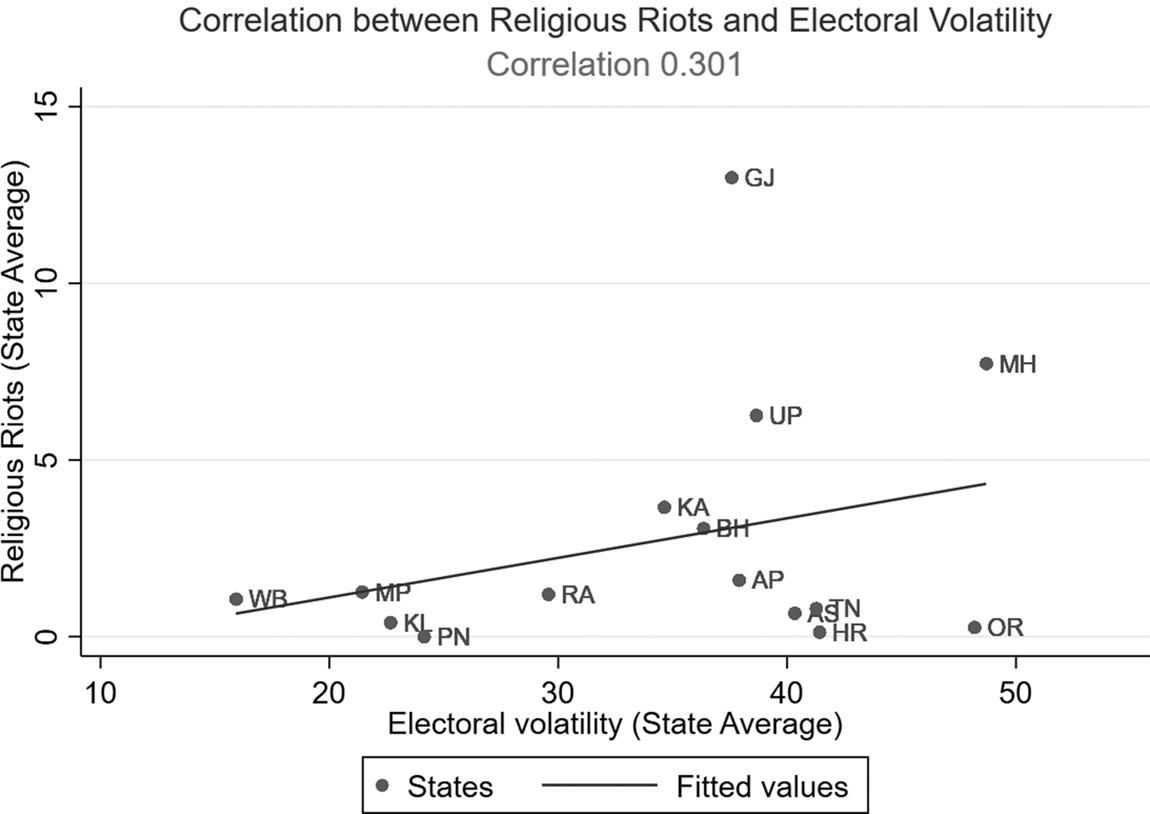
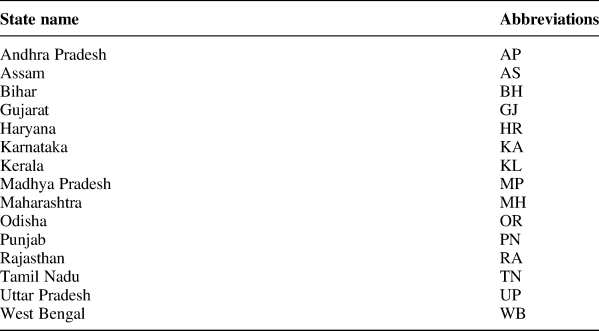
Figure 1 shows the association between electoral volatility and religious riots in India (Table A2 shows the full-form of the state abbreviations in Figures 1 and 2). The figure shows how the average electoral volatility at the state level corresponds to the average religious riots in the state for the time period of 1981–1995. Specifically, although there are states that have recorded high average electoral volatility with low average riots, all states with higher average riots also record higher average electoral volatility. Notably, in states such as Uttar Pradesh, which feature high levels of electoral volatility and religious riots, political parties have successfully mobilized support based on Hindu and Muslim identities. The Samajwadi Party (SP) relies on the Muslim vote (along with the Yadav caste vote) to win elections whereas the Bharatiya Janata Party (BJP) relies on upper caste Hindu voters to win elections. Moreover, Uttar Pradesh's political landscape has been far more volatile with different parties, regional and national, making dramatic gains and suffering dramatic losses from one election to the next.
Correlation between religious riots and electoral volatility (state averages).

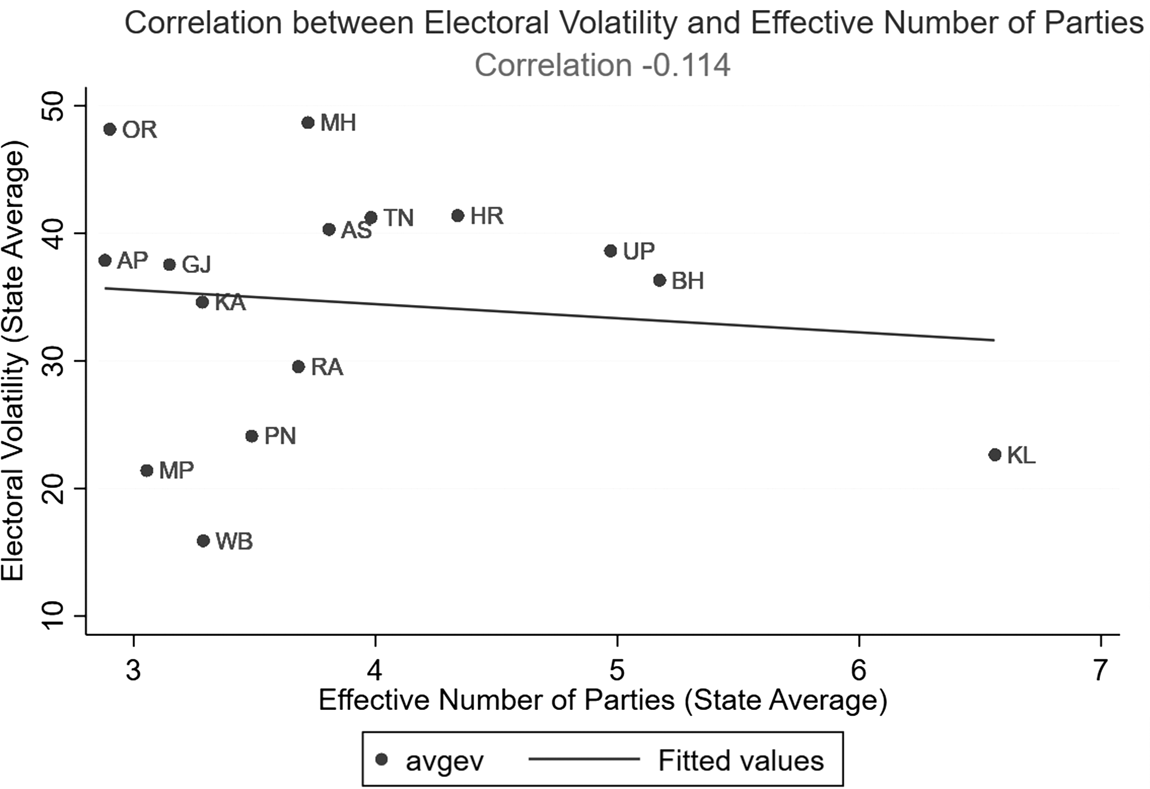
Association between electoral volatility and effective number of parties.

The state's volatility in election outcomes produces the ground for religious polarization as different political parties see the dramatically shifting voter loyalties as a positive signal to their communal ideology. Between the years 1981 and 1995, the BJP, known for its Hindu nationalist ideology, made major gains in their vote share in Uttar Pradesh. SP, since 1993, has come to be known for consolidation of the Muslim vote share.
By contrast, Madhya Pradesh, a neighboring state of Uttar Pradesh, has a much lower electoral volatility and lower levels of religious riots. The party system has largely been stable with the BJP and the Indian National Congress as the dominant political parties since 1980. Although the rise of the BJP from the early 1980s has been phenomenal, the fortunes of the BJP and other political parties has not changed as dramatically in Madhya Pradesh as they have in Uttar Pradesh.
Therefore, we study the relationship between electoral volatility and religious riots by controlling for several other factors, such as effective number of parties, upcoming elections, and other socioeconomic indicators. We suggest that electoral volatility indicates a democratic system is in transition wherein the relevant political actors are settling down and so are the voters in terms of their loyalties. Thus, if lower electoral volatility assures a stable system that ensures political representation for different ethnic groups, higher levels of electoral volatility would increase inter-group tensions as political parties compete for voters and can exploit social cleavages like religion to secure such votes, thereby increasing the likelihood of violence. Our research hypothesis may be distilled as: increase in electoral volatility leads to an increase in the likelihood of religious riots.
DATA AND METHODS
A significant body of research on religious violence in India uses historical case studies and ethnographic research. For example, Paul Brass (Reference Brass2003) evaluates riots in one north-Indian city of Aligarh over distinct time periods to reveal how leaders, political parties, and allied social organizations foment riots for electoral gains (Brass Reference Brass2003). Dhattiwala and Biggs (Reference Dhattiwala and Biggs2012) analyze media reports in the western Indian state of Gujarat to show how the BJP uses religious riots to garner votes in close elections, instead of ones where its victory or defeat are assured. Such research provides valuable context and highlights causal connections between political actors, voters, and violence, however, their findings may not be generalizable across Indian states because of their ethnic, linguistic, and historical-institutional variations.
Our statistical analysis, consequently, uses the Varshney–Wilkinson dataset that provides data on religious riots between Hindus and Muslims across 15 Indian states from 1981 to 1995. The unit of analysis is state-years. Others have analyzed religious riots at the district level to study incumbency effects of political parties (Nellis, Weaver, and Rosenzweig Reference Nellis, Weaver and Rosenzweig2014). We seek to understand religious riots, however, at the state level, akin to Iyer and Shrivastava (Reference Iyer and Srivastava2018) and Bohlken and Sergenti (Reference Bohlken and Sergenti2010), largely given that data on our control variables are available at the state level and because sticking to the state level maintains consistency. The Varshney–Wilkinson dataset, moreover, does not rely on government figures because the government in many cases has been implicated in communal violence. Furthermore, in many instances the data on riots are either kept secret or their publication delayed due to fears of the effects of such “inflammatory information.”
Although the Government of India's Home Ministry data have been available, scholars have pointed out that they are problematic. As Steven Wilkinson notes in his book, “The problem however is that published Home Ministry statistics give the annual level of Hindu-Muslim violence not as the number of large riots(the phenomenon most people want to explain), but as a much larger figure, the total number of times the police have registered a criminal case of ‘riot’” (Wilkinson Reference Wilkinson2004, 243–44). Given such problems, the Varshney–Wilkinson dataset provides a viable alternative to using government figures.
The decision of restricting the analysis from 1981 to 1995 is driven by both theoretical salience and empirical concerns. In terms of theory, 1981–1995 were critical because they witnessed the demise of India's dominant party system under the Congress Party in 1989 and the emergence of a coalition party system with two major parties Congress and BJP, and a third coalition of regional parties (Nikolenyi Reference Nikolenyi1998). Recent analysis considers that this period ended because of the BJP's consecutive general election victories in 2014 and 2019 with single party parliamentary majorities (Vaishnav and Hintson Reference Vaishnav and Hintson2019). Consequently, the period of collapse of one party dominance and the beginning of the coalition era is key to understand why the BJP emerged as a national alternative: becoming the first non-Congress party to complete a full term in office (1998–2004) under the Prime Ministership of Atal Bihari Vaypayee.
The empirical restrictions also center on the robustness of the findings. Specifically, given the problems regarding data availability on economic variables, restricting the scope is necessary to ensure that the electoral variables are being sufficiently tested in the presence of important alternative explanations such as economic growth rate of states, GDP per capita, and GINI (inequality). Not including critical economic variables would also create greater concerns over the robustness of the findings. Others have followed the same approach in their published studies (Mitra and Ray Reference Mitra and Ray2014, 734; Bohlken and Sergenti Reference Bohlken and Sergenti2010, 593).
Due to the above-mentioned reasons, we start off our analysis by presenting the results on the association between electoral volatility and riots since independence, although with fewer control variables. We then move to our main empirical section where we consider the time frame from 1981 to 1995 which includes the full set of theoretically relevant control variables.
Given our data structure, standard ordinary least squares (OLS) estimates are not as efficient as pooled time-series cross-sectional models and tend to violate the assumptions of homoskedasticity and uncorrelated standard errors. Therefore, we estimate OLS with panel-corrected standard errors (Beck and Katz Reference Beck and Katz1995). We also look at the medium-term association between our explanatory variables and riots at time: t + 1, t + 2, and t + 3 years. As robustness checks, we also utilize survival analysis to examine the probability of riot onset and fatal riot onset. We use the Cox proportional hazard models to assess how electoral volatility is associated with outbreak of riots and outbreak of fatal riots.
Dependent Variable
The paper uses the Varshney–Wilkinson dataset as the primary source for instances of religious riots—which is the dependent variable. We also use riot outbreak and fatal riot as binary variables as our “failure event” in our survival analysis as a robustness check.
Explanatory Variables
Electoral volatility is the principal independent variable that this paper seeks to introduce to the scholarship which explains outbreak of religious riots. Electoral volatility is used as a measure of party system change by which we mean “the net change within the electoral party system resulting from individual vote transfers” (Pedersen Reference Pedersen1979). Electoral volatility is calculated by using the formula: Volatility (Vt) = ½ × TNC. Here, TNC stands for total net change in vote share between two elections, and Vt stands for the “cumulative gains for all winning parties in the party system.”
Traditionally scholars have relied on effective number of parties to assess the relative strength of the parties (Laakso and Taagepera Reference Laakso and Taagepera1979). Electoral volatility “tells us to what extent party strength is being reallocated from one election to the next between losing and winning parties” (Pedersen Reference Pedersen1979). Therefore, the two variables, electoral volatility and effective number of parties, measure two different processes in the party system. ENP looks at the relative party strength, whereas electoral volatility looks at how party strength is being reallocated from one election to the next, making it an appropriate variable for our analysis. Figure 2 shows that ENP and electoral volatility vary across states and do not measure the same electoral phenomenon. Figure 2 shows the average electoral volatility and average ENP of states. For example, Gujarat, Karnataka, Madhya Pradesh, and West Bengal have similar ENP scores, but vary widely on electoral volatility scores. Conversely, Punjab and Kerala, and Gujarat and Uttar Pradesh have similar electoral volatility scores, but vary widely on ENP scores. The data on vote share in state assembly elections are gathered from the website of the Indian Election Commission.
“Control” Variables
The study controls for theoretically relevant factors that can affect the likelihood of communal violence. Effective number of parties (ENP) is widely used to measure electoral competition. ENP is calculated by using the formula: ENP = 1/∑V 2. Here, we divide the square of the sum of all parties' vote share (V 2) in an election by 1 (Laakso and Taagepera Reference Laakso and Taagepera1979). The data on vote share of each party are taken from the website of the Indian Election Commission. “The index is a measure of the level of concentration in political life which assigns more influence to large parties and screens out very small parties in its computation” (Dunleavy and Boucek Reference Dunleavy and Boucek2003). Therefore, although electoral volatility shows the percentage change in vote share of different parties across elections, the effective number of parties shows how many parties are relevant or viable in a political system.
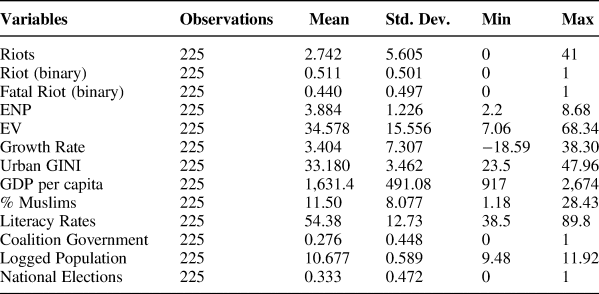
The paper “controls” for other theoretically important variables. They broadly fall under economic and sociological factors. The states' economic growth, GDP per capita, and urban GINI are economic indicators that are included. Sociological factors such as percentage of Muslims in states, population size, and literacy rates are also included (Bohlken and Sergenti Reference Bohlken and Sergenti2010). Scholars such as Wilkinson have argued that states with lower literacy rates may see higher levels of violence as it might be easier to mobilize people against another community based on grievances. Furthermore, people with lower literacy rates also tend to have lower income per capita. As Varshney (Reference Varshney2002, 20) argues, literacy rates can be used as a proxy for poverty levels and social marginalization or subalternity at the state level. Since data on variables such as literacy rates, percentage of Muslims, and GDP per capita are collected once every 10 years in the census, they are time-invariant (Bohlken and Sergenti Reference Bohlken and Sergenti2010).Footnote 1 Table 1 shows the variables used for our analysis.
Other controls include whether national elections were held in a given year, which may also highlight riots to be associated with not just state level factors but also national politics. This information is available from Indian Election Commission's website. Logged population is included to account for states' population size as riots maybe a function of more people living in a particular state (Bohlken and Sergenti Reference Bohlken and Sergenti2010).
Descriptive statistics

RESULTS
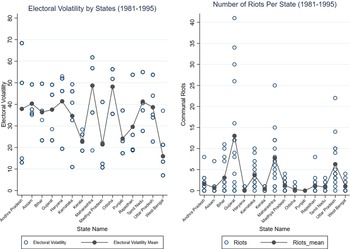
Before presenting the results from our analyses, we present some of the descriptive aspects of our data. Figure 3 has two elements that help to identify the potential effects of any outliers and whether they may be driving our results. The first element of Figure 3 shows that there is no outlier in terms of electoral volatility: with all states having similar ranges. The only possible exception being Kerala, which has all its electoral volatility values close to its mean. The second element of Figure 3 shows the spread of religious riots and its average. The graph shows that there are some states that have outlier cases, notably Gujarat, Maharashtra, Uttar Pradesh, Bihar, and West Bengal. But three states out of these have major outliers: Gujarat, Maharashtra, and Uttar Pradesh. Other states such as Andhra Pradesh, Rajasthan, Orissa, Tamil Nadu, Karnataka, Assam, and Madhya Pradesh are well represented in these cases.
Spread of religious riots and electoral volatility by state.

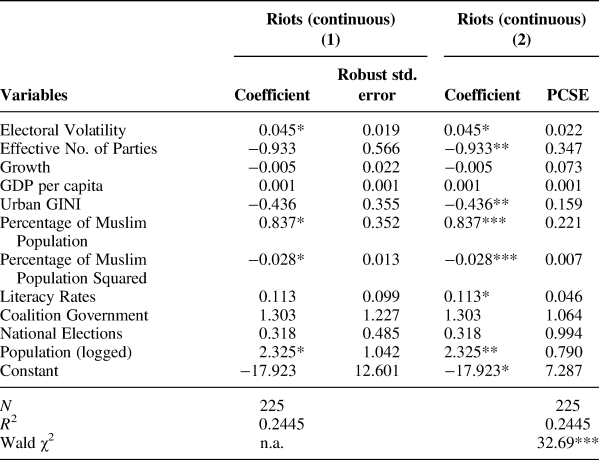
In general, the results in Table 2 suggest that electoral volatility is important in explaining communal violence. Model 1 shows our baseline OLS regression with robust standard errors clustered by state id. Electoral volatility is statistically significant and has a positive association with religious riots. Model 2 includes the panel-corrected standard errors as per Beck and Katz (Reference Beck and Katz1995) recommendations. Model 2 also shows that electoral volatility has a statistically significant association with religious riots. Additionally, it also shows a statistically significant association between effective number of parties and religious riots. Other variables such as urban inequality (GINI), percentage of Muslims in states, literacy rates, and logged population of states also have a statistically significant relationship with religious riots.
OLS and panel-corrected standard errors model (DV = religious riots)

Note: Robust standard errors clustered by state id.
+p < 0.10; *p < 0.05; **p < 0.01; ***p < 0.001.
The results also show that economic variables do not perform as well when important electoral variables are included. As the proportion of Muslims in the state increases, so does the probability of Hindu–Muslim riots increase, which suggests that the Hindu–Muslim social cleavage is significant where Muslims form a sizable minority. Literacy rates are positively associated with the outbreak of riots. This makes sense when we see that religious riots are more prevalent in and around towns and relatively urbanized centers where the literacy rates are higher than in rural areas. Generally speaking, the political and demographic variables come out to be far more relevant in explaining religious riots than economic variables. Urban inequality (GINI) is negatively associated with religious riots suggesting that rising inequality per say is not a strong predictor for riots onset.
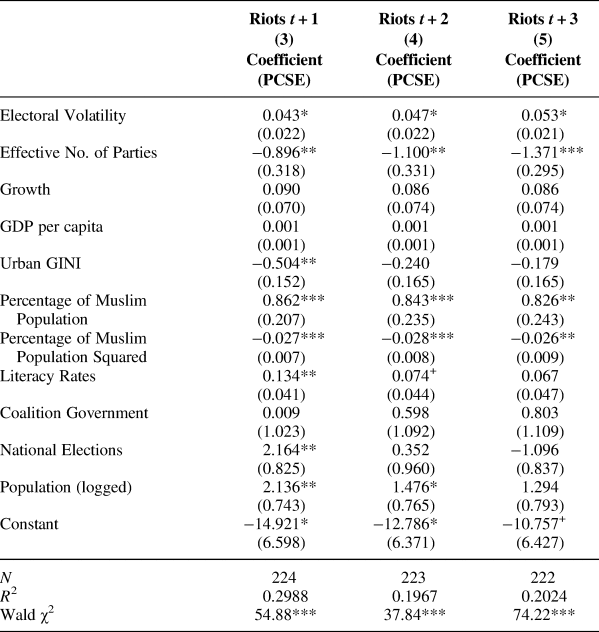
Table 3 seeks to explore the effects of electoral volatility at time t on the outbreak of religious riots at time t + 1, t + 2, and t + 3 years. Electoral volatility shows a positive, sustained, and a statistically significant association with future values of religious riots as well. Given that electoral volatility figures are generated in an election year, its association with religious riots at time t + 1, t + 2, and t + 3 years are indicative of a strong and robust relationship between electoral volatility and religious riots. Moreover, the magnitude of the effect of electoral volatility increases at time t + 1, t + 2, and t + 3 years.
Panel-corrected standard errors (DV = religious riots) 1981–1995

+p < 0.10; *p < 0.05; **p < 0.01; ***p < 0.001.
Electoral volatility and effective number of parties have opposite effects on religious riots. Electoral volatility is significant at the <0.05 level. Effective number of parties is statistically significant at the <0.05 level as well. The differing association that the two variables have with religious riots suggests that they both represent different aspects of ethnic outbidding. As noted earlier, there has been a discussion on whether democratization can increase the likelihood of ethnic violence as elites seek to consolidate their position (Snyder Reference Snyder2000, 19). Horowitz (Reference Horowitz1985) on the other hand says ethnic parties can be a source of stability as the boundaries of the ethnic party ends at the boundary of the ethnic group and it is not rational for ethnic parties to expect voters of a different ethnicity to vote for them. Wilkinson (Reference Wilkinson2004) seems to take a cue from their work and argue that greater the ENP the more likely the minority vote matters, making conflict less likely.
Those who argue that democratization can be a source of increasing religious riots may be observing the relationship between electoral volatility and religious riots. Given that higher electoral volatility is a function of a changing party system, it is possible that the changes in the party system indicated by electoral volatility contribute to an increase in the likelihood of religious riots rather than the parties themselves. Moreover, the political parties in and of themselves may not be stoking violence once the voters have realigned and found their new loyalties.
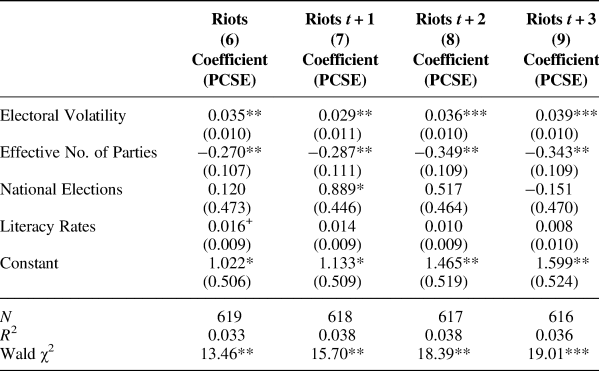
Table 4 shows the results from our panel-corrected standard error models for religious riots from 1950 to 1995. Although we are limited by reliable data availability on some of our control variables for the time period between 1950 and 1980, we are able to demonstrate that the statistically significant association between electoral volatility and religious riots was not contingent on the timeframe, although the magnitude of the association is slightly lower for the full timeframe (1950–1995) than for the truncated timeframe (1981–1995).
Hindu–Muslim riots: 1950–1995

+p < 0.10; *p < 0.05; **p < 0.01; ***p < 0.001.
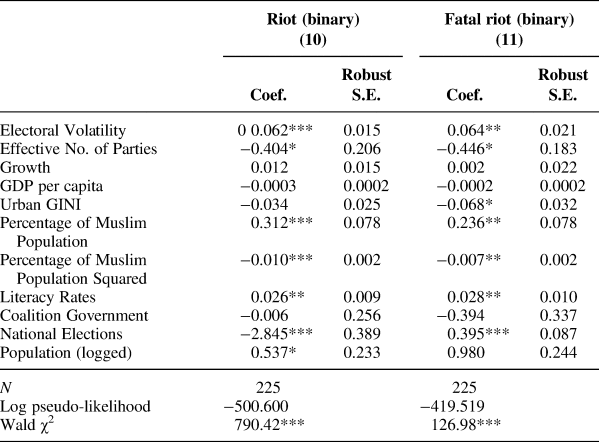
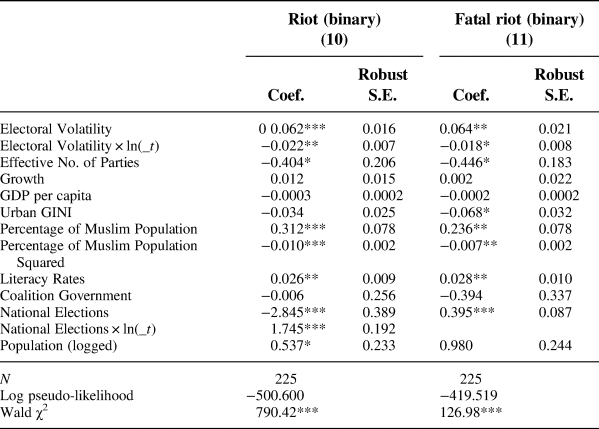
As a way of conducting robustness checks, we utilize survival models to assess the effect of electoral volatility on the probability of riot onset and the probability of riots with fatalities. The results from the survival models in Table 5 remain consistent with the results presented in previous tables, although the magnitude increases. Moreover, the magnitude of coefficient for fatal riot is higher than for the outbreak of a riot in general. To correct for violations of the proportional hazards assumption, we implement the adjustments prescribed by Allison (Reference Allison2014, 44–45), where we interact the electoral volatility variable and national election variable in model 10, and the electoral volatility variable in model 11 (which is violating the proportional hazards assumption) with time to get more definitive estimates of these variables.Footnote 2
Cox proportional hazard model

Notes: The prescribed adjustments were made to correct for violations of the proportional hazard assumptions (Allison Reference Allison2014; Ruhe Reference Ruhe2016). Robust standard errors clustered by state id.
+p < 0.10; *p < 0.05; **p < 0.01; ***p < 0.001.
Anecdotal evidence on electoral competition in India suggests that party system change plays a critical role in explaining religious riots. For example, the state-level assembly elections of 1989 in India's largest states Uttar Pradesh (UP) witnessed major electoral changes of one of India's biggest political parties, the Indian National Congress or Congress (INC). The INC lost a significant number of seats compared to the 1985 assembly elections: dropping from 269 seats in 1985 to 94 in 1989. The Janata Dal led by its state-level leader Mulayam Singh Yadav emerged as the state's biggest party with 208 seats. The Hindu nationalist BJP also made major gain: from 16 seats in 1985 to 57 in 1989. This may have set the stage for the 22 religious riots that occurred in 1990 (Varshney and Wilkinson Reference Varshney and Wilkinson2002), an unusually high number, because the Janata Dal relied on Muslims for electoral support, while the BJP relied on middle-class Hindus.
Similarly, the state-level election results of 1991 in UP were equally dramatic, with the Hindu nationalist BJP winning 221 seats, its highest seat total until then, as compared to 57 seats in 1989. The Congress Party's seats declined from 94 in 1989 to 46 in 1991. However, the biggest loser was the Janata Dal that came down from 208 in 1989 to 92 in 1991.Footnote 3 Between 1991 and 1992, UP witnessed 19 instances of communal rioting (Varshney and Wilkinson Reference Varshney and Wilkinson2002). These events reached a climax with the destruction of the more than 400-year-old Babri Mosque in December 1992 by Hindu sympathizers and members of the BJP. The dramatic changes in seats won by the political parties, which indicates high levels of electoral volatility, thus appears to correspond with increased religious riots.
CONCLUSION
Scholars provide different explanations for why religious riots between Hindus and Muslims are endemic in some areas in India and not in others. Different explanations for regional variance in the occurrence of Hindu-Muslim riots in India center on a debate about whether ethnic parties are a source of political stability or violence (Varshney Reference Varshney2002; Brass Reference Brass2003; Engineer Reference Engineer1991; Wilkinson Reference Wilkinson2004; Iyer and Srivastava Reference Iyer and Srivastava2018). Despite their differences, there is a consensus among scholars that electoral politics and religious riots are deeply associated. Thus, existing research on ethnic outbidding only identifies effective number of parties in a party system to ascertain the level of such riots.
This paper shows that the rise of religious riots is explained by electoral volatility—the instability in the party system—which reveals the net change in the vote share of political parties over elections. Thus, areas with high electoral volatility have higher incidences of religious riots, while higher effective number of parties is associated with lower number of these riots. Thus, our findings imply that the stability of the party system may be as important as the effective number of parties in order to ascertain the levels of religious riots.
Whereas our findings complement research on ethnic outbidding, the findings also indicate that the process of outbidding based on religion is strongest when party system change is high. Thus, implying that it is the transitory period of instability in the electoral system, when voter loyalties are shifting between different parties that create ripe conditions for the outbreak of violence because political parties want to polarize voters in order to secure as many votes as possible.
With regard to political competition in India, our findings indicate that we should see an increased probability of religious riots if electoral volatility increases even if the effective number of parties remains constant. Consequently, if India appears to be entering a fourth party system centered on the BJP as the dominant party (Vaishnav and Hintson Reference Vaishnav and Hintson2019), although the effective number of parties might decrease and ultimately stabilize, we can continue to expect religious riots based on variations in voting behavior that shift votes between two or three parties.
For future research, we would like to extend the time-span of our study both forward and backward in time. While the Varshney-Wilkinson dataset covers the time period from 1951–1995, we lack information on some of the crucial control variables such as data on economic growth and GINI coefficient and GDP per capita for the first few decades after Indian independence. Our analysis of data from 1951–1995 using electoral volatility, effective number of parties, year of general and state elections and literacy rates also suggest a robust relationship between electoral volatility and outbreak of religious riots. However, we will have to spend time collecting the data on the theoretically relevant control variables to see whether electoral volatility continues to have a strong association with outbreak of riots even for the pre-1980 period.
We would also like to extend our study to the post 1995 period to specifically see how the emergence of the BJP as the largest political party in India, especially post 2014 changed the probability of religious riots. If the electoral volatility has marginally changed from 2014 onward, then we do not anticipate observing religious riots with the same frequency as observed between 1980 and 1995. Unlike the 1990s in India, such a study would also have to account for the effects of social media: specifically, voters' use of different platforms like Facebook, WhatsApp, and Twitter, as well as political parties' social media strategies for each election.
Our models in Table 4 show that Electoral Volatility has a robust positive association with Communal Riots spanning the period from 1950 to 1995. Although these results are contingent on data availability of other control variables, they do point to the importance of Electoral Volatility for the pre-1980 period. Given that the coalition era began in 1989 and the first single-party government was formed in 2014, we expect similar findings for that period, too. However, these results may not hold after 2014, although the period between 1981 and 1989 were also characterized by single-party national governments. Also, many Indian states are controlled by parties that are not the incumbent national one. This is a different scenario than the dominant party system in the 1950s–1960s. Thus, the effects of state-level electoral volatility may remain the same.
Finally, our research has implications for conflict dynamics in other democratizing societies. Specifically, although conflict dynamics in African countries have their own peculiarities, the relationship between ethnic identity and electoral volatility has been established in African democracies (Feree Reference Feree2010). Moreover, the effects of electoral volatility on political instability may depend on the interactions of electoral institutions with inter-ethnic and intra-ethnic group cleavages (Mozaffar, Scarritt, and Galaich Reference Mozaffar, Scarritt and Galaich2019).
Appendix A
Cox proportional hazard models with adjustments for proportional hazard assumptions

State names and abbreviations