Implications
Greenhouse gas (GHG) emissions from milk production consist mainly of CH4 from feed digestion and N2O from cultivation of feed (including manure). The total effect of all emitted GHG can be expressed as CO2 equivalents per unit of produced milk, that is, the carbon footprint (CF) of milk. This study showed a minimum variation of ±17% in the national CF of milk caused only by differences in seven chosen management parameters between Swedish dairy farms. This indicates that milk CF can be decreased if dairy farms with high CF can apply methods and techniques used on farms with lower CF.
Introduction
World dairy production is estimated today to contribute 3% (±26%) of total anthropogenic greenhouse gas (GHG) emissions, or 4% when dairy-related meat production (i.e. culled and fattening animals from dairy production) is included (Gerber et al., Reference Gerber, Vellinga, Opio, Henderson and Steinfeld2010). To devise and develop strategies to reduce GHG emissions from the milk production chain, all sources of emissions connected to the system need to be included in analyses. Life Cycle Assessment (LCA), an ISO standardised method, has been used in several studies of the environmental impact of milk production (de Vries and de Boer, Reference De Vries and de Boer2009). During recent years, this method has also been used in calculations of GHG emissions from a product's life cycle (British Standard Institute, 2008), that is, the product carbon footprint (CF). The CF of livestock products is commonly presented as a single average value at the national level or for a specific production system, for example, intensive, extensive, conventional or organic farming (de Vries and de Boer, Reference De Vries and de Boer2009).
The CF of agricultural products (e.g. milk) always includes a certain level of uncertainty, since emission estimates of the GHG N2O and CH4 are associated with large uncertainties due to the nature of the biological processes causing these emissions in the soil, the rumen and manure (Rypdal and Winiwarter, Reference Rypdal and Winiwarter2001). This is especially the case for N2O emissions from the soil, where the recommended emission factor (EF), according to the Intergovernmental Panel on Climate Change (IPCC) guidelines, is 0.01 kg N2O-N/kg applied N, with the uncertainty ranging between 0.003 and 0.3 kg N2O-N/kg applied N (IPCC, 2006a). Only a deeper knowledge of how to model the biological processes producing biogenic CH4 and N2O can reduce this type of uncertainty in CF estimates of agricultural products. There are also uncertainties in the CF of milk associated with the production data used in the calculations (e.g. average milk yield, fertiliser rate, feed intake, etc.), which are often collected as mean values from statistics or from farm inventories. These uncertainties in the production data are due to (i) inadequate official statistics and (ii) differences in management practices among farms resulting in variations in production data across farms. Precise values of important production parameters can be difficult to obtain at farm level, especially when estimating yields and consumption of silage and grazing. A deeper knowledge of uncertainties and variations in production data is important when analysing feasible strategies to decrease the CF of milk.
Uncertainty in estimates of milk CF caused by variations in production data has so far been analysed in combination with uncertainty due to the EF used for N2O and CH4 emissions. Basset-Mens et al. (Reference Basset-Mens, Kelliher, Ledgard and Cox2009) found that the standard deviation in the CF of milk in New Zealand was 38% of the mean value due to variations in feed intake and the N-fertiliser rate, as well as uncertainties in the EF used in the estimates of N2O from the soil, enteric CH4, leached NO3 and NH3 from manure and fertiliser. Other studies describe the influence of management practices on GHG emissions from dairy farms. For example, Gibbons et al. (Reference Gibbons, Ramsden and Blake2006) reported a wide range of total emissions at farm level in the United Kingdom (∼4200 to 16 400 kg CO2e/ha) and attributed such variation to different farm management methods. Estimates of milk CF in pastoral-based dairy systems in Ireland indicate that simple changes in management (e.g. pasture quality, N application rates and silage quality) can affect the total GHG emission estimates by 5% to 6% at both the farm and national levels (Lovett et al., Reference Lovett, Shalloo, Dillon and O'Mara2008).
According to Flysjö et al. (2010), the production parameters with the largest impact on the average CF of milk in Sweden are milk yield (as it is the reference unit to all GHG emissions), feed dry matter intake (DMI), N in excreta, N-fertiliser rate and diesel fuel used. These parameters are affected by management, and thus by the dairy farmers’ decisions, and are therefore an important area of study in seeking mitigation strategies to reduce milk CF in similar production systems. In this context, uncertainties in the EF used to estimate the N2O and CH4 emissions are the same irrespective of the farmers’ decisions, and cannot be controlled or changed by the individual farmer at present. Our starting hypothesis was that variation in production data (e.g. management methods) among farms leads to significant differences in milk CF between farms. The novel aspects of this study are that we (i) analysed how different management practices affect the uncertainty in the national average CF of milk from a high-yielding production system with intensive use of concentrate feed and housed animals by (ii) using large existing data sets of production data for dairy farms instead of using data from farm inventories (Cederberg and Flysjö, Reference Cederberg and Flysjö2004; Thomassen et al., Reference Thomassen, van Calker, Smits, Iepema and de Boer2008) or surveys (Winsten et al., Reference Winsten, Kerchner, Richardson, Lichau and Hyman2010). Farm inventories are commonly used in CF estimates and have the advantage of uniformly collected data but the disadvantage of relatively small samples. The advantage with surveys is that they can provide large data sets, but the disadvantage is the higher risk of inconsistency in the data.
The main objectives of this study were to analyse the variation in important production data among Swedish dairy farms and to investigate the impact of these variations on the national average CF of milk, using Monte Carlo (MC) analysis. The latter calculates the probable variation in milk CF instead of a 1-point estimate of the average CF of Swedish milk. The overall aim was to gain further knowledge of how improvements in management practices can reduce GHG emissions from dairy farms. We examined the following questions:
1. What variations exist in the most important production parameters used in CF estimates between Swedish dairy farms?
2. How much do milk CF estimates vary between Swedish dairy farms as a result of variations in the most important production parameters?
The study also examined the most crucial production factors in terms of the potential of reducing milk CF at farm level on the basis of current practices on Swedish dairy farms.
Material and methods
Data acquisition
Swedish average production data
The production data used in this study to represent average Swedish milk were taken from national GHG estimates in 2005 presented by Cederberg et al. (Reference Cederberg, Sonesson, Henriksson, Sund and Davis2009). The data, which were derived from national accounts and statistics with complementary data from advisory services, research reports and agricultural businesses, were used when calculating the average milk CF that constituted the basis for our variation analysis of CF. During the study year (2005), approximately 393 000 cows in Sweden produced 3 250 000 ton energy-corrected milk (ECM), of which 5% were organically produced. Cows in Sweden are mainly kept indoors, in tied stalls or loose housing systems, and are milked all year around, with a mean lactation period of 305 days. The replacement rate is approximately 38%, and heifers start milking at an average age of 28 months. The average cow weight is 600 kg. The diet consists of approximately equal shares of roughage and concentrate, with the latter consisting of half-grain and half-protein feed (mostly rapeseed meal, soya cake meal and by-products from the cereal and sugar industries). The roughage mainly consists of grass or grass/clover silage produced on the farm. Maize silage and by-products from the sugar beet industry may also be used in southern Sweden. The cows’ feed intake from grazing is relatively low, an estimated <10% of total DMI on average. The grain in the feed is mainly cultivated on the dairy farm, whereas the protein feed is supplied by the feed industry. Of the manure management systems, approximately 70% are based on slurry and 30% on solid manure, and for heifers also some deep litter. The manure is mainly used on the farm or on neighbouring farms if extra field spreading acreage is needed.
Variations in production data
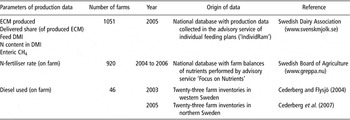
The farm production parameters considered in this study were ‘milk yield’ (ECM produced and delivered), ‘feed DMI’, ‘enteric CH4 emissions’, ‘N content in DMI’, ‘N-fertiliser rate’ and ‘diesel on farm’ (defined further in the section ‘Calculating variations in production data’), since these are reported to have the greatest impact on the estimated CF of Swedish milk (Flysjö et al., 2010). To determine how these production parameters vary between dairy farms, the required data were collected from three different sources (Table 1).
Sources of data used to determine variations in chosen production parameters on dairy farms

ECM = energy-corrected milk; DMI = dry matter intake.
Animal production data were obtained from the Swedish Dairy Association (SDA) and originated from the feed advisory service ‘IndividRam’ (www.svenskmjolk.se). This advisory service includes individual feeding regimes, which are followed up monthly during visits by feed advisors to individual farms. The system involves continuous recording of production data such as milk yield (derived from the national recording programme), feed DMI and feed quality in a management software program. These production parameters and costs are compiled in a national database from which SDA derives statistics when investigating dairy farm profitability. The data set used in our study comprised 1051 dairy farms for the year 2005. Milk production on these farms, which represented approximately 12% of all dairy farms in Sweden, corresponded to 12% of total national milk production. The production data obtained included dairy cows but not replacement animals.
Data on N-fertiliser rates used on dairy farms were obtained from a large national database of farm-gate nutrient balances created by the National Advisory Project ‘Focus on Nutrients’ carried out by the Swedish Board of Agriculture since 2000 (Jordbruksverket, 2008). The nutrient balances are drawn up by advisors during individual farm visits. The data set used in this study comprised 920 conventional dairy farms during the period 2004 to 2006.
Official statistics on diesel use at dairy farms were not available, and therefore data were taken instead from two earlier LCA studies (Cederberg and Flysjö, Reference Cederberg and Flysjö2004; Cederberg et al., Reference Cederberg, Flysjö and Ericson2007). Those studies were based on farm inventories from a total of 46 dairy farms in western and northern Sweden.
Methodology
Estimating average CF
The average CF of Swedish milk was estimated according to Flysjö et al. (2010) using a standardised method of LCA (ISO, 2006a and 2006b) for calculating the environmental impact of a product in a life-cycle perspective. All calculations were carried out using the LCA software tool SimaPro 7 (PRé Consultants bv., 2010). The GHG emissions were expressed as global warming potential in a 100-year time horizon according to IPCC (2007), defined as CO2 equivalents (CO2e); 1 kg CO2 = 1 kg CO2e, 1 kg CH4 = 25 kg CO2e and 1 kg N2O = 298 kg CO2e.
The functional unit (FU) used as the reference unit for all flows within the system studied was 1 kg ECM at the farm gate, including all by-products, surplus calves and meat from culled cows. Since the aim of this study was to analyse the variations and uncertainties in CF as a consequence of farm management methods, there was no need to allocate emissions between milk and meat.
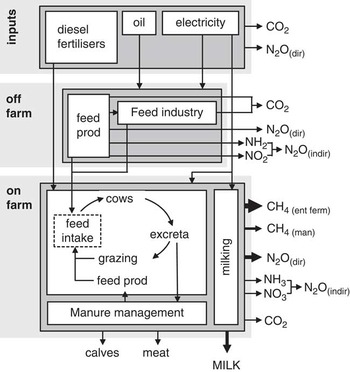
The system boundary was ‘cradle-to-farm gate’. A schematic overview of the production system is shown in Figure 1. All major emissions of CH4, N2O and CO2 associated with production of input products and processes used in dairy farm production were accounted for, from the extraction and refinement of raw materials until the milk was delivered from the farm. Some minor emissions (contributing <1% of the total emissions) were omitted, for example, emissions from the production of pesticides, detergents and medicines. Farm land is related to feed DMI as the average yield per hectare for each feed crop used (i.e. the estimated average crop yields for total feed cultivation in Sweden 2005 (Cederberg et al., Reference Cederberg, Sonesson, Henriksson, Sund and Davis2009)). Emissions associated with the construction of agricultural buildings and machinery were not included. Capital goods for transport and energy (e.g. car manufacture, power plant construction) were considered, since these are included in existing databases. GHG emissions associated with changes in land use were not considered.
Schematic overview of the milk production system from ‘cradle-to-farm gate” in Sweden.

Emissions of enteric CH4 were calculated using the national model (Lindgren, Reference Lindgren1980; Bertilsson, Reference Bertilsson2001), which is also used in the national inventory report for Sweden. Input data in this model are: animal live body weight (to estimate the energy required for maintenance), milk yield (to estimate the energy required for production), lactation period, energy content in feed intake and proportions of roughage feed and crude protein in total DMI. For the average Swedish dairy cow producing 8843 kg ECM/year in 2005, the annual emissions were estimated to be 127 kg CH4. For heifers, an estimated average value for CH4 emissions of 53 kg CH4/head per year was used (Cederberg et al., Reference Cederberg, Sonesson, Henriksson, Sund and Davis2009).
CH4 emissions from stored manure and excreta deposited on the field during grazing were calculated according to the IPCC guidelines (IPCC, 2006b). The emission factors and CH4 conversion factors (MCFs) used were those proposed by IPCC, except the MCF for slurry, where we used the value of 4% suggested in Swedish national studies (Rodhe et al., Reference Rodhe, Ascue, Tersmeden, Ringmar and Nordberg2008). Production of manure was calculated on the basis of DMI with 70% digestibility.
Direct emissions of N2O from the soil and stored manure were estimated following the IPCC guidelines and EF values (IPCC, 2006a and 2006b). N applied to the soil as manure was calculated as N in excreta (on average 134 kg N/cow per year and 40 kg N/heifer per year) plus N in straw (for cows 2.5 and for heifers 1.0 kg N/head per year) and feed waste (5.7 kg N/cow per year, including both cows and heifers) minus N losses of NH3 and N2O in the house and storage. N in excreta was calculated as the total amount of N in feed DMI minus the amount of N in milk and animals (calves and growth).
Indirect emissions of N2O, that is emissions caused by volatilisation of NH3 and leaching of NO3, were estimated using EF values according to IPCC (2006a). Volatilised NH3 in the house, manure storage and at manure spreading was calculated using the national software program ‘Stank in Mind’ (version 1.17) developed by the Swedish Board of Agriculture (www.sjv.se) and used for calculating nutrient flows and losses on farms by farm advisory services (Linder, Reference Linder2001). The program uses national EF values for volatilisation of NH3 from manure (Karlsson and Rodhe, Reference Karlsson and Rodhe2002) and leaching of NO3 (Aronsson and Torstensson, Reference Aronsson and Torstensson2004). The average NH3 losses from manure handling in the dairy system were calculated to be 0.059 kg NH3-N/kg Nexcreted in the house, 0.0068 kg NH3-N/kg Nexcreted during storage and 0.219 kg NH3-N/kg Nexcreted when applied to fields (Cederberg et al., Reference Cederberg, Sonesson, Henriksson, Sund and Davis2009). Volatilised NH3 from excreta deposited on pasture and NH3 from NH4NO3 fertilisers were calculated with the EF values 0.08 kg NH3-N/kg Nexcreted and 0.02 kg NH3-N/kg N, respectively. Leached NO3 from feed production as an average for a loamy soil in western Sweden was estimated to be 28 to 30 kg NO3-N/ha per year for grass/clover leys and 37 kg NO3-N/ha per year for grain (Cederberg et al., Reference Cederberg, Sonesson, Henriksson, Sund and Davis2009). Autumn spreading of manure was assumed to give an additional 0.017 kg NO3-N/kg Nexcreted (Cederberg et al., Reference Cederberg, Sonesson, Henriksson, Sund and Davis2009).
Calculating variations in production data
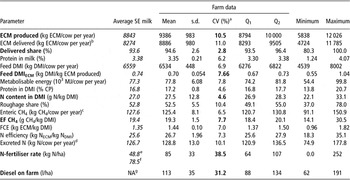
All animal production parameter data obtained from ‘IndividRam’ were given as total monthly values for each farm. Data for the parameters ‘ECM produced’ and ‘ECM delivered’ (see definition below), ‘protein in milk, ‘feed DMI’, ‘metabolisable energy’ and ‘protein in DMI’ were recalculated to an annual mean value per cow for each dairy farm. All mean values that included data for 8 to 12 months resulted in a data set of 1051 farms (226 farms with <8 months of data were excluded). Another eight parameters were calculated for each farm separately. ‘N content in DMI’ was calculated from the parameters ‘protein content in DMI’ and ‘feed DMI’, using a factor of 6.25 to convert protein to N. DMI in the advisory service is recorded either manually or directly by automatic feeding systems on farms. Protein content and other feed qualities in the feeding strategies are based on default values, lists of ingredients for purchased feed and farmers’ own feed analyses. The parameters ‘feed DMI’ and ‘ECM produced’ were used to calculate feed conversion efficiency (FCE; kg ECM produced/kg DMI; Beever and Doyle, Reference Beever and Doyle2007). In addition, another parameter on feed intake, ‘feed DMIECM’ (i.e. kg DMI/kg ECM produced), was calculated to relate feed DMI to milk yield. The parameter ‘roughage share’ (used in emission estimates of enteric fermentation) was calculated as the difference between total ‘feed DMI’ and intake of concentrate divided by total ‘feed DMI’. It is not specified in the data set whether grazing is included in total DMI, and according to feed advisors it may or may not be, but it is probably included for farms where grazing is a large part of the feed intake during summer. ‘Excreted N’ was calculated as the total amount of N in feed DMI minus the amount of N in milk and N in calves and growth (using an average value of 3.7 kg N/cow per year for calf and growth). ‘Enteric CH4 emissions’ were calculated for each farm according to the national model described above, using farm-specific parameters of milk yield, energy and protein content in feed DMI and share of roughage in feed DMI. The parameter ‘EF CH4’ is a farm-specific emission factor for CH4 that was calculated by dividing ‘enteric CH4 emissions’ by ‘feed DMI’ and used to combine parameters. Finally, the parameter ‘delivered share’ of ECM produced was calculated. In Sweden, milk yield is recorded and presented in two ways: (i) ECM produced (quantities and qualities are recorded monthly by the official milk recording programme) and (ii) ECM delivered (recorded by the dairy for each milk delivery). ‘ECM produced’ includes fresh milk fed to calves, as well as milk wasted due to infections and pharmaceuticals. This parameter is used when calculating enteric fermentation, N in excreta and feed efficiency. ‘ECM delivered’ is milk delivered to the dairy industry and this is the FU (reference basis) by which the GHG emissions are divided. Basic statistics were calculated on all these parameters to establish the variation between dairy farms: mean, s.d., CV, lower (Q1) and upper (Q2) quartiles, minimum and maximum values (Table 2).
Basic statistics on parameters for milk production (n = 1051), N-fertiliser rate (n = 920) and diesel use (n = 46) collected from Swedish dairy farms (average values for Swedish milk production the year 2005 are shown in italics)

Q1 = lower quartile; Q2 = upper quartile; ECM = energy corrected milk; DMI = dry matter intake; EF = emission factor; FCE = feed conversion efficiency; NA = not available.
Reference figures of mean values in the column ‘average SE milk” is from a study of carbon footprint of average Swedish milk (Flysjö et al., 2010). Parameters and figures marked in bold were varied in the Monte Carlo analysis.
aCV is the average variance of the mean value.
bECM delivered is ECM produced excluding fresh milk fed to calves and milk destroyed by infections and pharmaceuticals.
cCalculated with the method of Lindgren (Reference Lindgren1980).
dN in DMI minus N in milk produced, calf and gain in weight.
eIn cultivation of grass and grass/clover silage.
fIn cultivation of grain to feed.
gNo available data at the farm level per hectare in the study cited.
The parameter ‘N-fertiliser rate’ was given as a total for each farm divided by farm area to obtain kg N/ha, that is, an average value for all crops. There were no crop yields given in the database to correlate to the N-fertiliser rates, meaning that the variation in N-fertiliser rates can also be due to differences in crop yields. In the MC analysis, a fixed yield/ha for each crop is presumed (i.e. the average for feed cultivation in Sweden 2005). Regression analysis was carried out on the correlations between N-fertiliser rate and livestock density. The parameter ‘diesel on farm’ was given in l/ha for each farm. Basic statistics were calculated as described for animal parameters.
Connecting correlated parameters
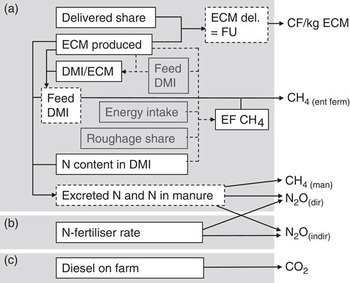
Since relatively strong correlations were found in the data set between parameters (e.g. R 2 > 0.5 for ‘ECM produced’ and ‘feed DMI’ as well as ‘ECM delivered’ and ‘N content in DMI’), these were connected to each other to avoid unrealistic combinations of data in the MC analysis (see Figure 2). To do this, we used ‘ECM produced’ as the key parameter (Figure 2) and multiplied it by ‘delivered share’ (of ECM produced) to give the FU (i.e. ‘ECM delivered’) to obtain the final CF. The parameter ‘feed DMI’ was obtained by multiplying the parameter ‘ECM produced’ by the parameter ‘feed DMIECM’ (kg DMI/kg ECM produced). This calculated value of ‘feed DMI’ was multiplied by the parameter ‘EF CH4’ to calculate the emissions of enteric CH4. The calculated parameter ‘feed DMI’ was also used, together with the parameters ‘N content in DMI’ and ‘ECM produced’, to calculate ‘excreted N’, which is one of the parameters used in calculations of N2O emissions from the soil.
Parameters used in MC analysis of variation in CF for Swedish milk (white boxes with solid borders show that parameters varied in MC analysis; those with dashed borders show calculated parameters in MC analysis and grey boxes show production data used in the calculation of enteric CH4 emissions on individual farms). Arrows show connections between parameters and the GHG calculation in which they are used; dashed lines indicate calculations of the parameters used in MC analysis. Sources of statistics are A: Swedish Dairy Association, B: Swedish Board of Agriculture and C: farm inventories by Cederberg and Flysjö (Reference Cederberg and Flysjö2004) and Cederberg et al. (Reference Cederberg, Flysjö and Ericson2007); MC = Monte Carlo; CF = carbon footprint; GHG = greenhouse gas.

Statistics
Monte Carlo analysis
The influence of variations in production data on the CF was analysed by MC analysis. This method randomly chooses, for each iteration, one value for each of the defined parameters within the range of that parameter defined by standard deviations. On the basis of 5000 iterations, the probability distribution of CF values for milk from Swedish dairy farms was estimated. The parameters varied in the analysis were ‘ECM produced’, ‘delivered share’, ‘feed DMIECM’, ‘N content in DMI’, ‘EF CH4’, ‘N-fertiliser rate’ and ‘diesel on farm’ (Table 2). The MC analysis was performed using the same software tool, Sima Pro 7, as was used for calculating the CF.
Standard deviations
In MC analysis in Sima Pro 7, the distribution of the parameters varied had to be classified as normally or log-normally distributed. In our analysis, a normal distribution was assumed for all parameters used. The distribution of each parameter did not exactly follow the normal distribution (tested by the Anderson–Darling test), but even if the P-values were low, we chose the normal distribution as it fitted better than a log-normal distribution and graphically the discrepancy from normal distribution was not too large.
Since the CF of the national average milk production was the baseline in our analysis of the impact of variations in production data, we needed standard deviations corresponding to the national mean values. The standard deviations used were therefore calculated using mean values from the national average and CV of the farm data from the 1051 dairy farms in ‘Individ Ram’ of each parameter as well as the parameter ‘N-fertiliser rate’ from the 920 farms, following the definition of CV as s.d. divided by the mean (s.d.used in MC analysis = CVfarm data × meannational average). For the parameter ‘diesel on farm’, the s.d. from the data sets was used.
All calculations for basic statistics and regression analysis were performed with the software Minitab® (www.minitab.com).
Results
Variation in production data
Animal parameters
The largest between-farm variations in the data set for the 1051 dairy farms analysed were found in milk yield, roughage share in feed DMI and calculated N in excreta, with a CV of approximately 10% (Table 2), that is, the average s.d. was 10% of the mean value. The variation in feed DMI, intake of metabolisable energy, feed efficiency and enteric CH4 emissions was slightly lower, with a CV of 6.5% to 8.0%. Protein content in DMI varied with a CV of 4.6%. CH4 emissions from enteric fermentation, calculated with the national model for each individual herd, varied between 91 and 151 kg CH4/cow per year (not including replacement animals).
As expected, owing to their participation in advisory work, the dairy farms analysed produced 540 kg ECM/cow per year more than the average estimated for Swedish milk by Flysjö et al. (2010) (see ‘average Swedish milk’ in Table 2). In addition, feed efficiency, expressed as kg ECM/kg DMI and kg ECM/unit energy intake, was approximately 7% higher than the Swedish average.
N-fertiliser rate and diesel use
The variation in N-fertiliser rate in the data set of 920 dairy farms was large (Table 2). The mean amount of N applied as synthetic fertiliser to the farm's entire arable land was 85 kg N/ha (range = 0 to 252 kg N/ha), also including non-feed crops if cultivated. Corresponding figures to the ‘average SE milk’ (Table 2) are the average N-fertiliser rates used in all grain and grasslands that are cultivated for feed in Sweden. The variation found between the farms can to some extent depend on the variation in the type of crops grown. However, only a minor share of the farms had significant areas with non-feed crops, for example, 14% of the farms used more than one-fourth of the arable land to grow crops such as bread wheat, sugar beet, rapeseed, potatoes and vegetables. There was a tendency for farms growing bread wheat (around one-third of the farms) to have higher average N-fertiliser rates, which can be the effect of relatively higher fertiliser rates used in this type of crop. No correlations were found between N-fertiliser rate and livestock density on the farms. The variation in the amount of diesel used per hectare was also large (Table 2), with a mean value of 113 l diesel/ha. There was no corresponding figure with which to compare this value, as it was given separately for roughage feed (49 l/ha), grain (22 l/ton) and protein crops (11 l/ton) in the calculation of the ‘Swedish average’ (Flysjö et al., 2010).
Variation in CF
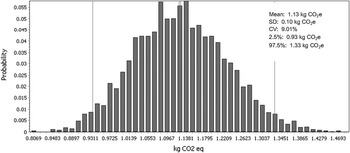
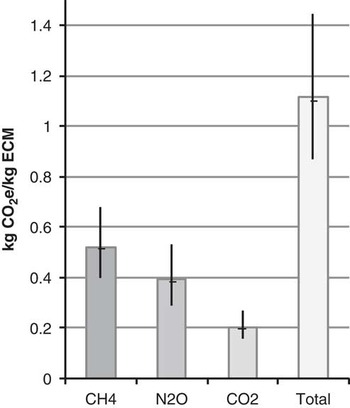
The MC analysis resulted in a Swedish average CF of 1.13 kg CO2e/kg ECM, with a 95% CI from 0.94 to 1.33 kg CO2e/kg ECM (Figure 3). This variation was solely attributable to management differences between the dairy farms. The distribution of GHG emissions was 46% CH4, 35% N2O and 18% CO2, with CO2 having the smallest CI, whereas N2O and CH4 had almost the same interval (Figure 4). The reason for the moderate variation in N2O emissions, despite a very large variation in N-fertiliser rates, is that N in manure represents a larger proportion of N input to the soil and it does not vary as much as the fertiliser rate.
Frequency distribution of GHG emissions of 1 kg ECM as a result of variation in production data on farm level, based on the Monte Carlo analysis in Sima Pro. Right and left vertical lines indicate the predicted 95% CI (from 2.5% to 97.5%); GHG = greenhouse gas; ECM = energy-corrected milk.

Contribution of each GHG to the total CF and their variations. Error bars represent the 95% CI; GHG = greenhouse gas; CF = carbon footprint.

Discussion
On the basis of the variations found in production data among Swedish dairy farms, our study suggests that the average CF of Swedish milk can be expected to vary by at least ±17%. However, the actual variation is probably higher, since the production data used in our study were obtained from dairy farms connected to the advisory service and with higher average milk yield and better feed efficiency than the average Swedish milk produced (Table 2). In addition, the set of animal production data did not include production systems using total mixed rations, a feeding system in which overconsumption of feed is common (Stallings and McGilliard, Reference Stallings and McGilliard1984). Neither did we consider other parameters in feed crop cultivation at farm level than the use of N-fertiliser (e.g. fertiliser rates in relation to crop yields and used land area for feed production) due to lack of data. Finally, other production parameters, for example, animal health, calving age and replacement rate, also affected milk CF at the farm level (Hospido and Sonesson, Reference Hospido and Sonesson2005; Place and Mitloehner, Reference Place and Mitloehner2010), but were not included in our study due to lack of data.
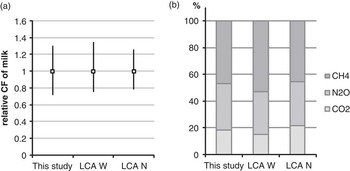
The variation in milk CF presented here is approximately in the same range that was reported in two earlier LCA studies (Cederberg and Flysjö, Reference Cederberg and Flysjö2004; Cederberg et al., Reference Cederberg, Flysjö and Ericson2007), each of which examined 23 dairy farms in two different regions of Sweden (Figure 5). Differences can be explained by slightly different calculation methods and probably by the higher number of farms analysed in our study. However, the result of the comparison suggests that the method we used, analysing defined production parameters with MC analysis, is likely to include most of the variation and not overestimate it. It is also interesting to relate the uncertainty in CF caused by varying management factors, as determined in this study, with the uncertainty in CF caused by uncertain emission factors used in estimates of N2O from the soil and enteric CH4 emissions. This latter uncertainty due to uncertain EF values was approximately ±30% for Swedish milk when analysed by Flysjö et al. (2010) using the same average production parameters and EF values (except for enteric CH4 emissions) as in this study.
Comparison of normalised results from MC analysis (this study) with (a) corresponding variation in the range of CF values and (b) distribution of GHG for two LCA studies made on 23 farms in western Sweden in 2002 (LCA W) (Cederberg and Flysjö, Reference Cederberg and Flysjö2004) and 23 farms in northern Sweden in 2005 (LCA N) (Cederberg et al., Reference Cederberg, Flysjö and Ericson2007); CF = carbon footprint; GHG = greenhouse gas; LCA = Life Cycle Assessment; MC = Monte Carlo.

The data sets of animal production parameters (1051 dairy farms) and N-fertiliser rates (920 dairy farms) used in this study provide the most comprehensive production data available for Swedish dairy production. They represent those regions (with different climate conditions and feed production) in the country where milk production is situated. The reason for using these sources of production data despite some bias (i.e. farms connected to the advisory service having better performance than the average dairy farm) was that they gave us the opportunity to calculate variations on the basis of production data from a considerable number of farms without the effort of performing inventories or a survey. The disadvantage of using existing data sets was that other parameters affecting milk CF, such as replacement rate, heifer calving age, composition of feeding strategies as well as factors related to feed production (e.g. crop yields/ha), could not be analysed.
The parameters varied in the MC analysis have different levels of certainty. Delivered milk has a high level of certainty, as it is measured by the dairy industry and provides the basis for the dairy farmers’ payment. Produced milk yield also has a high certainty level, as it is checked once a month on each farm. Lower levels of certainty are found in the parameter ‘feed DMI’, in which consumption of concentrates is relatively certain as opposed to intake of roughage, which is seldom weighed on dairy farms and can also be fed in free rations (ad libitum). Grassland yields are often poorly documented by farmers and mostly not weighed. Feed intake from grazing is probably the most uncertain parameter when studying milk and beef production, although this parameter is not so significant in this study of a production system with a low intake of roughage from grazing. In addition, some feed components (e.g. maize silage and super-pressed beet pulp) can be classified as either roughage or concentrate. The roughage share of total feed DMI is important in some models that calculate enteric CH4 (e.g. Lindgren, Reference Lindgren1980; Ellis et al., Reference Ellis, Kebreab, Odongo, McBride, Okine and France2007; Yan et al., Reference Yan, Mayne and Porter2006). Better knowledge of roughage feed intake (including grazing) will also be important when carbon sequestration in grasslands is included in CF estimates and when strategies to reduce GHG emissions are discussed (Soussana et al., Reference Soussana, Tallec and Blanfort2009). As feed intake is one of the most important production parameters in dairy production with an obvious risk of data uncertainty, accurate feed data are important in estimates of CF for milk.
A crucial finding of this study was the importance of connecting closely correlated parameters to each other to avoid unrealistic combinations of parameter values when performing the MC analysis. Unrealistic combinations (e.g. combining the highest feed intake with the lowest milk yield) would over- or underestimate the CF, and to eliminate this risk, we used standard deviations of the relationship between two dependent parameters instead of the standard deviation of the single parameters. For example, a randomly selected milk yield was multiplied by the factor ‘DMI/kg ECM’ in the range of this factor's standard deviation to obtain a value of DMI, instead of risking a random combination of high milk yield with DMI for a low-yielding cow in the MC analysis. By connecting the parameters in this way, we avoided overestimating the range of variation in the average CF of Swedish milk.
Potential to reduce CF of milk
Variations in production data between farms are partly a consequence of different conditions for farming due to climate, soil type, genetic breeds and production systems (e.g. high v. low use of grazing). Another important factor is differences in farm management, which influence feed efficiency, animal health, N-fertiliser use, etc. Since these factors depend on decisions by the farmer, the potential should exist to improve milk CF at farm level (Garnsworthy, Reference Garnsworthy2004; Gill et al., Reference Gill, Smith and Wilkinson2010). The relatively high variation found in milk CF in this study implies that there is potential to reduce GHG emissions, that is, if dairy farms with high CF can apply methods and techniques used on farms with lower CF. The MC analysis in this study indicates the existing variation in the average CF of Swedish milk and cannot provide any information about the characteristics of the dairy farms with high or low CF values.
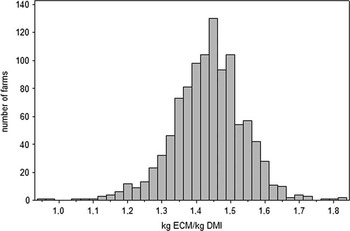
The two parameters with the individual largest impact on the milk CF were ‘ECM produced’ and ‘feed DMI’, according to Flysjö et al. (2010). The importance of milk yield (ECM) is that it forms the FU by which all emissions are divided to obtain the final CF. Feed intake (DMI) is important since approximately 43% of the life-cycle GHG emissions of milk are due to feed cultivation (including production and use of N fertilisers and diesel; Flysjö et al., 2010). These two parameters together also affect calculations of enteric CH4, which accounts for approximately 46% of the milk CF (Flysjö et al., 2010). In addition, they affect N content in excreta and thereby the estimates of NH3 emissions and indirect emissions of N2O. Thus, the merging of these two important parameters in the parameter FCE (units ECM produced/unit DMI) can be used as a type of key performance indicator to predict the potential to reduce GHG emissions at farm level. The variation in FCE found among the 1051 dairy farms in this study, that is, 0.96 to 1.82 kg ECM/kg DMI (Table 2 and Figure 6), can to some extent depend on variations in the content of fat and energy in different diets. Owing to the lack of reference data, it is difficult to estimate how much the FCE can be improved to reduce milk CF, since FCE is not an indicator used by the Swedish feed advisory service. In addition, if heifers’ feed intake could have been included, the variation in FCE would probably have been greater, as it would also be affected by the replacement rate at farm level. A herd's feed efficiency is influenced by a number of different factors, with feed digestibility being important (Britt et al., Reference Britt, Thomas, Speer and Hall2003; Beever and Doyle, Reference Beever and Doyle2007). Therefore, it is an important task for farmers and/or advisors to find the underlying reasons for low feed efficiency.
Distribution of feed efficiency (ECM produced/unit DMI) among 1051 Swedish dairy farms; ECM = energy-corrected milk; DMI = dry matter intake.

In contrast to production systems in which feed intake is homogeneous (e.g. pasture-based milk production in New Zealand) for a production system with a large variety of feed products, FCE cannot be the single ultimate indicator to suggest potential improvement in milk CF at the farm or national level. It must also be emphasised that the CF of feed products differs on the basis of how they are cultivated, transported and processed in the feed industry. Even the same feed product (e.g. barley) can have different CF due to different fertiliser rates and yields. Thus, feed efficiency can be combined with feed products having both high and low possible CF values. Today, emissions from land use and changes in land use are often not included in CF calculations due to lack of consensus on methodology. In the future, when these emissions are also included in the CF for milk, it is likely that the impact of some feed crops will contribute to higher as well as lower GHG emissions, thus increasing the importance of reliable data on feed intake. For example, the use of soya cake from newly deforested land will increase the CO2 emissions in milk CF (Gerber et al., Reference Gerber, Vellinga, Opio, Henderson and Steinfeld2010), whereas the sequestration of C in long-established grassland may decrease them (Soussana et al., Reference Soussana, Tallec and Blanfort2009). Another important issue regarding N2O emissions from cultivated soils is that factors other than the amount of N applied also play a part (e.g. soil type, drainage, degree of soil compaction and climate). These factors are not often considered when calculating N2O emissions from the soil, which are important for feed CF. Further studies on the impact of individual feed components on milk CF (including diet composition, influence on enteric CH4 production and cultivation strategy) are needed to help farmers in their choice of feeding strategy.
In addition to improving feed efficiency, the potential also exists to reduce N-fertiliser rates on dairy farms, as indicated by the large variation (0 to 250 kg N/ha) found among the 920 dairy farms in this study, even if some of this variation also can depend on the type of crops grown and differences in crop yields due to the soil and climate conditions. Supporting this conclusion is the fact that we found no correlation between purchased N in synthetic fertiliser and livestock density (and thereby access to manure) on the farms studied. This expected correlation was also found to be weak in earlier studies by Domburg et al. (Reference Domburg, Edwards and Sinclair2000) and Swensson (Reference Swensson2002). The efficiency of N used in feed production can be improved, and thereby also the CF of feed, if the use of N in manure is optimised and adjusted to the N-fertiliser rate.
Conclusions
The national average CF of milk, which is often presented as a 1-point value, includes a large variation due to differences in production parameters between dairy farms, that is, management practice and biological outputs (e.g. milk, manure). The variation in CF found in this study (±17%) can be regarded as the least expected among Swedish dairy farms and indicates a potential to decrease the CF for Swedish milk, both at the national level and on individual farms with high CF values. Milk yield and feed intake are two of the most influential parameters in CF estimates, indicating that ‘FCE’ (units ECM produced/unit DMI) can be used as a rough key performance indicator of measures to reduce milk CF on farm level. As there is a risk of large uncertainties in feed intake data, especially in the intake of roughage from grazing and silage, accurate feed data are important for CF calculations on milk.
Acknowledgements
We would like to acknowledge valuable help with statistical matters from Jan-Eric Englund (Swedish University of Agricultural Sciences) and with interpretation of animal statistics from Carin Clason and Ann-Theres Persson (advisory service VÄXA). We are also very grateful to the Swedish Dairy Association and the Swedish Board of Agriculture, especially Cecilia Linge, for providing them with the statistics used in the study. The study was performed with funding from the Swedish Farmers’ Foundation for Agricultural Research.