



1. Introduction
Turbulent boundary layers (TBLs) play a crucial role in the design and operation of a wide range of practical systems, including aircraft, ships, wind turbines and other fluid systems. A key aspect of understanding TBLs is their behaviour under pressure gradients, as this significantly impacts the performance and energy efficiency of these systems. For instance, under an adverse pressure gradient (APG), the flow within the TBL slows down, and the thickness of the boundary layer increases. In severe cases of APG, the boundary-layer flow may separate from the solid surface, resulting in a drastic change in the flow pattern.
Considerable research efforts have been dedicated to understanding the behaviour of TBLs under pressure gradients through theoretical, experimental and numerical means (Rotta Reference Rotta1950; Clauser Reference Clauser1954; Townsend Reference Townsend1956; Mellor Reference Mellor1966; Mellor & Gibson Reference Mellor and Gibson1966; Monty, Harun & Marusic Reference Monty, Harun and Marusic2011; Bobke et al. Reference Bobke, Vinuesa, Örlü and Schlatter2017; Coleman, Rumsey & Spalart Reference Coleman, Rumsey and Spalart2018; Devenport & Lowe Reference Devenport and Lowe2022; Subrahmanyam, Cantwell & Alonso Reference Subrahmanyam, Cantwell and Alonso2022). However, previous investigations have concentrated primarily on studying the effects of pressure gradients on the mean streamwise velocity, with relatively less attention given to the behaviour of the mean wall-normal flow. This knowledge gap motivates our present study, where we rigorously derive a novel analytical equation for the mean wall-normal velocity in TBLs subjected to arbitrary pressure gradients.
Experimental measurement of the mean wall-normal velocity  $V$ poses significant challenges due to its small magnitude relative to the streamwise velocity. As a result, there is a scarcity of reliable experimental data available for studying
 $V$. To overcome this limitation and ensure the validity of the derived analytical equation, this study conducts a comprehensive comparison with two independent numerical simulation datasets. The first dataset consists of well-resolved large-eddy simulations (LES) of near-equilibrium APG TBLs conducted by Bobke et al. (Reference Bobke, Vinuesa, Örlü and Schlatter2017). The second dataset comprises direct numerical simulations (DNS) of TBLs subjected to first an APG and then a favourable pressure gradient (FPG) (Coleman et al. Reference Coleman, Rumsey and Spalart2018).
An important challenge in the study of TBLs (particularly when subjected to streamwise pressure gradients) is to determine accurately and consistently the boundary-layer edge (see e.g. Vinuesa et al. Reference Vinuesa, Bobke, Örlü and Schlatter2016; Cantwell Reference Cantwell2021; Griffin, Fu & Moin Reference Griffin, Fu and Moin2021). The conventional approach relies on mean streamwise velocity ( $U$) profiles and locates the boundary-layer edge at 99 % of the free-stream velocity (see e.g. Young et al. Reference Young, Munson, Okishi and Huebsch2007). However, this method assumes a constant mean streamwise velocity outside the boundary layer, which may not always hold true (see Appendix A for examples). To address this, we adopt a novel method proposed by Wei & Knopp (Reference Wei and Knopp2023) to determine the boundary-layer edge (
 $\delta _e$). This method identifies the boundary-layer edge as the location where the Reynolds shear stress decreases to 1 % of its maximum value. Further details about this method can be found in Appendix A. This new approach aligns with the traditional boundary-layer edge determination method when the mean streamwise velocity remains constant outside the boundary layer. The analytical derivation developed in this work is independent of the specific choice of
 $\delta _e$ and
 $U_e$. In the main text, the results utilize the
 $\delta _e$ determined using the new approach. Additionally, in Appendix B, the results obtained using
 $\delta _e$ defined from the
 $U$ profiles and diagnostic plot (Vinuesa et al. Reference Vinuesa, Bobke, Örlü and Schlatter2016) are presented for comparison.
Figure 1 illustrates the variation of the mean streamwise velocity at the boundary-layer edge  $U_e$ for the two simulations examined in this study. In the well-resolved near-equilibrium flat-plate LES by Bobke et al. (Reference Bobke, Vinuesa, Örlü and Schlatter2017), the pressure gradient was imposed through specifying the free-stream velocity at the top of the domain using Townsend's power-law definition (see Townsend Reference Townsend1956; Mellor & Gibson Reference Mellor and Gibson1966)
 $C (x-x_0)^m$, where
 $C$ is a constant,
 $x_0$ is a virtual origin, and
 $m$ is the power-law exponent. Five cases of simulations were performed to investigate different near-equilibrium boundary layers by varying the virtual origin and the power-law exponent
 $m$. These simulations include case m13 (
 $x_0=60$,
 $m=-0.13$), case m16 (
 $x_0=60$,
 $m=-0.16$), case m18 (
 $x_0=60$,
 $m=-0.18$), case b1 (
 $x_0=100$,
 $m=-0.14$), and case b2 (
 $x_0=100$,
 $m=-0.18$). The lengths in the archived data were normalized by the displacement thickness of the laminar inflow
 $\delta _1(x_0)$, and the velocities were normalized by the free-stream velocity at the inlet
 $U_{0}$.
Variation of the mean streamwise velocity at the boundary-layer edge. The ix on the top axis refers to the grid-point number in the  $x$-direction. (a) Well-resolved LES of near-equilibrium flat-plate APG TBLs by Bobke et al. (Reference Bobke, Vinuesa, Örlü and Schlatter2017). The
 $x$-location is normalized by the displacement thickness of the laminar inflow
 $\delta _1(x_0)$. (b) DNS of NEPG TBLs by Coleman et al. (Reference Coleman, Rumsey and Spalart2018). The
 $x$-location is normalized by the simulation domain height
 $Y$.

In the DNS of non-equilibrium pressure gradient (NEPG) TBLs by Coleman et al. (Reference Coleman, Rumsey and Spalart2018), pressure gradients were induced by a transpiration profile  $V_{top}(x)$ acting through a virtual parallel plane offset a fixed distance
 $Y$ from the flat no-slip surface. The archived simulation data were normalized by
 $Y$ and
 $U_{0}= U_e(x_0)$. Figure 1(b) illustrates that the boundary-layer thickness increases much more rapidly under APG than under zero pressure gradient (ZPG). Although
 $U_e$ decreases under APG, the product
 $U_e \delta _e$ increases in the
 $x$-direction. The maximum value of
 $U_e \delta _e$ in the APG region is reached near
 $\mathrm {ix}\approx 4000$. Based on the friction coefficient
 $C_f=\tau _{wall}/(0.5 \rho U^2_e)$ data, the TBL separates at
 $x/Y\approx -1.4$ (
 ${\rm ix} \approx 3500$) and subsequently reattaches at
 $x/Y \approx 0.4$ (
 ${\rm ix}\approx 4050$). Based on the pressure gradient
 $\mathrm {d}C_p/\mathrm {d}\kern 0.06em x$ data presented in figure 1(b), it can be determined that the FPG region initiates at approximately
 ${\rm ix} = 4200$. The pressure coefficient
 $C_p$ is defined as
 $C_p = (P-P_\infty )/(0.5 \rho U^2_\infty )$.
Figure 1(b) shows that under FPG, initially  $\delta _e$ decreases in the
 $x$-direction. However, between
 $\mathrm {ix}\approx 5200$ and
 $\mathrm {ix}\approx 6000$, the boundary-layer thickness
 $\delta _e$ increases again, despite the mean pressure gradient being favourable. Similarly, the product
 $U_e \delta _e$ initially decreases in the FPG region, but then increases again in the
 $x$-direction. It is important to note that due to the sudden transition from APG to FPG, the FPG region in the DNS may be influenced by the upstream APG effect, especially in the outer region.
Figure 2 displays the variation of the mean wall-normal velocity at several  $x$-stations in the numerical simulations. Under APG, the mean wall-normal velocity is positive and increases linearly outside the boundary layer. On the other hand, under FPG (as seen in the DNS at
 ${\rm ix} = 5000$), the mean wall-normal velocity is negative, and the boundary-layer thickness decreases in the
 $x$-direction. Figure 2(b) shows that the mean wall-normal velocity at or near ZPG (
 ${\rm ix} = 1000$ and 6100) is significantly smaller than the mean wall-normal velocity under APG.
Mean wall-normal velocity profiles at different  $x$-locations shown in figure 1. (a) Well-resolved LES of near-equilibrium flat-plate APG TBLs by Bobke et al. (Reference Bobke, Vinuesa, Örlü and Schlatter2017) (case b1). (b) The DNS of NEPG TBLs by Coleman et al. (Reference Coleman, Rumsey and Spalart2018). The short vertical red line marks the boundary-layer edge.

In this work, we elucidate the characteristics of the wall-normal velocity through an analytical derivation. In § 2, the mean wall-normal velocity at the boundary-layer edge is first derived. An analytical equation for the mean wall-normal velocity is subsequently derived and validated with the numerical simulation data. Section 3 discusses the significance of the components and pre-factors in the analytical equation. Section 4 summarizes the work.
2. Analysis of the mean continuity equation
For a statistically steady two-dimensional TBL under pressure gradient, the mean continuity equation is (see e.g. Tennekes & Lumley Reference Tennekes and Lumley1972)
 \begin{equation} 0 = \frac{\partial U}{\partial x} + \frac{\partial {V}}{\partial y}, \end{equation}
where the upper-case letters  $U$ and
 $V$ represent the mean velocity component in the streamwise (
 $x$) and wall-normal (
 $y$) directions, respectively. In order to derive an analytical equation for the mean wall-normal velocity
 $V$, we first transform the mean continuity equation into a dimensionless form. To achieve this, we define the normalized variables

where  $L$ is a length scale in the
 $x$-direction. While normalized streamwise velocity can also be
 $U/U_e$, in this work, we define
 $U^-$ as
 $1-U/U_e$ for a bounded integral
 $\int _0^\infty U^-\, \mathrm {d}y^-$. It is important to emphasize that this normalization does not assume any self-similarity of
 $U^-$ or
 $V^-$.
Using the defined normalized variables, the terms in the mean continuity equation can be written as
 \begin{equation} \left.\begin{gathered} \frac{\partial U}{\partial x} = \frac{\mathrm{d} U_e}{\mathrm{d}\kern 0.06em x} - \frac{\mathrm{d} U_e}{\mathrm{d}\kern 0.06em x}\,U^-{-} \frac{U_e}{L}\,\frac{\partial U^-}{\partial x^*} + \frac{U_e}{\delta_e}\,\frac{\mathrm{d} \delta_e}{\mathrm{d}\kern 0.06em x}\,y^-\, \frac{\partial U^-}{\partial y^-}, \\ \frac{\partial V}{\partial y} = \frac{|V_e|}{\delta_e}\,\frac{\partial V^-}{\partial y^-}. \end{gathered}\right\} \end{equation}
Simple mathematics produces a dimensionless continuity equation in the form
 \begin{equation} 0 = \frac{\delta_e}{|V_e|}\,\frac{\mathrm{d} U_e}{\mathrm{d}\kern 0.06em x}- \frac{1}{|V_e|}\,\frac{\mathrm{d} (U_e \delta_e)}{\mathrm{d}\kern 0.06em x}\,U^-{+} \frac{U_e}{|V_e|}\,\frac{\mathrm{d} \delta_e}{\mathrm{d}\kern 0.06em x}\, \frac{\partial (y^- U^-)}{\partial y^-} - \frac{U_e}{|V_e|}\,\frac{\delta_e}{L}\,\frac{\partial U^-}{\partial x^*} + \frac{\partial V^-}{\partial y^-}. \end{equation}
2.1. Mean wall-normal velocity at the boundary-layer edge
The mean wall-normal velocity  $V_e$ at the edge of the boundary layer can be obtained by performing integration of (2.4) with respect to
 $y^-$ from the wall
 $y^-=0$ to the boundary-layer edge
 $y^-=1$:
 \begin{equation} V_e ={-} {\delta_e}\,\frac{\mathrm{d} U_e}{\mathrm{d}\kern 0.06em x} + \frac{\mathrm{d} (U_e\delta_e)}{\mathrm{d}\kern 0.06em x}\, \frac{\delta_1}{\delta_e} + U_e\,\frac{\delta_e}{L} \int_0^1 \frac{\partial U^-}{\partial x^*}\,\mathrm{d}y^-. \end{equation}
Note that by definition,  $\int _0^{1} U^-\,\mathrm {d}y^- =\delta _1/\delta _e$, where
 $\delta _1$ is the mass displacement thickness (see Schlichting Reference Schlichting1979). In a ZPG TBL, the mean streamwise velocity beyond the boundary-layer edge
 $\delta _e$ remains constant in the wall-normal
 $y$-direction. However, when a TBL is subjected to a pressure gradient, the mean streamwise velocity beyond
 $\delta _e$ may vary in the
 $y$-direction (see Appendix A). The evaluation of the last term in (2.5) involves absorbing the length scale
 $L$ back into
 $x^*$. As a result, the specific choice of
 $L$ becomes inconsequential to the evaluation.
Figure 3 illustrates the simulation data for  $V_e$, accompanied by the three terms on the right-hand side of (2.5), as well as their sum. The simulation data exhibit excellent agreement with the analytical equation (2.5). In figure 3(a), it is evident that the term involving
 $\partial U^-/\partial x^*$ is relatively small within the near-equilibrium APG TBL (
 $1000 < x/\delta _1(x_0) < 2200$), and its contribution can be considered negligible in such situations. However, as shown in figure 3(b), the term involving
 $\partial U^-/\partial x^*$ becomes significant when the TBL undergoes rapid changes in pressure gradient, and cannot be neglected.
Comparison of simulation data of  $V_e$ with (2.5). (a) Case b1 from the LES of Bobke et al. (Reference Bobke, Vinuesa, Örlü and Schlatter2017). (b) The DNS of Coleman et al. (Reference Coleman, Rumsey and Spalart2018). To prevent clutter, every 100th grid in the
 $x$-direction is plotted. Markers for
 $V_e$ represent values obtained directly from simulation data, while the sum is calculated from terms on the right-hand side of (2.5).

By applying the Leibniz integral rule to the last term in (2.5), the mean wall-normal velocity at the boundary-layer edge can be simplified as
 \begin{equation} V_e ={-} {\delta_e}\,\frac{\mathrm{d} U_e}{\mathrm{d}\kern 0.06em x} + \frac{\mathrm{d} (U_e\delta_1)}{\mathrm{d}\kern 0.06em x}. \end{equation}
For a ZPG boundary layer, where  $U_e$ remains constant, (2.6) can be simplified further to
 $V_e=U_e\, \,\mathrm {d}\delta _1/\mathrm {d}\kern 0.06em x$, as reported by Wei, Li & Wang (Reference Wei, Li and Wang2023a).
It is intriguing to observe that the functional form of (2.6) exhibits certain similarities to Kármán's integral equation  $u^2_\tau = (U_e \delta _1)\,{\mathrm {d}U_e}/{\mathrm {d}\kern 0.06em x} + {\mathrm {d}(U^2_e \delta _2)}/{\mathrm {d}\kern 0.06em x}$. Kármán's integral equation is derived by integrating globally both the mean continuity and momentum equations (see e.g. Schlichting Reference Schlichting1979). Equation (2.6) is also valid for the laminar (Falkner–Skan) case, as it is derived solely from the continuity equation without making any assumptions about turbulence or pressure gradients.
Figure 4 illustrates the simulation data of  $V_e$, along with the two terms on the right-hand side of (2.6), and their sum. The mean wall-normal velocity magnitude is observed to be significantly higher under APG or FPG as compared to ZPG. This amplified wall-normal convection in the APG TBL has been reported in simulations of TBLs around wing sections (Vinuesa et al. Reference Vinuesa, Negi, Atzori, Hanifi, Henningson and Schlatter2018). Figure 4 demonstrates that the sum of the terms on the right-hand side of (2.6) exhibits better agreement with the directly simulated
 $V_e$ in comparison to the sum of the terms on the right-hand side of (2.5). Mathematically, (2.5) and (2.6) are equivalent. The enhanced accuracy observed in the post-processing with (2.6) can be attributed to its improved precision in calculating the
 $x$-derivative from
 $\delta _1$, which represents an integral quantity. In Appendix B, we demonstrate that the validity of (2.6) is independent of the method used to determine the boundary-layer edge (see figure 18).
Comparison of simulation data of  $V_e$ with (2.6). (a) Case b1 from the LES of Bobke et al. (Reference Bobke, Vinuesa, Örlü and Schlatter2017). (b) The DNS of Coleman et al. (Reference Coleman, Rumsey and Spalart2018). To prevent clutter, every 100th grid in the
 $x$-direction is plotted. Markers for
 $V_e$ represent values obtained directly from simulation data, while the sum is calculated from terms on the right-hand side of (2.6).

Figure 4 shows that in APG TBLs, both terms on the right-hand side of (2.6) are positive, and  $V_e$ is also positive, resulting in the rapid growth of the boundary layer. Conversely, under FPG,
 $U_e$ increases in the
 $x$-direction, and as shown in figure 4(b), the first term on the right-hand side of (2.6) becomes negative.
2.2. Analytical equation for  $V$

Integrating (2.4) with respect to  $y^-$ yields an analytical equation for the mean wall-normal velocity distribution:
 \begin{align} V^- &=
\underbrace{-\frac{\delta_e}{|V_e|}\,
\frac{\mathrm{d} U_e}{{\mathrm{d}}\kern 0.06em x}}_{a_{I}}\,y^-
\underbrace{{}-\frac{U_e}{|V_e|}\,\frac{\mathrm{d}
\delta_e}{\mathrm{d}\kern 0.06em x}}_{a_{II}}\,y^-
U^-{+}
\underbrace{\frac{1}{|V_e|}\,\frac{{\mathrm{d}}
(U_e\delta_e)}{{\mathrm{d}}\kern 0.06em x}}_{-(a_{I}+a_{II})}
\int_0^{y^-} U^-\,\mathrm{d}y^- \nonumber\\ &\quad +
\underbrace{\frac{U_e}{|V_e|}\,
\frac{\delta_e}{L}}_{a_{III}} \int_0^{y^-} \frac{\partial
U^-}{\partial x^*}\, \mathrm{d}y^-.
\end{align}
For a constant value of  $U_e$, (2.7) simplifies to
 $V^-=(U_e/|V_e|)\,\mathrm {d}\delta _e/\mathrm {d}\kern 0.06em x (-y^-U^- + \int _0^{y^-}$
 $U^-\,{\textrm {d}y}^-) + (U_e/|V_e|)(\delta _e/L)\int _0^{y^-}(\partial U^-/\partial x^*)\,{\textrm {d}y}^-$, as reported by Wei et al. (Reference Wei, Li and Wang2023a) for the normalized mean wall-normal velocity in a ZPG boundary layer.
To illustrate the four components of the mean wall-normal velocity in an APG TBL, figure 5 uses the well-resolved LES data of near-equilibrium APG TBLs by Bobke et al. (Reference Bobke, Vinuesa, Örlü and Schlatter2017). Under an APG,  $U_e$ experience a decrease while
 $\delta _e$ increases in the
 $x$-direction. As a result,
 $a_{I}$ is positive and
 $a_{II}$ is negative.
Illustration of the four components in (2.7) for an APG TBL. The data are from the well-resolved LES data of near-equilibrium APG TBLs by Bobke et al. (Reference Bobke, Vinuesa, Örlü and Schlatter2017): case b1 at the 1000th grid point in  $x$.

Figure 6 shows the different components of the mean wall-normal velocity under transition from APG to FPG, as obtained from the DNS of Coleman et al. (Reference Coleman, Rumsey and Spalart2018). In the APG section, the first, second and third terms in the DNS data behave similarly to those shown in figure 5. However, the last term with  $x$-derivative has a significantly larger magnitude in the DNS data, indicating that the TBL is not in a near-equilibrium state. In the FPG section, the first and last terms of (2.7) are negative, as shown in figure 6(b).
Wall-normal velocity and its components from the DNS data of NEPG TBLs by Coleman et al. (Reference Coleman, Rumsey and Spalart2018). (a) The APG section at  $\textrm {ix} = 2800$. (b) The FPG section at
 $\textrm {ix} = 5000$.

To provide further validation of (2.7), the mean wall-normal velocity profiles at various  $x$-stations presented in figure 2 are normalized and compared with the analytical equation in figure 7. The figure demonstrates the excellent agreement between the simulation data and the analytical equation. In Appendix B, we demonstrate that the accuracy of (2.7) is not affected by the method used to determine the boundary-layer edge (see figure 20). The shapes of the
 $V/|V_e|$ versus
 $y/\delta _e$ profiles, however, may vary due to the use of different methods for determining the boundary-layer edge and the resulting differences in
 $\delta _e$ and
 $V_e$ values (see Appendix B).
Normalized  $V/|V_e|$ obtained directly from simulation data (open symbols) and the sum of terms on the right-hand side of (2.7) (filled symbols) plotted against
 $y/\delta _e$. (a) Well-resolved LES data of near-equilibrium APG TBLs by Bobke et al. (Reference Bobke, Vinuesa, Örlü and Schlatter2017). (b) The DNS data of NEPG TBLs by Coleman et al. (Reference Coleman, Rumsey and Spalart2018).

In ZPG TBL,  $V^-$ is approximately a self-similar function of
 $y^-$, as observed by Wei & Klewicki (Reference Wei and Klewicki2016). However, in TBL under pressure gradient, especially when the pressure gradient varies over a short distance, the mean wall-normal velocity profile undergoes a rapid change in shape and magnitude. Figure 8 presents the mean wall-normal velocity profiles around the location where the pressure gradient switches from APG to FPG. In figure 8(a), the raw data show a smaller magnitude of
 $V$ (magnitude of 0.02 in figure 8(a) versus 0.1 in figure 2(b)), and a change of velocity direction. Moreover, the shapes of the mean wall-normal velocity at the three stations are distinctively different. In figure 8(b), the mean wall-normal velocity normalized by
 $|V_e|$ is presented. While the analytical equation captures the general trend of
 $V$, there are noticeable deviations at stations
 $\textrm {ix} = 3900$ and 4000. These deviations can be attributed to the rapid shift from APG to FPG, which amplifies the numerical errors in the finite-difference calculation of
 ${\partial U^-}/\partial x^*$ in (2.7) at
 $\textrm {ix} = 3900$ and 4000.
Plots of  $V$ profiles from DNS data of NEPG TBLs by Coleman et al. (Reference Coleman, Rumsey and Spalart2018) at three different locations near
 $x/Y=0$: (a) raw data, (b) normalized data.

3. Discussion
The analytical equation (2.7) provides valuable insights into the composition of the mean wall-normal velocity in TBLs under arbitrary pressure gradients. It reveals that the mean wall-normal velocity can be decomposed into four distinct components, as depicted in figures 5 and 6. It is interesting to note that the first three components in (2.7) for the mean wall-normal velocity in the TBL bear a strong resemblance to those observed for the mean transverse flow in planar turbulent wakes under pressure gradients, as discussed in Wei et al. (Reference Wei, Liu, Li and Livescu2023b).
The parameters  $a_{I}$,
 $a_{II}$,
 $-(a_{I}+a_{II})$ and
 $a_{III}$ in (2.7) represent the ratios of the characteristic velocity for each component to
 $|V_e|$. Figure 9 illustrates the variations of these parameters with
 $x$-locations. In near-equilibrium APG TBLs,
 $a_{I}$ is approximately 0.5, and
 $a_{II}$ is negative with magnitude approximately 2. In the DNS of TBL under rapid changes between APG and FPG,
 $a_{I}$ varies between
 $-1$ and 1. The magnitudes of
 $a_{II}$ and
 $-(a_{I}+a_{II})$ are approximately 1, except near the leading and trailing edges of the domain.
Pre-factors of the three terms on the right-hand side of (2.7). (a) Well-resolved LES of near-equilibrium APG TBL by Bobke et al. (Reference Bobke, Vinuesa, Örlü and Schlatter2017). (b) The DNS of NEPG TBLs by Coleman et al. (Reference Coleman, Rumsey and Spalart2018). To prevent clutter, only every 100th grid in  $x$ is plotted.

The first term on the right-hand side of (2.7) is a linear function of  $y$, and is associated with the imposed pressure gradient
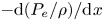 $-\mathrm {d} (P_e/\rho )/\mathrm {d}\kern 0.06em x$ or
 $U_e \,\mathrm {d} U_e/\mathrm {d}\kern 0.06em x$. In an APG (FPG) TBL, the parameter
 $a_{I}$ is positive (negative) due to the sign of
 $\mathrm {d} U_e/\mathrm {d}\kern 0.05em x$. Additionally,
 $a_{I}$ can also be expressed as
 \begin{equation} a_{I} ={-}\frac{\delta_e}{|V_e|}\,\frac{\mathrm{d} U_e}{\mathrm{d}\kern 0.06em x} = \frac{\left.\dfrac{\partial V}{\partial y}\right|_{e}}{\dfrac{|V_e|}{\delta_e}}. \end{equation}
The parameter  $a_{I}$ can therefore be interpreted as the ratio of two slopes, namely the slope
 $\partial V/\partial y|_e$ of the mean wall-normal velocity profile at the boundary-layer edge, and the slope of
 $|V_e|/\delta _e$. This relationship is illustrated in figure 10, where the normalized mean wall-normal velocity
 $V/V_e$ is plotted against the normalized wall-normal distance
 $y/ \delta _e$. In the case of an APG TBL, where
 $V_e$ is positive, this figure is equivalent to figure 6(a). On the other hand, in an FPG TBL where
 $V_e$ is negative, figure 10 is analogous to vertically flipping figure 6(b) onto the positive side.
Visual representation of terms in (2.6) for  $V/|V_e|$.

Figure 11 illustrates the impact of pressure gradient on the ratio of the two terms on the right-hand side of (2.6), as shown in figure 10. In the ZPG TBL, the ratio is zero since  $\mathrm {d}U_e/\mathrm {d}\kern 0.06em x=0$. In the near-equilibrium APG TBL, as observed in figure 11(a), the ratio remains nearly constant at 1. For the FPG TBL, both
 $\delta _e$ and
 $\delta _1$ decrease in the
 $x$-direction, indicating a thinner boundary layer. In the non-equilibrium TBL simulated by Coleman et al. (Reference Coleman, Rumsey and Spalart2018), the product
 $U_e \delta _1$ initially decreases in the FPG TBL region and then increases towards the end of the simulation domain. Consequently, in the FPG region of the DNS data, the ratio can be either positive or negative, and its magnitude can exceed 1 significantly.
Ratio of the two terms on the right-hand side of (2.6). (a) Well-resolved LES of APG TBLs by Bobke et al. (Reference Bobke, Vinuesa, Örlü and Schlatter2017). (b) The DNS of NEPG TBLs by Coleman et al. (Reference Coleman, Rumsey and Spalart2018).

The ratio between  $a_{I}$ and
 $a_{II}$ is equivalent to the pressure gradient parameter
 $\varLambda$ defined by Castillo & George (Reference Castillo and George2001), with the only difference being a negative sign:
 \begin{equation} \frac{a_{I}}{a_{II}} = \frac{\delta_e\,\dfrac{\mathrm{d} U_e}{\mathrm{d}\kern 0.06em x}}{U_e\, \dfrac{\mathrm{d} \delta_e}{\mathrm{d}\kern 0.06em x}} ={-} \varLambda. \end{equation}
From their analysis of experimental data, Castillo & George (Reference Castillo and George2001) reported that the pressure gradient parameter  $\varLambda$ is approximately
 $0.22$ for APG TBLs, and
 $-1.92$ for FPG TBLs. However, the universality of these values has been a topic of debate, as pointed out by Maciel, Rossignol & Lemay (Reference Maciel, Rossignol and Lemay2006).
In near-equilibrium APG TBLs, the last term on the right-hand side of (2.5) is negligible. Additionally, as illustrated in figure 12, the ratio of  $-\delta _e \,{\mathrm {d} U_e}/{\mathrm {d}\kern 0.06em x}$ to
 $({\delta _1}/{\delta _e})\,{\mathrm {d} (U_e \delta _e)}/{\mathrm {d}\kern 0.06em x}$ is approximately
 $1$ within the region
 $1000 \lesssim x/\delta _1({x_0}) \lesssim 2200$. Setting the ratio in figure 12 to be 1, the pressure gradient parameter defined by Castillo & George (Reference Castillo and George2001) can be approximated as
 \begin{equation} \varLambda ={-} \frac{a_{I}}{a_{II}} = \frac{-\delta_e\,\dfrac{\mathrm{d} U_e}{\mathrm{d}\kern 0.06em x}}{U_e\, \dfrac{\mathrm{d} \delta_e}{\mathrm{d}\kern 0.06em x}} \approx \frac{1}{1 + \dfrac{\delta_e}{\delta_1}}\quad (\text{near-equilibrium APG TBL}). \end{equation}
Ratio of 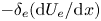 $-\delta _e ({\mathrm {d} U_e}/{\mathrm {d}\kern 0.06em x})$ to
 $({\mathrm {d} (U_e \delta _e)}/{\mathrm {d}\kern 0.06em x}) ({\delta _1}/{\delta _e})$. Data are from the well-resolved LES of near-equilibrium APG TBLs by Bobke et al. (Reference Bobke, Vinuesa, Örlü and Schlatter2017).

Figure 13 compares the approximation (3.3) with experimental and LES data. While both the experimental and LES data show that  $\varLambda$ is not constant, they agree well with the predicted trend given by (3.3).
(a) Comparison of the approximate (3.3) and experimental data of Skåre & Krogstad (Reference Skåre and Krogstad1994). The  $x$-location is normalized by the boundary-layer thickness at the first measurement station. (b) Comparison of the approximate (3.3) and well-resolved LES data of near-equilibrium APG TBLs by Bobke et al. (Reference Bobke, Vinuesa, Örlü and Schlatter2017).

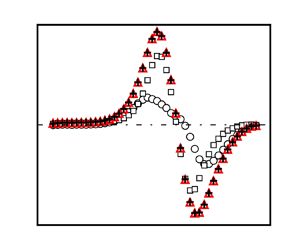
Figure 14(a) shows the ratio of the first two terms in (2.5) for  $V_e$ from the DNS data of NEPG TBLs by Coleman et al. (Reference Coleman, Rumsey and Spalart2018). The ratio is approximately
 $1$ over a short distance within the APG region, and
 $\varLambda$ is close to the value
 $0.22$ suggested for the near-equilibrium APG TBLs, as shown in figure 14(b). However, it is important to note that
 $\varLambda$ is not constant from the leading edge to the end of the APG region, but exhibits a smooth variation. As shown in figure 14(b), the approximation in (3.3) works well for estimating
 $\varLambda$ in the APG TBL when it is in a near-equilibrium state. However, this approximation is not valid for FPG TBLs.
(a) Ratio of the first two terms on the right-hand side of (2.5) for  $V_e$. (b) Plots of
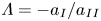 $\varLambda = -a_{I}/a_{II}$ and DNS data of NEPG TBLs by Coleman et al. (Reference Coleman, Rumsey and Spalart2018).

The variation of  $\varLambda$ in the region
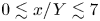 $0 \lesssim x/Y \lesssim 7$ is more complicated. For
 $0 \lesssim x/Y \lesssim 4$, where a strong FPG is present,
 $U_e$ increases while
 $\delta _e$ decreases in the
 $x$-direction. As a result,
 $a_{I}$ becomes negative,
 $a_{II}$ becomes positive, and
 $\varLambda$ becomes positive. However, at approximately
 $x/Y=5$,
 $\mathrm {d} \delta _e/\mathrm {d}\kern 0.06em x \approx 0$ (see figure 1b), causing
 $\varLambda$ to diverge to infinity. Beyond this point, i.e. for
 $x/Y \gtrsim 5$,
 $\delta _e$ begins to increase in the
 $x$-direction, despite the presence of a weak FPG. This results in a negative value of
 $\varLambda$.
The right-hand side of (3.3), computed from an integral quantity  $\delta _1$, provides greater numerical robustness and consistent values. It is close to the value suggested by Castillo & George (Reference Castillo and George2001) for near-equilibrium flow conditions (figure 13b). Even in the non-equilibrium flow studied by Coleman et al. (Reference Coleman, Rumsey and Spalart2018), the approximation remains almost constant in the first part of the APG region sufficiently upstream of separation. In accordance with Wei & Knopp (Reference Wei and Knopp2023),
 $\delta _1$ corresponds to the wall distance
 $y_{m}$ of maximum Reynolds shear stress. In flows approaching equilibrium, the position of
 $y_{m}$ undergoes minimal changes.
4. Summary
This study investigates the behaviour of the mean wall-normal velocity in turbulent boundary layers (TBLs) subjected to pressure gradients. Through rigorous derivation, new analytical equations are developed to describe accurately the distribution of the mean wall-normal velocity and its value at the boundary-layer edge. These analytical equations are validated thoroughly against two independent numerical simulation datasets, demonstrating excellent agreement. Importantly, the evaluation of the simulation data highlights the robustness of the derived equations, confirming their independence from the specific method used to determine the boundary-layer edge.
The analytical equation for the mean wall-normal velocity is decomposed into four components, with only one of them involving the streamwise derivative of the  $U$ profile. In near-equilibrium TBLs, this component is found to be negligible, while in non-equilibrium cases, it plays a significant role. Furthermore, this study explores the characteristics of the pre-factors in the analytical equation for the mean wall-normal velocity, and establishes a close connection between the ratio of these pre-factors and a pressure-gradient parameter defined previously in the literature. By bridging an existing gap in the literature, this analysis enhances our understanding of the behaviour of TBLs under pressure gradients, contributing to more comprehensive knowledge in this field. Overall, this work represents a significant advancement in our knowledge of TBLs, and provides valuable insights for the analysis and prediction of mean wall-normal velocity profiles in such flows.
Acknowledgements
We would like to extend our sincere appreciation to Dr G. Coleman for generously sharing the DNS data with us, as well as for dedicating time to review our draft and providing us with valuable feedback.
Funding
T.K. would like to express his gratitude for the funding provided by the Deutsche Forschungsgemeinschaft (DFG) under the project ‘Complex wake flows’ (grant no. KN 888/3-2). R.V. acknowledges financial support from ERC grant no. 2021-CoG-101043998, DEEPCONTROL.
Declaration of interests
The authors report no conflict of interest.
Appendix A. Determination of the boundary-layer edge
Accurately determining the location of the boundary-layer edge is essential for consistent analysis of boundary-layer flow data (see e.g. Vinuesa et al. Reference Vinuesa, Bobke, Örlü and Schlatter2016; Cantwell Reference Cantwell2021; Subrahmanyam et al. Reference Subrahmanyam, Cantwell and Alonso2022). In studies of boundary-layer flow over a flat plate, a widely adopted method involves utilizing the mean streamwise velocity profile to identify the boundary-layer edge. Specifically, the boundary-layer edge is determined as the position where the mean streamwise velocity reaches a certain percentage, typically 95 % or 99 %, of the free-stream velocity (see Young et al. Reference Young, Munson, Okishi and Huebsch2007). The accuracy of this method relies on two factors: the spatial resolution of the measurements near the boundary-layer edge, and the constancy of the mean streamwise velocity outside the boundary layer.
Due to the gradual variation of mean streamwise velocity away from the wall, the measurements obtained in experimental studies often become sparse near the boundary-layer edge. The sparsity of data points near the boundary-layer edge poses a challenge in identifying the precise location of  $\delta _e$.
In numerical simulations, the spatial resolution is not a concern when employing the method based on the  $U$ profile. However, a potential challenge arises from the non-constancy of the mean streamwise velocity outside the TBL. Both experimental and numerical studies have revealed that the mean streamwise velocity
 $U$ can exhibit wall-normal variations beyond the boundary-layer edge, particularly in TBLs experiencing strong pressure gradients (see e.g. Coleman et al. Reference Coleman, Rumsey and Spalart2018). In such cases, it becomes unclear which velocity value should be used to determine the location of the boundary-layer edge based on the 95 % or 99 % criterion.
An alternative approach for determining the boundary-layer edge has been developed by Vinuesa et al. (Reference Vinuesa, Bobke, Örlü and Schlatter2016), building upon the diagnostic plot concept introduced by Alfredsson, Segalini & Orlü (Reference Alfredsson, Segalini and Örlü2011). This method involves plotting the ratio  $u_{rms}/(U \sqrt {H_{{12}}})$ (where
 $u_{rms}$ is the root-mean-square of the streamwise velocity fluctuation,
 $U$ is the mean streamwise velocity, and
 $H_{{12}}$ is the shape factor) against the ratio
 $U/U_e$. The diagnostic plot was introduced originally to evaluate experimental data quality. However, Vinuesa et al. (Reference Vinuesa, Bobke, Örlü and Schlatter2016) expanded this concept to determine the boundary-layer thickness. They discovered that the position where
 $U/U_e=0.99$ aligns approximately with
 $u_{rms}/(U\sqrt {H_{{12}}})=0.02$.
Recently, a novel method has been developed by Wei & Knopp (Reference Wei and Knopp2023) to determine the edge of TBLs by utilizing the Reynolds shear stress profiles. In this approach, the location  $\delta _e$ is defined as the point where the Reynolds shear stress decreases to 1 % or 5 %, depending on the spatial resolution, of the maximum value of the Reynolds shear stress. This innovative method offers a consistently reliable approach to identify accurately the boundary-layer edge, leveraging the distinct behaviour exhibited by the Reynolds shear stress.
In figures 15(a–e), we illustrate the boundary-layer edge determination using the approach proposed by Wei & Knopp (Reference Wei and Knopp2023). This illustration is based on DNS data from Coleman et al. (Reference Coleman, Rumsey and Spalart2018) at five different  $x$-stations. The horizontal axis represents the profiles of the mean streamwise velocity, mean wall-normal velocity, and Reynolds shear stress, all normalized by their maximum magnitude. The vertical axis represents the wall-normal location normalized by the computational domain height. The vertical dashed line indicates the value
 $0.01 R_{uv}|_{max}$, while the horizontal dashed line represents the corresponding wall-normal location, signifying the position of
 $\delta _e$.
Boundary-layer edge determination using the  $0.01 R_{uv}|_{max}$ location. (a–e) Profiles of
 $U$,
 $V$ and
 $R_{uv}$. (f–j) Profiles of
 $U$ near the boundary-layer edge. These plots use DNS data of NEPG TBLs by Coleman et al. (Reference Coleman, Rumsey and Spalart2018).

Figures 15(f–j) zoom in on the  $U$ profile near the boundary-layer edge. The horizontal dashed line represents the location of
 $\delta _e$ determined by the position of
 $0.01 R_{uv}|_{max}$. In cases where the pressure gradient is relatively small (
 $\textrm {ix} = 1000$ or 6100), the mean streamwise velocity outside the boundary layer remains nearly constant, as depicted in figures 15(f) or 15( j). However, when subjected to significant adverse or favourable pressure gradients (
 $\textrm {ix} = 2800$, 4200, 5000), the mean streamwise velocity outside the boundary layer exhibits distinct variations with respect to the wall-normal distance. This variability poses a challenge in determining accurately the location of
 $\delta _e$ using the traditional
 $99\,\% U_e$ method.
Figure 16 compares  $\delta _e$ determined via
 $U$ profiles,
 $R_{uv}$ profiles, and the diagnostic plot. Near the leading edge, where the streamwise velocity remains relatively constant outside the boundary layer,
 $\delta _e$ from
 $0.99U_{max}$ and the diagnostic plot method are similar, in line with Vinuesa et al. (Reference Vinuesa, Bobke, Örlü and Schlatter2016). However, the boundary-layer thickness from
 $0.01R_{uv}|_{max}$ locations is slightly larger, particularly near the domain outlet. Knopp et al. (Reference Knopp, Reuther, Novara, Schanz, Schülein, Schröder and Kähler2021) and Knopp (Reference Knopp2022) observed that
 $\delta _{99}$ aligns closely with other methods used in the literature for determining boundary-layer thickness, such as the composite law-of-the-wall/law-of-the-wake by Coles & Hirst (Reference Coles and Hirst1969) and the approach proposed by Coleman et al. (Reference Coleman, Rumsey and Spalart2018). However, noticeable differences can arise in determining the boundary-layer edge under strong pressure gradients, as indicated by the distinct values obtained from
 $0.99U_{max}$,
 $0.01R_{uv}|_{max}$ or the diagnostic plot. Despite the disparity in
 $\delta _e$ determined from
 $U$ profiles,
 $R_{uv}$ profiles and the diagnostic plot, the calculated displacements
 $\delta _1$ are remarkably similar (as demonstrated in figure 16), suggesting that the contribution near the boundary-layer edge to the integral of the
 $U$ deficit is negligible.
Comparison of  $\delta _e$ determination using
 $U$ profiles and
 $R_{uv}$ profiles, with DNS data of NEPG TBLs by Coleman et al. (Reference Coleman, Rumsey and Spalart2018).

Appendix B. Influence of $\delta _e$ and $U_e$ determination on (2.6) and (2.7)


The mathematical derivation of (2.6) and (2.7) does not impose any specific method for determining  $\delta _e$ or
 $U_e$. To demonstrate the independence of analytical equations accuracy from the definition of boundary-layer edge, we compare results from four
 $\delta _e$ determination methods:
 $0.95 U_{max}$,
 $0.99 U_{max}$,
 $0.01R_{uv}|_{max}$ and the diagnostic plot. Figure 17 displays
 $U_e$ and
 $V_e$ values from the boundary-layer edge determined using the four methods. As expected, the
 $U_e$ values determined from the
 $0.95U_{max}$ location are lower than those obtained from
 $0.99U_{max}$,
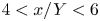
 $0.01R_{uv}|_{max}$ or the diagnostic plot. Under strong APG or FPG (
 $-7 < x/Y < -4$ or
 $4 < x/Y < 6$), the
 $0.99U_{max}$ locations are farther away from the wall compared to the
 $0.01R_{uv}|_{max}$ locations or the diagnostic plot (see figure 16), resulting in larger values for
 $V_e$ as well.
(a) Comparison of  $U_e$ determined at the locations of
 $0.95 U_{max}$,
 $0.99 U_{max}$,
 $0.01 R_{uv}|_{max}$, and using the diagnostic plot. (b) Comparison of
 $V_e$ using four boundary-layer edge determination methods. Plots use DNS data of NEPG TBLs by Coleman et al. (Reference Coleman, Rumsey and Spalart2018).

Comparing simulation data of  $V_e$ with analytical equation (2.6): (a) using
 $0.95 U_{max}$ locations for
 $V_e$,
 $U_e$ and
 $\delta _e$; (b) using
 $0.99 U_{max}$ locations for
 $V_e$,
 $U_e$ and
 $\delta _e$; (c) using the diagnostic plot for
 $V_e$,
 $U_e$ and
 $\delta _e$. (d) The DNS and analytical equation for
 $V_e$ with different definitions of boundary-layer edge; DNS data from Coleman et al. (Reference Coleman, Rumsey and Spalart2018) for NEPG TBLs.

Mean wall-normal velocity profiles at three  $x$-locations with corresponding boundary-layer edge markings: blue line indicates location of
 $0.95 U_{max}$; green line indicates location of
 $0.99 U_{max}$; magenta line indicates use of diagnostic plot; and red line indicates location of
 $0.01 R_{uv}|_{max}$. Plots use DNS data of NEPG TBLs by Coleman et al. (Reference Coleman, Rumsey and Spalart2018).

Normalized  $V/|V_e|$ obtained directly from simulation data (open symbols) and the sum of terms on the right-hand side of (2.7) (filled symbols): (a) using
 $0.95 U_{max}$ locations for
 $\delta _e$; (b) using
 $0.99 U_{max}$ locations for
 $\delta _e$; (c) using the diagnostic plot for
 $\delta _e$. (d) The DNS and analytical equation for
 $V$ with different definitions of boundary-layer edge; DNS data of NEPG TBLs by Coleman et al. (Reference Coleman, Rumsey and Spalart2018).

The analytical equation (2.6) for  $V_e$ involves three flow variables:
 $\delta _e(x)$,
 $\delta _1(x)$ and
 $U_e(x)$. In figure 4(b), the validity of (2.6) is substantiated by data obtained from
 $0.01 R_{uv}|_{max}$ locations. Figure 18 assesses the impact of various boundary-layer edge determination methods on the reliability of (2.6). In figures 18(a–c), the three flow variables in (2.6) are determined from locations of
 $0.95 U_{max}$,
 $0.99 U_{max}$ in the
 $U$ profiles, and the diagnostic plot, respectively. All the plots exhibit excellent agreement between directly simulated
 $V_e$ and the analytical equation (2.6), regardless of the boundary-layer edge determination method. Figure 18(d) compares
 $V_e$ simulated directly with
 $V_e$ calculated analytically from (2.6), using four boundary-layer edge determination methods.
Figure 16 highlights distinct  $\delta _e$ values arising from
 $0.95 U_{max}$ and
 $0.99 U_{max}$, particularly in regions of pronounced APG or FPG. Figure 19 displays mean wall-normal velocity at three
 $x$-locations (
 $\textrm {ix} = 2800$, 5000, 6100), illustrating differing
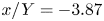
 $\delta _e$ values based on the four boundary-layer edge determination methods. At
 $\textrm {ix} = 2800$ (or
 $x/Y=-3.87$), for instance,
 $\delta _e$ from
 $0.99 U_{max}$ is approximately 2.1 times that from
 $0.95 U_{max}$, corresponding to a 1.5-fold higher
 $V_e$ value. Although numerical
 $\delta _e$ values prove sensitive to boundary-layer-edge determination methods,
 $U_e$ and
 $\delta _1$ values exhibit less sensitivity due to the gradual outer region
 $U$ variation, where its contribution to the velocity deficit integral within
 $\delta _1$ is also minor.
In figure 7, the boundary-layer edge determined using  $0.01 R_{uv}|_{max}$ is employed to substantiate the validity of the analytical equation (2.7) for
 $V/|V_e|$. Figure 20 evaluates the reliability of (2.7) using four different definitions of boundary-layer edge. All the figures exhibit excellent agreement between the analytical results and directly simulated
 $V/|V_e|$ values. This compelling agreement provides strong evidence to affirm that the analytical equation (2.7) derived in this study is independent of the specific choice of the boundary-layer edge. Such independence underscores the robustness and reliability of the analytical equation.
While the analytical equation (2.7) remains valid regardless of the boundary-layer edge determination methods, the shapes of the  $V/|V_e|$ versus
 $y/\delta _e$ profiles may differ as shown in figure 20. This discrepancy arises from the dependence of
 $\delta _e$ and
 $V_e$ values on the chosen boundary-layer edge, as illustrated in figures 16 and 17(b). Consequently, the normalized
 $V/|V_e|$ profiles, plotted against
 $y/\delta _e$, might display stretching or compression based on the selected
 $\delta _e$ and
 $V_e$, as evident in figure 20. Notably, figure 20(d) highlights that the profiles using
 $\delta _e$ determined through the approach proposed by Wei & Knopp (Reference Wei and Knopp2023) and the diagnostic plot by Vinuesa et al. (Reference Vinuesa, Bobke, Örlü and Schlatter2016) exhibit better collapse.





