INTRODUCTION
The Echinodermata is represented by some of the most colourful benthic marine invertebrates (Pawson, Reference Pawson, Zhang and Shear2007). As a consequence, there is a growing global interest in diverse echinoderm profit-making schemes, such as fishing, home aquaria and souvenirs, which have threatened some of these marine resources (Micael et al., Reference Micael, Alves, Costa and Jones2009). Echinoderms are distributed patchily, consisting of local populations inter-linked to greater or lesser extents by dispersal. The spatial scale of demographic connections between populations remains a central issue for marine conservation because, for example, of its implications for the effective definition of management boundaries and the design of marine protected area networks (Botsford et al., Reference Botsford, Micheli and Hastings2003). Dispersal is also a key element warranting population resilience following disturbance (Palumbi, Reference Palumbi2003; Bellwood et al., Reference Bellwood, Hughes, Folke and Nystrom2004; Costantini et al., Reference Costantini, Fauvelot and Abbiati2007). Although, globally, several seastar species have been the target of population genetic studies focusing on mitochondrial and/or nuclear markers (Hunt, Reference Hunt1993; Williams & Benzie, Reference Williams and Benzie1998; Matsuoka & Asano, Reference Matsuoka and Asano2003; Waters et al., Reference Waters, O'Loughlin and Roy2004; Colgan et al., Reference Colgan, Byrne, Rickard and Castro2005; Harley et al., Reference Harley, Pankey, Wares, Grosberg and Wonham2006; Harper et al., Reference Harper, Addison and Hart2007; Gerard et al., Reference Gerard, Roby, Chevalier, Thomassin, Chenuil and Feral2008; Keever et al., Reference Keever, Sunday, Puritz, Addison, Toonen, Grosberg and Hart2009), only three studies have been conducted in the Atlantic–Mediterranean region (Baus et al., Reference Baus, Darrock and Bruford2005; Zulliger et al., Reference Zulliger, Tanner, Ruch and Ribi2009; Pérez-Portela et al., Reference Pérez-Portela, Villamor and Almada2010). Beyond the geographical division of the Atlantic and Mediterranean basins, the Strait of Gibraltar has been shown to play a major role in shaping diversity in marine species, with an amphi-Atlantic–Mediterranean distribution (Borsa et al., Reference Borsa, Blanquer and Berrebi1997; Launey et al., Reference Launey, Ledu, Boudry, Bonhomme and Naciri-Graven2002; Diaz-Almela et al., Reference Diaz-Almela, Boudry, Launey, Bonhomme and Lapegue2004; Duran et al., Reference Duran, Palacin, Becerro, Turon and Giribet2004; Stamatis et al., Reference Stamatis, Triantafyllidis, Moutou and Mamuris2004, Reference Stamatis, Triantafyllidis, Moutou and Mamuris2006; Saavedra & Pena, Reference Saavedra and Pena2005; Calderón et al., Reference Calderón, Giribet and Turon2008). Baus et al. (Reference Baus, Darrock and Bruford2005) identified contrasting genetic structures between populations of Asterina gibbosa (Pennant, 1777) from Atlantic waters with gene flow occurring among populations. Conspecifics from the Mediterranean had a much more restricted gene flow. Zulliger et al. (Reference Zulliger, Tanner, Ruch and Ribi2009) showed a clear pattern of isolation-by-distance in Astropecten aranciacus (Linnaeus, 1758) and concluded that larval dispersal was somewhat limited even within the basins of the Atlantic and the east and west Mediterranean. Based on sequences of the cytochrome c oxidase gene, Pérez-Portela et al. (Reference Pérez-Portela, Villamor and Almada2010) identified an apparent panmixia of Marthasterias glacialis (Linnaeus, 1758) along the Iberian Peninsula coast and the Mediterranean basin, but a distinctive genetic structure, with a high number of private haplotypes and significant pairwise genetic differentiation, in the United Kingdom (Plymouth) and the Azores edge populations. Two lineages were identified: one common to the Atlantic and Mediterranean Sea, the other exclusively Mediterranean.
In contrast to the three previous studied species, M. glacialis and A. aranciacus with a long planktotrophic pattern (up to 3 months for M. glacialis (Barker & Nichols, Reference Barker and Nichols1983; McEdward & Janies, Reference McEdward and Janies1993)) and A. gibbosa, which has direct demersal development with no planktonic larval stage, Ophidiaster ophidianus (Lamarck, 1816) has a lecithotrophic larva (J. Micael, personal observation) that is usually characterized by a short developmental period, lasting from a few days to a few weeks (McEdward & Janies, Reference McEdward and Janies1993), associated with indirect development and no larval food up-take (Strathmann, Reference Strathmann1993). References to the distribution of this latter species include records from the Mediterranean (Koehler, Reference Koehler1924; Tortonese, Reference Tortonese1965; Grippa, Reference Grippa1990; Domínguez-Alonso et al., Reference Domínguez-Alonso, Remón, Villena, Ramos, Carnevali and Bonosoro1999; Cebrián & Ballesteros, Reference Cebrián and Ballesteros2004; Tanti & Schembri, Reference Tanti and Schembri2006), the Gulf of Guinea, Cape Verde, Canary Islands, Madeira and the Azores (Nobre, Reference Nobre1938; Marques, Reference Marques1983; Clark & Downey, Reference Clark and Downey1992; Pereira, Reference Pereira1997; Hansson, Reference Hansson, Costello, Emblow and White1999; Pérez-Ruzafa et al., Reference Pérez-Ruzafa, Entrambasaguas and Bacallado1999; Micael et al., Reference Micael, Rodrigues, Barreto, Alves, Jones and Costa2011), as well the central islands of the southern Atlantic. The only two comprehensive studies of O. ophidianus have been on its reproductive biology, wherein it was shown that gonads and pyloric caeca undergo annual development, reflecting a seasonal reproductive strategy by this species in the Azores Archipelago (Micael et al., Reference Micael, Rodrigues, Barreto, Alves, Jones and Costa2011), and population parameters at the north-western periphery of its range, also in the Azores, where it showed a marked seasonal trend in abundance and size–depth distribution (Micael et al., Reference Micael, Alves and Costa2013). Here too, the species is the most common seastar on shallow rocky bottoms (Marques, Reference Marques1983).
The present study focuses on the genetic diversity of O. ophidianus as the first seastar species with lecithotrophic larvae to be examined in the Atlantic–Mediterranean region. The species is strictly protected in the Mediterranean Sea by the Barcelona Convention (92/43/CEE) and is considered vulnerable in Spain (Catálogo Nacional de Especies Amenazadas, 2007). The genetic diversity of O. ophidianus in Azoren waters has herein been investigated using mitochondrial and nuclear markers in order to reveal its phylogeography and the level of genetic differentiation between populations from this archipelago and out-groups. Comparison of mtDNA and nuclear markers allows a more comprehensive investigation of genetic diversity, as markers of these two physically un-linked genomes do not always show congruent patterns (Hansen et al., Reference Hansen, Mensberg and Berg1999; Lemaire et al., Reference Lemaire, Versini and Bonhomme2005; Costantini et al., Reference Costantini, Fauvelot and Abbiati2007). The obtained data provide information to assist in the management and conservation of this vulnerable marine invertebrate.
MATERIALS AND METHODS
Study area
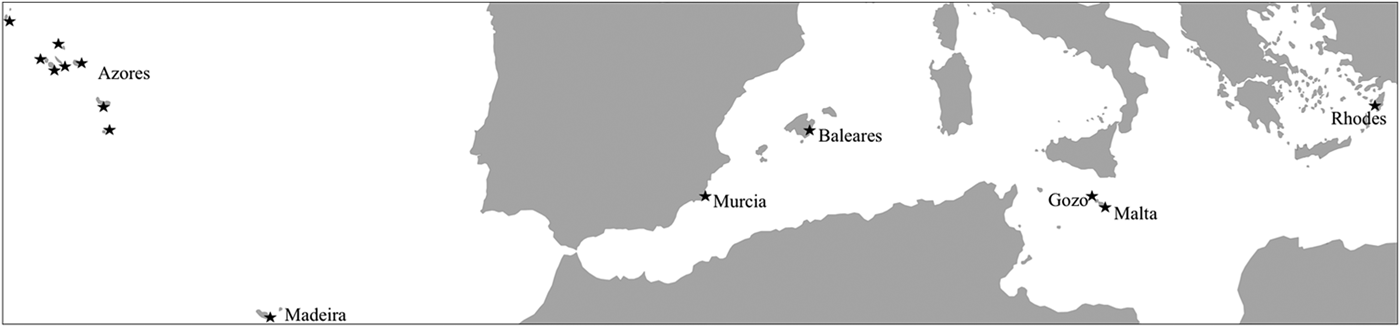
The Azores Archipelago (Figure 1) is located in the north-east Atlantic Ocean, between latitudes 36°55′ and 39°43′N and longitudes 24°46′ and 31°16′W, 1500 km from Europe and 1900 km from North America. The Azores are a set of nine islands that cluster geographically into three groups: Santa Maria and São Miguel on the eastern group; Terceira, Graciosa, São Jorge, Pico and Faial on the central group; and Corvo and Flores on the western group.
Map of the sampling locations for Ophidiaster ophidianus.

Field sampling
A total of 99 individuals of O. ophidianus were sampled in several localities that encompass a wide range of the species’ distribution throughout the Atlantic and the Mediterranean Sea. Sixty-seven individuals were collected from eight of the nine islands of the Azores (the exception was Corvo), and seven and 25 out-group individuals from Madeira and the Mediteranean Sea, including three localities from the central Mediterranean—Malta, Gozo and Rhodes—and two from the western Mediterranean—the Balearics and Murcia—(Figure 1 and Table 1), respectively.
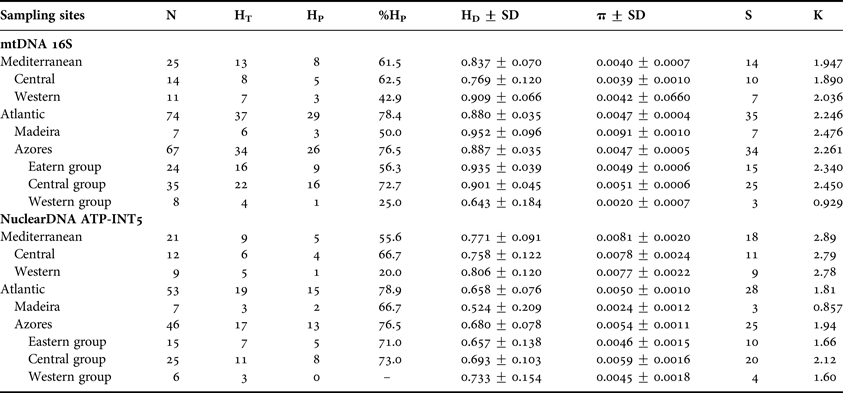
Descriptive statistics for the studied populations of Ophidiaster ophidianus. Sample size, N; number of total haplotypes, HT; number of private haplotypes, HP; percentage of private haplotypes, %HP haplotype diversity, HD; nucleotide diversity, π; number of substitutions, S; and mean pairwise nucleotide differences, for both mitochondrial and nuclear sequences.
All samples were collected at a maximum depth of 25 m using SCUBA during 2007–2010. Three pairs of podia were removed from each individual and preserved in absolute ethanol for further processing. Such individuals were subsequently returned alive to their sampling habitat.
Genetic data
Podia tissues were digested using Proteinase K in an STE + SDS solution (0.1 M NaCl, 0.05 M Tris-HCl pH 7.5, 0.001 M EDTA disodium, 1.5% SDS); proteins were precipitated using a saturated NaCl solution (5 M, pH8.0). Total DNA was precipitated using cold isopropanol and washed with ethanol before re-suspension in Low TE (modified from Sambrook et al., Reference Sambrook, Fritsch and Maniatis1989).
MtDNA fragments of the 16S ribosomal RNA region were amplified using the forward primer E12Sa and the reverse primer E16Sb as described in Smith et al. (Reference Smith, Arndt, Gorski and Fajber1993). The nuclear intron 5 of the protein-coding gene ATP Synthase Subunit β (ATP-INT5) was amplified using the primers ATPSB5F and ATPSB5R as described by Jarman et al. (Reference Jarman, Ward and Elliott2002) and modified by Foltz et al. (Reference Foltz, Nguyen, Nguyen and Kiger2007). Insertion/deletion events were excluded from the sequence analyses, as suggested by Romano & Palumbi (Reference Romano and Palumbi1997).
Polymerase chain reactions (PCRs) were performed in 10 μl volumes containing 3.9 μl H2O ultrapure (BioChemika, Sigma-Aldrich), 0.3 μl of each primer, 5 μl of amplification mix (Qiagen multiplex PCR kit) and 0.5 μl of DNA template (approximately 50 ng). Amplifications were carried out in a Mastercycler Eppendorf gradient thermal cycler. Cycling parameters consisted of an initial denaturation step of 94°C/2 min followed by 36 cycles of 94°C/30 s, with an annealing temperature of 60°C/90 s and 72°C/1 min with a final extension step at 72°C/10 min. PCR products were visualized on 1.5% agarose gels stained with SYBR green dye. Excess dNTPs and unincorporated primers were removed from the PCR products using Exo-SAP-IT (USB) following the manufacturer's protocol. MtDNA and nuclear DNA fragments were sequenced using the reverse and the forward primers, respectively. Sequencing was carried out by STABVIDA (Lisbon, Portugal). Sequences were edited and aligned in Geneious Pro 4.7 software (Drummond et al., Reference Drummond, Ashton, Cheung, Heled, Kearse, Moir, Stones-Havas, Thierer and Wilson2009). The genetic analyses of both markers were performed separately.
Data analysis
Numbers of polymorphic sites (S), total haplotypes (HT), private haplotypes (HP), nucleotide (π; Nei, Reference Nei1987) and haplotype diversity (HD; Nei, Reference Nei1987), the θ mutation parameter corresponding to 4 Nμ, where N is the effective population size and μ is the neutral mutation rate per generation (Nei, Reference Nei1987), and the average number of pairwise nucleotide differences per site (k; Tajima, Reference Tajima1983), were calculated in DnaSP v5.10.00 (Librado & Rozas, Reference Librado and Rozas2009). Genetic structure was visualized with a statistical parsimony haplotype network created using TCS 1.21 (Clement et al., Reference Clement, Posada and Crandall2000), with a 95% connection limit between haplotypes. Gaps were treated as missing data.
Partitioning of genetic variability within and between samples were assessed by an analysis of molecular variance (AMOVA; Excoffier et al., Reference Excoffier, Smouse and Quattro1992) based on Euclidean distances between haplotypes, as implemented in Arlequin v.3.1 (Schneider et al., Reference Schneider, Roessli and Excoffier2000). Different geographical scales were considered: (1) no regional grouping, that is, all the regions were considered as a group; and (2) two groups corresponded to the two studied Atlantic and Mediterranean, basins. Population pairwise F ST estimates (Michalakis & Excoffier, Reference Michalakis and Excoffier1996) were calculated using Arlequin for mtDNA and nuclearDNA data applying 16,000 permutations.
Tajima's D (Tajima, Reference Tajima1989), Fu's FS (Fu, Reference Fu1997) and R2 (Ramos-Onsins & Rozas, Reference Ramos-Onsins and Rozas2002) neutrality tests were conducted using DnaSP v.5.10.00 (Librado & Rozas, Reference Librado and Rozas2009). Significantly negative values for Tajima's D and Fu's FS reflect an excess of rare polymorphisms in a population, which indicates either positive selection or a recent increase in population size (Aris-Brosou & Excoffier, Reference Aris-Brosou and Excoffier1996). The significance of the results was determined by coalescent simulation (Hudson, Reference Hudson, Futuyma and Antonovics1990) using 10,000 simulated samples. Samples were generated under the infinite site model using Poisson distributed mutation and no recombination.
Recent demographic expansion was tested through pairwise mismatch distributions and the expected values in a stable population (with constant population size and in growing or declining populations). The expansion coefficient was obtained by the ratio between S and k (Peck & Congdon, Reference Peck and Congdon2004): large values indicate recent population expansions and small values indicate constant long-term population size (von Haeseler et al., Reference von, Sajantila and Paabo1996). The estimation of the approximate time of expansion of O. ophidianus was calculated through the equation:
 $${\rm t} = {\rm T}/2{\rm u}\;(\hbox{Rogers} \;\& \;\hbox{Harpending}, \,1992),$$
where t is the number of generations since the time of expansion for the populations from the Atlantic and Mediterranean Sea, T is the expected value for population size changes (T = 2.172, taken from DnaSP v5.10.00; Librado & Rozas, Reference Librado and Rozas2009) and u is the mutation rate per sequence and per generation. A mutation rate of 0.5% per nucleotide per million years for the 16S gene was used, which were calculated previously for echinoids (Chenuil & Féral, Reference Chenuil, Féral, Féral and David2003). Although there are no data available on O. ophidianus sexual maturation age, we consider that this occurs after one year, because individuals with 6.2 cm arm length (measured from the madreporite to the tip of each arm) were sexually mature (Micael et al., Reference Micael, Rodrigues, Barreto, Alves, Jones and Costa2011) and considering the rich food availability and seawater temperatures characteristic of a temperate zone such as the Azores Archipelago, it seems that this size could reasonably be achieved after 1 yr.
A Bayesian phylogenetic tree was built for both genes independently, using BEAST 1.7.12 (Drummond et al., Reference Drummond, Suchard, Xie and Rambaut2012). The best-fit evolutionary model (see Supplementary material Appendix 1), calculated with jModelTest 0.1.1, was selected using the Akaike information criteria (Posada, Reference Posada2008). The length of the Markov Chain Monte Carlo (MCMC) was set to 10,000,000 generations and log parameters were sampled every 1000th generation. A consensus tree with posterior probabilities was obtained from the tree output file using TreeAnnotator v.1.4.8 (implemented in BEAST package) with the burn-in parameter set to 50 corresponding to the initial 50,000 generations of the MCMC chain. The output consensus tree was visualized in FigTree v.1.2.2 (Rambaut, Reference Rambaut2008). For the out-groups, one sample of Patiria pectinifera available in GenBank (Accession number NC001627) was used for the mitochondrial 16S gene, and one sample of Asterias rubens available in GenBank (Accession number EF134900) for the ATP nuclear gene.
RESULTS
Genetic diversity
Ninety-nine mtDNA (16S) sequences of 480 bp each revealed 41 polymorphic sites (8.5%), 19 of which were parsimony informative. Forty-five haplotypes were identified (GenBank accession numbers KJ634856–KJ634954; Supplementary material Appendix 2): haplotype H1 represented 35% of the sampled individuals and was shared by all regions. Haplotype H8 was shared between the Azores, Madeira and the Mediterranean Sea, while haplotypes H5, H7 and H9 were shared only between the Azores and the Mediterranean Sea; five haplotypes (H11, H18, H19, H24 and H32) were identified from more than one individual from the same region; and the remaining 35 haplotypes were obtained from single individuals. In the Azores, 26 haplotypes were obtained from single individuals, and haplotype diversity ranged from 0.64 on the western group to 0.901 and 0.935 on the central and eastern groups, respectively, while the nucleotide diversity varied from 0.0020 on the western group and 0.0051 and 00.49 on the central and eastern groups, respectively (Table 1).
Seventy-four nuclear DNA (ATP-INT5) sequences of 359 bp each revealed 35 polymorphic sites (9.8%), of which 22 were parsimony informative. Twenty-five haplotypes were identified (GenBank accession numbers KJ634955–KJ635028; Supplementary material Appendix 2): haplotype H3 was shared by all sampled locations and represented 55% of the sampled individuals; two haplotypes (H7 and H9) were shared between the Azores and the Mediterranean Sea; three haplotypes (H1, H6 and H14) were found in more than one individual from the same region; the remaining 19 haplotypes were found in single sample location. Haplotype diversity ranged from 0.657 on the eastern group to 0.693 and 0.733 on the central and western groups, respectively, while the nucleotide diversity varied from 0.0045 on the western group and 0.0046 and 00.59 on the eastern and central groups, respectively.
Haplotype networks and trees
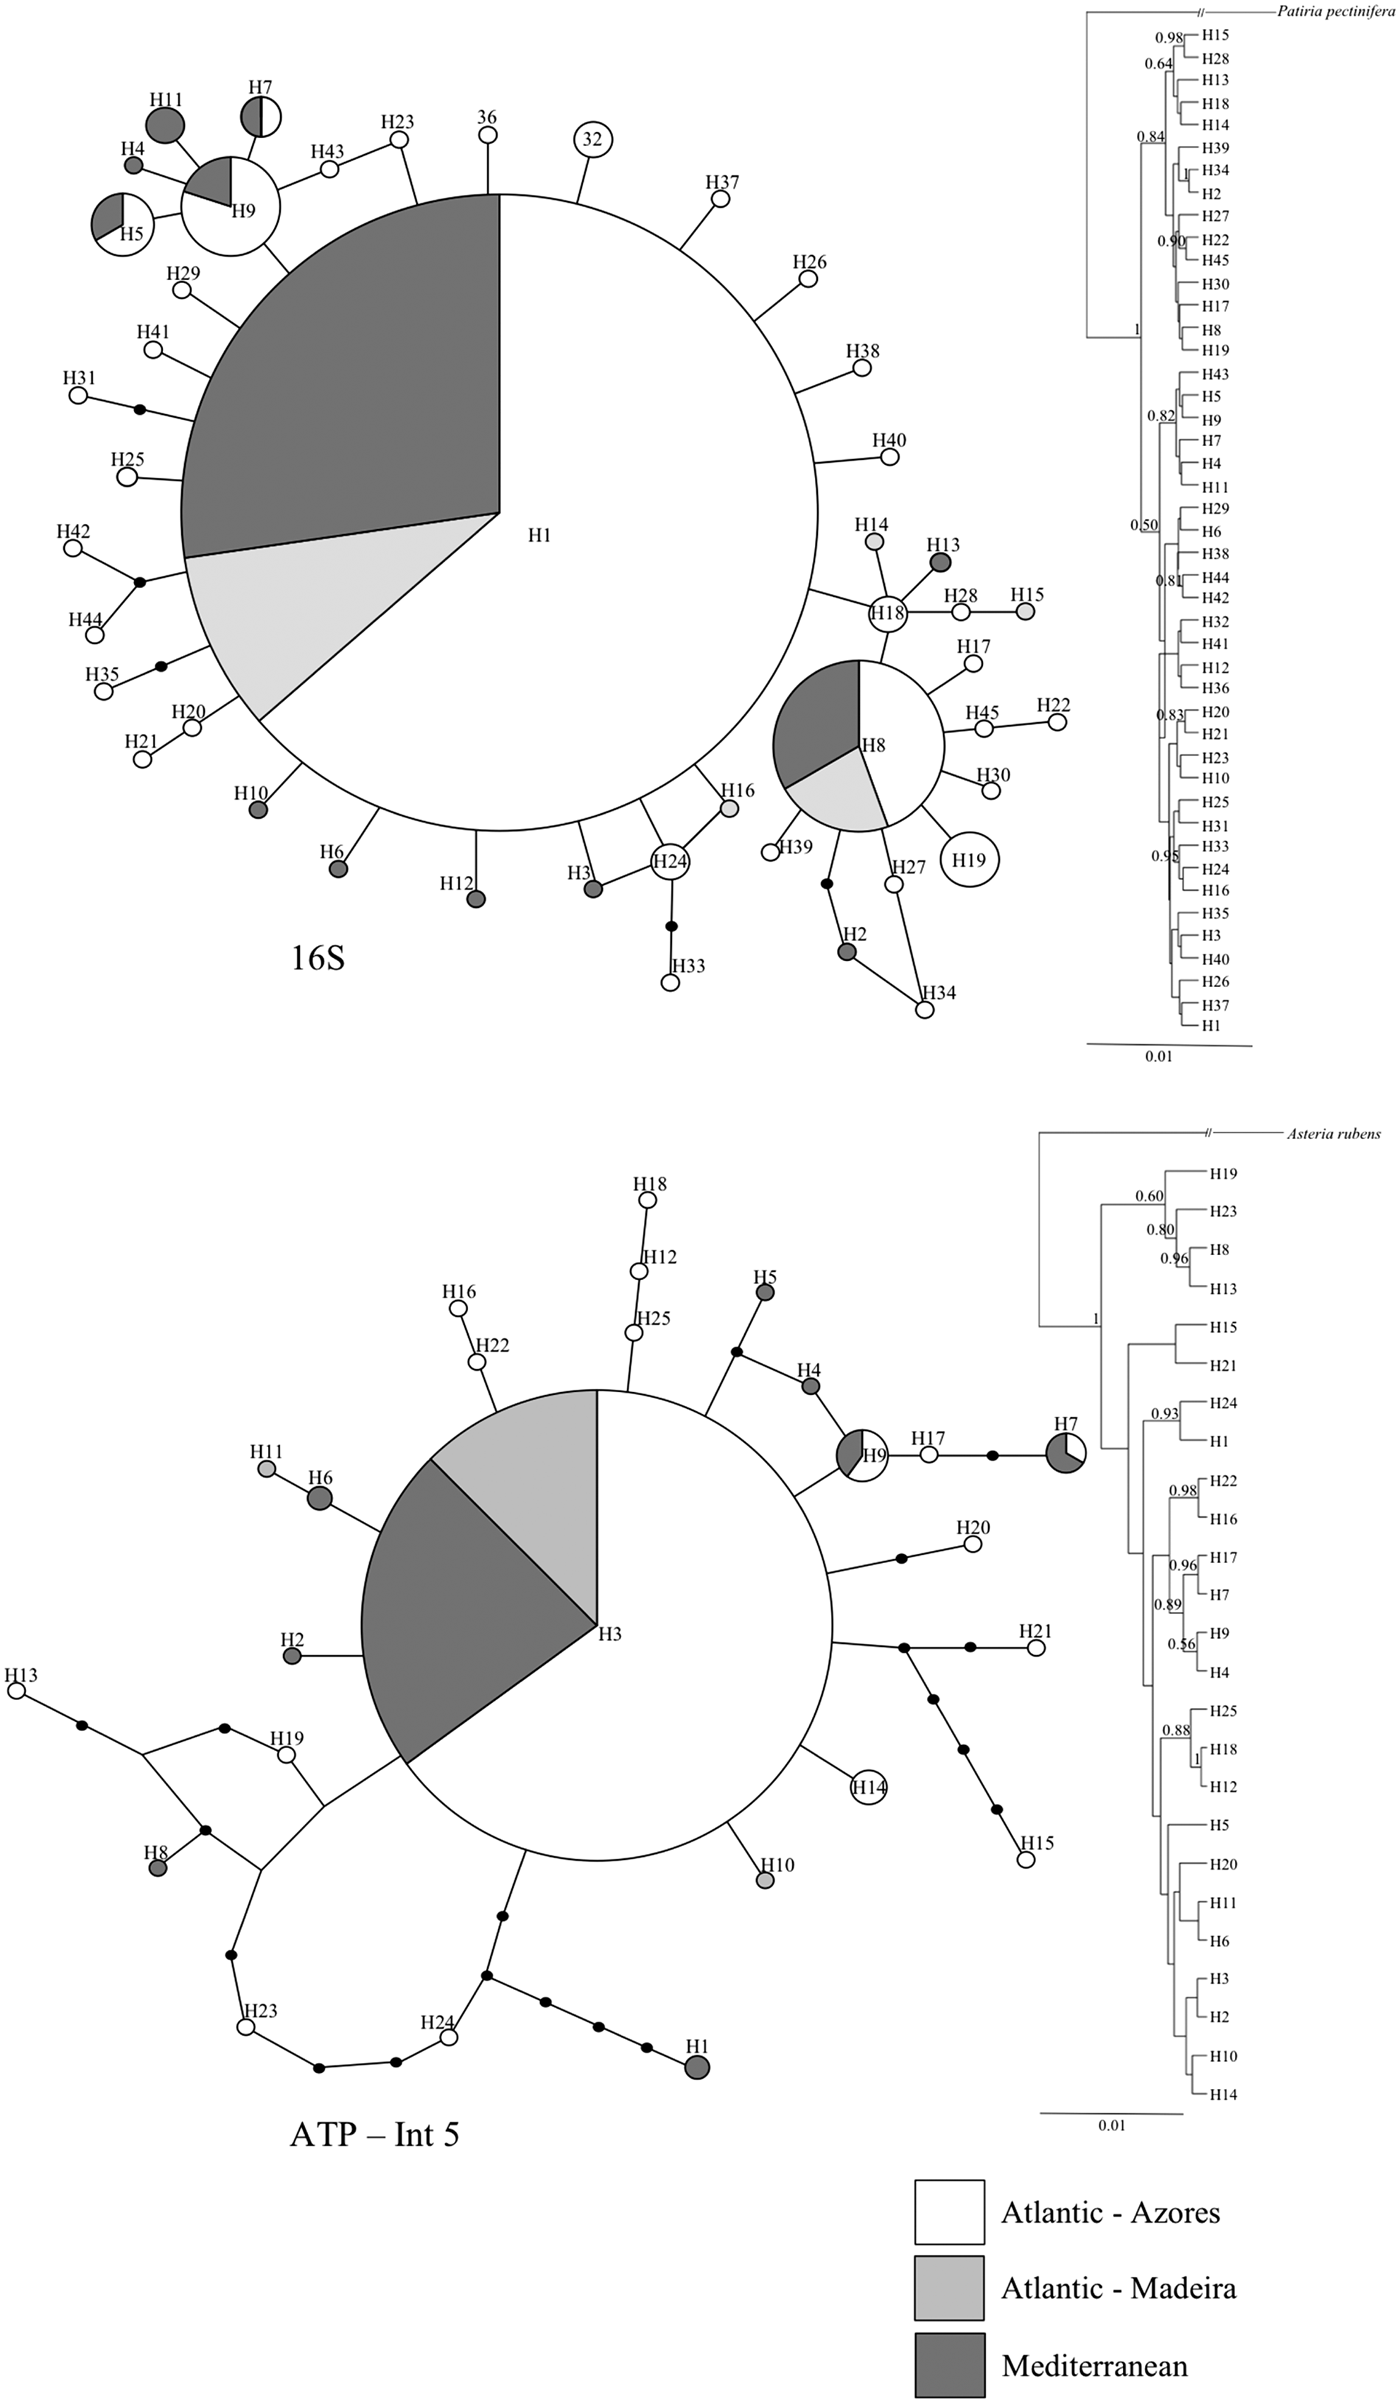
The parsimony haplotype networks for both the 16S and the ATP-INT5 genes showed a similar ‘star’ shape typical of recent expansions (Figure 2). The mtDNA network hypothesized the existence of one un-sampled node and the nuclear DNA network hypothesized the existence of three un-sampled nodes with a confidence level of 95%. Both networks showed that all samples from the Azores are closely related to the samples from Madeira and the Mediterranean Sea. The haplotype represented by the biggest circle was considered the most probable ancestral; it was once represented in every sampling location and assigned to an interior node (Figure 2).
Parsimony haplotype networks (on the left), depicting the relationships among Ophidiaster ophidianus haplotypes. Each circle represents a haplotype with the size proportional to its frequency. Dots on lines represent the number of mutational steps between two haplotypes. Bayesian inference phylogenetic tree (on the right) with values of posterior probabilities indicated when >0.5.
For both markers, each of the Bayesian phylogenetic trees reconstructed from the haplotypes showed that samples from the Azores form a monophyletic group with samples from Madeira and the Mediterranean Sea, where relationships between the different clades were strongly supported and revealed the same branching pattern of the haplotype networks (Figure 2).
Population structure
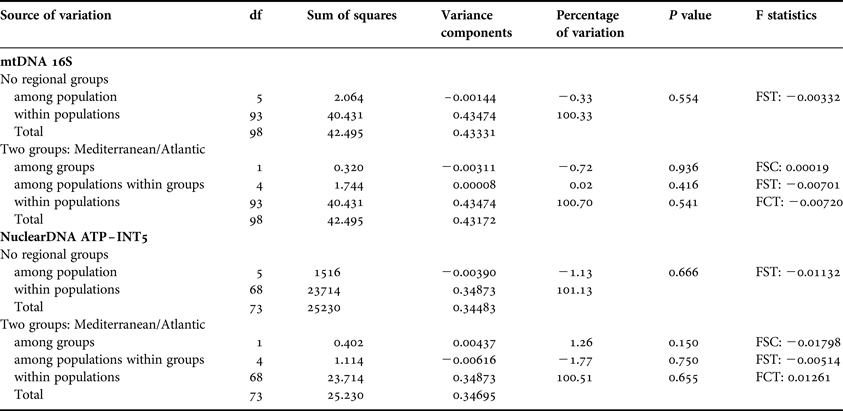
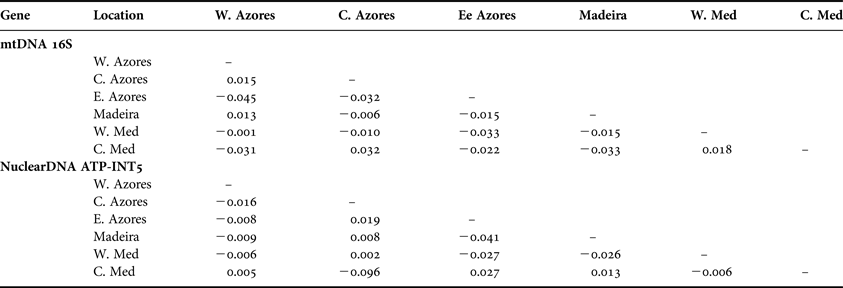
The analyses of molecular variance, for mtDNA and nuclear DNA datasets, showed that variation among individuals within locations explained the proportion of the observed variance (Table 2). The F ST values were not significant among the Azores islands and between the Azores and the out-group, revealing similarity at the genetic level (Table 3).
Analysis of molecular variance for mtDNA and nuclear DNA sequences of Ophidiaster ophidianus, indicating the percentage of variance among groups and populations.
Pairwise genetic differentiation statistics (F ST) between Ophidiaster ophidianus populations.
Demographic events
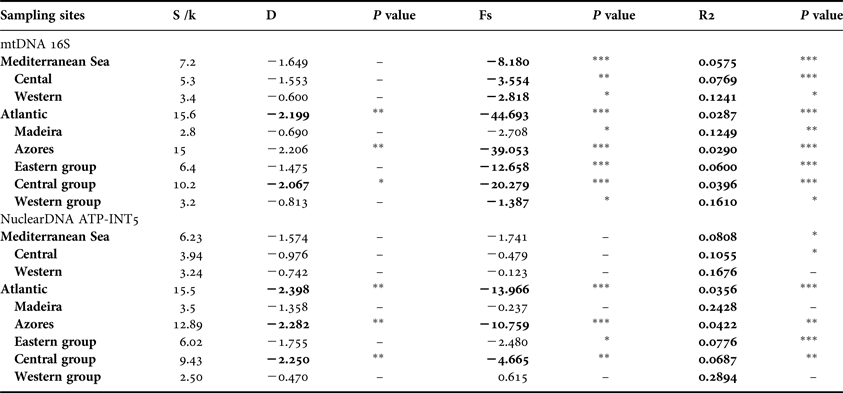
The expansion coefficient (S/k) showed higher values for the Azores Archipelago than the Mediterranean, both for mtDNA and nuclear DNA (Table 4), revealing evidence for population expansion in the Azores. The Azores also had significant negative values of Fu's FS and significant positive values of R2 in the 16S marker, revealing a recent population expansion. This evolutionary occurrence was also evident with the Tajima's D model (Table 4). Azores sampling locations also showed significant negative values of Tajima's D, Fu's FS and R2 testes for the ATP-INT5 marker—supporting the theory of a recent population expansion of O. ophidianus from the Mediterranean Sea to the Atlantic Ocean (Table 4).
Neutrality testes for Ophidiaster ophidianus data. Expansion coefficient (S/k); Tajima's D test, D; Fu's test, Fs and R2. Significance levels are denoted in bold (P < 0.05 *, P < 0.01 **, P < 0.001 ***).
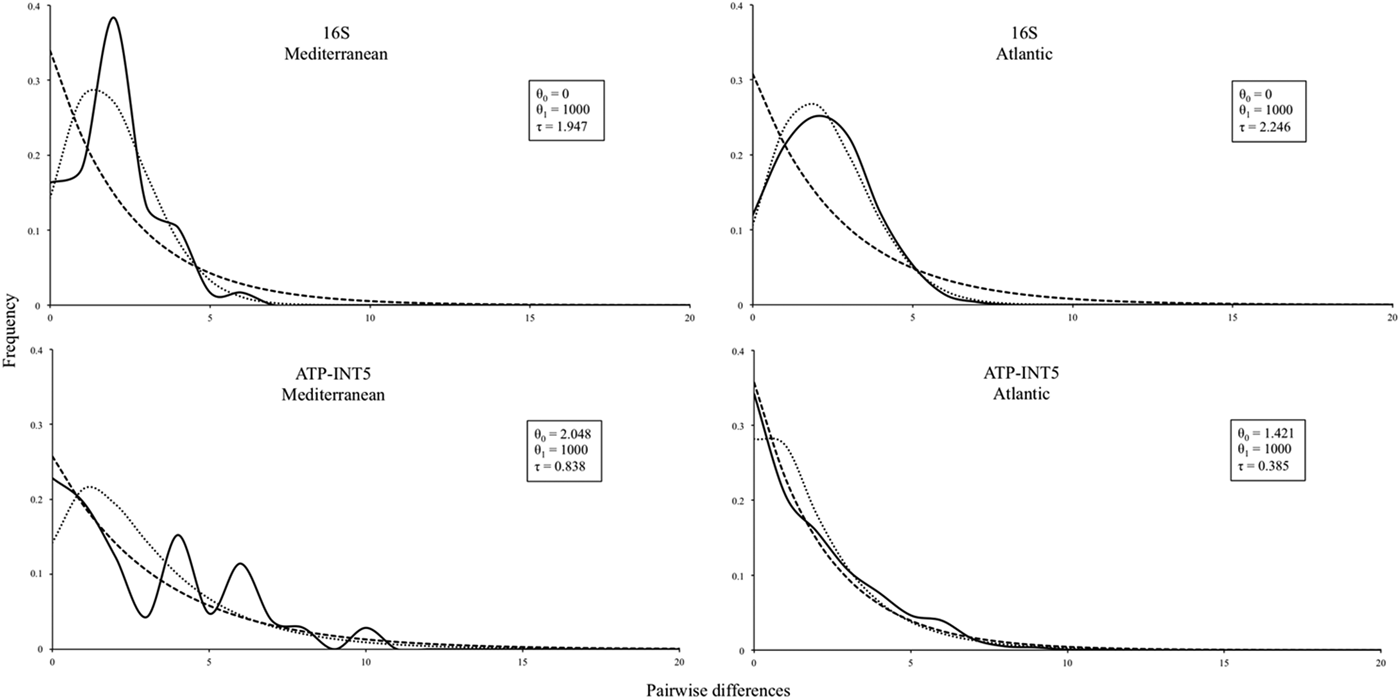
The pairwise mismatch distribution of the 16S mtDNA gene for the Atlantic showed a unimodal shape, typical for recent population expansions (Figure 3, top). In the case of ATP-INT5, the pairwise mismatch distribution (Figure 3, bottom) also had a clear unimodal shape for the Azores, and a multimodal shape for the Mediterranean, that could indicate some structure resulting from a long-term stable population size.
Pairwise mismatch distributions of DNA genes sequence data of Ophidiaster ophidianus. — observed; - - - - - expected in a constant population size; …….. expected in an expansion population size. In the box, model for expected values in a population growth/decline: θ0, theta initial; θ1, theta final; T, tau.
The approximate time of expansion from the Mediterranean to the Azores (and probably to Madeira), was estimated to be around 226,250 yr ago using a mutation rate of 0.5% per million years for the 16S gene, previously calculated by Chenuil & Féral (Reference Chenuil, Féral, Féral and David2003) who tentatively identified this as the generation time (considering one year per generation).
DISCUSSION
Our study reveals the genetic variability and the lack of structure of Ophidiaster ophidianus on the Azores. Despite the high number of private haplotypes found among the different populations for both the mtDNA and nuclear genes, there is a lack of genetic differentiation among the seastar population from the Azores and the out-groups. The major haplotypes shared among all the regions and the molecular variance analysis for the two markers did not reveal significant differences between the Atlantic and the Mediterranean basins. Our results suggest that individuals from the Azores form a monophyletic group together with Madeira and the Mediterranean samples, revealing a unique lineage of O. ophidianus spread along the Atlantic and the Mediterranean, as evidenced by the Bayesian phylogenetic trees and in the parsimony haplotype networks. Although the Mediterranean Sea used to be the distributional focus of O. ophidianus (Koehler, Reference Koehler1924), the species is now strictly protected and less abundant than in the Azores (Micael et al., Reference Micael, Alves and Costa2013). The Azores Archipelago is, today, a probable refuge for O. ophidianus, and constitutes a location where this species is the most widely distributed asteroid species on the coastal bedrock (Marques, Reference Marques1983), currently not threatened and easiest to find.
The lack of an exclusive lineage from the Mediterranean Sea is, moreover, similar to the genetic pattern that was identified for the echinoid Arbacia lixula by Wangensteen et al. (Reference Wangensteen, Turon, Pérez-Portela and Palacín2012), and is in contrast with other echinoderm species with similar distribution, such as the seastar Marthasterias glacialis (Pérez-Portela et al., Reference Pérez-Portela, Villamor and Almada2010), the sea cucumber Holothuria mammata (Borrero-Pérez et al., Reference Borrero-Pérez, González-Wangüemert, Marcos and Pérez-Ruzafa2011) and the sea urchin Paracentrotus lividus (Calderón et al., Reference Calderón, Giribet and Turon2008; Maltagliati et al., Reference Maltagliati, Di Giuseppe, Barbieri, Castelli and Dini2010), which present lineages exclusive from the Mediterranean. Future studies, however, should collect more samples from the Mediterranean Sea in order to clarify this issue and to shed light on any possible bias related to small sample sizes.
Our results also suggest the existence of distinctive periods of strong gene flow between the Azores and other regions followed by periods when gene flow and/or larval exchange throughout the same area was low, since a high number of private haplotypes was retained. Gene flow can be restricted by marine currents, in particular strong ones such as the Azores Current which forms from a southern branch of the Gulf Stream and passes just south of the Azores splitting into two parts, with a meandering flow along 35°N heading for the Gulf of Cadiz and the Strait of Gibraltar and a second part moving southward and then turning eastward along 30°N (Johnson & Stevens, Reference Johnson and Stevens2000). Some of the water that reaches the Gulf of Cadiz is entrained in the Gibraltar outflow of Mediterranean water, which spreads at depth away from the Strait of Gibraltar, as summarized by Baringer & Price (Reference Baringer and Price1997). There is also the Portuguese current, which flows along the east Atlantic coast from northern Portugal southwards to northern Africa, being a possible marine barrier to gene flow from the Mediterranean and east Atlantic coast to the archipelagos of Madeira and the Azores. Moreover, the Mediterranean out-flow tends to stratify in the Atlantic Ocean at depths of between 600 and 1400 m due to its greater density (Mougenot & Vanney, Reference Mougenot and Vanney1982) and might impede larval dispersal to the Atlantic islands considered in this study. Conversely, larvae dispersing from Madeira are prone to be directed southward along the Canary Current, restricting gene-flow to the east Atlantic coast and the Mediterranean (Zulliger et al., Reference Zulliger, Tanner, Ruch and Ribi2009). In the Mediterranean basin beyond the narrow and shallow passage of the Strait of Gibraltar, in the Alboran Sea and along the Almería–Oran front, there is also the complexity of the northern Mediterranean coastline, as well as the presence of numerous islands which create many small eddies and other local currents (Send et al., Reference Send, Font, Krahmann, Millot, Rhein and Tintoré1999).
Although marine currents can constitute a strong barrier to dispersal, they are not static over time. Johnson & Stevens (Reference Johnson and Stevens2000) have demonstrated, for example, that the flow just to the east of Madeira can be either westerly or easterly depending on eddies on the edge of both the Azores Current and the Canary Current—the variation being mostly seasonal (Johnson & Stevens, Reference Johnson and Stevens2000). Seasonality of fine scale current patterns contrast with reproductive patterns of benthic marine invertebrates with continuous and discontinuous distributions and must be investigated. Nevertheless, the re-establishment of marine currents during recent interglacial periods could have allowed secondary contacts between populations from the Atlantic and the Mediterranean.
The high value of the expansion coefficient, reinforced by the significant negative values of the majority of the neutrality tests for the mtDNA gene suggests a recent population expansion into the Azores, and probably to the Atlantic basin. A similar result was obtained by Zulliger et al. (Reference Zulliger, Tanner, Ruch and Ribi2009) for Astropecten aranciacus from Madeira. The unimodal pairwise mismatch distribution, typical of recent expansions (Rogers, Reference Rogers1995), and the star topologies of the minimum spanning networks, where the most common haplotypes are shared among all the regions, also corroborate the idea of a recent and rapid range expansion to the Azores. These results are similar to those obtained for Arbacia lixula from the Macaronesian archipelagos in the Atlantic (Wangensteen et al., Reference Wangensteen, Turon, Pérez-Portela and Palacín2012).
The nuclear gene revealed the existence of a certain degree of genetic structure in the Mediterranean Basin, which is visible in the multimodal pairwise mismatch distribution. The higher genetic diversity revealed by the nuclear gene, when compared with the mtDNA gene, was expected given that ancestral polymorphisms persist longer in the nuclear DNA than in mtDNA (Brown et al., Reference Brown, George and Wilson1979). Thus, in contrast to the Mediterranean, the Azores did not show such a genetic structure, revealing a unimodal pairwise mismatch and significant negative values of neutrality tests, which corroborates the hypothesis of a recent and rapid expansion of O. ophidianus to the Azores Archipelago, probably via Madeira Island, since they also share the major haplotypes. In order to detect the radiation of this species in its global geographical expansion range, an additional dataset of neutral variation in fast evolving regions (e.g. microsatellites) is needed.
The estimated time of 226,250 yr ago for the first expansion of O. ophidianus to the Azores may correspond to the beginning of a constant gene flow between the Mediterranean Sea and the Atlantic and this probably still occurs. This gene flow could be reduced and even stopped several times due to the Pleistocene glaciations, since these events have been shown to have a great effect in the geographical distribution of the genetic diversity of Atlantic warm-water species (Almada et al., Reference Almada, Oliveira, Gonçalves, Almeida, Santos and Wirtz2001; Schiebel et al., Reference Schiebel, Schmuker, Alves and Hemleben2002; Domingues et al., Reference Domingues, Santos, Brito and Almada2006, Reference Domingues, Santos, Brito, Alexandrou and Almada2007), and could be the reason for the existence of several private haplotypes in O. ophidianus populations.
In conclusion, our study provides new insights into the genetic structure and the phylogeography of O. ophidianus on the Azores Archipelago, which presents a lack of genetic structure and represents a monophyletic group with Madeira and the Mediterranean, revealing the existence of the same lineage in both basins. The results also suggest a recent and rapid expansion of this species from the Mediterranean to the Azores and probably to Madeira, and the existence of distinctive periods of gene flow followed by periods of either low or non-existent gene flow. The nuclear gene supported the mtDNA results and the comparison of mitochondrial and nuclear data provides a more complete picture of genetic differentiation, allowing for a more comprehensive data analysis and interpretation.
When formulating guidelines, for the conservation and management of O. ophidianus in the Mediterranean, the present study should be taken into consideration, since it seems evident that the Azores population could act as a re-stocking population for this protected species. Moreover, the relative percentage of observed private haplotypes is higher in the Azores Archipelago than in the Mediterranean Sea. Although this result is only exploratory, due to the total number of sampled individuals and as the sampling effort is not balanced, this different pattern of genetic diversity seems to reflect a more ‘healthy condition’ (Bouzat, Reference Bouzat2010; Fratini et al., Reference Fratini, Ragionieri, Cutuli, Vannini and Cannicci2013) of the population in oceanic islands than in coastal islands. As suggested by Rossi et al. (Reference Rossi, Forster, Montserrat, Ponti, Terlizzi, Ysebaert and Middelburg2007), the intensive human disturbances exerted by large numbers of tourists during the reproductive and recruitment phases of rocky shore species would have lowered the genetic diversity pool of some species. The Mediterranean Sea, specially the sampled areas in this study, are known as diving destinations, with a greater number of divers than the Azores. The isolation of the archipelago may improve the ‘health condition’ of species’ populations that are not the target of direct exploitation. Future studies should investigate more closely the hypothesis of dive tourism impacts on the genetic diversity pool of coastal species.
ACKNOWLEDGEMENTS
The authors are grateful to Professor Brian Morton for his suggestions regarding the early version of this manuscript. We thank Rocío Perez-Portela for collecting samples from the Greek Islands and Baleares, Adriana Villamor for samples from Murcia and the Balearic Islands, Manuela Parente (University of the Azores), Manfred Kaufmann (University of Madeira) and Joseph Borg (University of Malta) for their help and support during the collection work. Samples from Malta were collected under license NP00039/08 (Malta Environment and Planning Authority). We also thank Professor Patrick Schembri for his support.
FINANCIAL SUPPORT
This research was supported by a doctoral fellowship from the FCT of Portugal (Ref. SFRH/BD/27550/2006).
Supplementary materials and methods
The supplementary material referred to in this paper can be found online at journals.cambridge.org/mbi.