


Introduction
Accurate estimation of local turbulent surface fluxes is a fundamental problem in air-ice interaction studies (Reference Hicks and MartinHicks and Martin, 1972; Reference Banke, Smith and AndersonBanke and others, 1980; Reference AndreasAndreas, 1987; Reference King and AndersonKing and Anderson, 1994; Reference Smeets, Duynkerke and VugtsSmeets and others, 1999) and modelling efforts (Reference Launiainen and ChengLauniainen and Cheng, 1998). Knowledge of the local fluxes is also a prerequisite for estimating and modelling regional fluxes over a heterogeneous surface, formed by a mosaic of ice of various ice thickness, and cracks and leads (Reference ClaussenGlaussen, 1991; Reference VihmaVihma, 1995; Reference EsseryEssery, 1997).
Determination of the turbulent fluxes, air-ice-ocean coupling, and modelling are important goals in the Baltic Air-Sea-Ice Study (BASIS) project. In air-ice coupling, the primary quantities studied include fluxes of momentum, heat, water vapour (latent heat), radiative fluxes and air-ice interfacial (surface) temperature. In this paper, we describe Finnish Institute of Marine Research process studies of local air-ice coupling based on measurements carried out at the RVAranda ice station.
BASIS was a sub-project of the Baltic Sea program BALTEX of the World Climate Research Programme/Global Energy and Water Cycle Experiment. The objective of BASIS was to create and analyze an experimental dataset for optimization and verification of coupled atmosphere-ice-ocean models. The project was conducted by various Finnish, Swedish and German institutes during 1997−2000. The main field campaign was carried out in February-March, 1998 in the northern Baltic Sea. The location of the intensive measuring network was in the boundary zone between the ice-covered and open sea. The experiment and the data are described in the BALTEX-BASIS data report (Reference LauniainenLauniainen, 1999).
Observations and Methods
Measurements
Measurements focused on air-ice coupling included momentum and sensible-heat eddy-flux measurements (sonic anemometer Metek USA-1 with a path length of 180 mm, at a height of 2.25 m), together with wind and air-temperature measurements on a 10 m high profile mast on the sea ice. The wind speed was measured at five levels (at nominal heights of 10.13, 4.73, 2.43, 1.23 and 0.53 m) using cup anemometers (Aanderaa Instruments Co.). Temperature was measured at three levels (10.08, 2.38 and 0.48 m) using film-type platinum resistors (Aanderaa Instruments Co.). Profile gradients from the mast allow us to calculate the fluxes of momentum and sensible heat for comparison with eddy-flux results. A geometric redress procedure was used to correct the sonic anemometer data for a potential tilt error of the axis, especially a deviation of the z axis from the vertical. Sensor calibration of the mast was done in a wind tunnel and a temperature test tank before and after the fieldwork, with specific attention paid to the mutual comparison of the sensors. In addition to the sonic and mast measurements, radiation fluxes were measured, and in-ice and in-snow temperature time series observed. Finally, water-ice fluxes of heat, momentum and salt were measured with eddy-flux equipment below the ice. General meteorological wind, temperature and radiation conditions during BASIS are described by Reference Cheng, Launiainen, Vihma and UotilaCheng and others (2001).
Methods
Fluxes, gradient and bulk aerodynamic calculations
In a surface boundary layer, the turbulent fluxes (a) of momentum (τ) and sensible heat (h) can be expressed in the gradient (b) and bulk forms (c):


where vz is wind speed at a height z, u* is friction velocity, 0 is potential temperature, p is air density and cp is specific heat capacity of air. Θs - Θz is the difference in potential temperature between the surface and the air. km and kh are the gradient-method eddy diffusivities for momentum and heat.
For most marine and over-ice studies, the fluxes have to be estimated using the bulk formulae (c). From the Monin-Obukhov (M-O) similarity theory connecting the flux-profile relationships and the bulk transfer coefficients (see Reference GarrattGarratt, 1992; Reference LauniainenLauniainen, 1995), the bulk transfer coefficients for momentum (CD) and heat (CH) are defined as

where z0 and zt are the roughness lengths for velocity and temperature, respectively, and ΨM and ΨH are universal functions which give the effect of atmospheric stratification in terms of the Obukhov length l. The effects of stability and the universal functions vanish in neutral conditions. The above formulation indicates that, for estimation of fluxes by bulk formulae, the local aerodynamic roughness lengths (z0,zt) or the local, neutral bulk transfer coefficients (CD, CH) must be known. In addition, because the case-specific parameter l (in the argument of the universal functions) includes the fluxes to be defined, the bulk calculation leads to an iterative solution, except in a rough first-order estimation not taking the stability explicitly into account.
Using eddy covariance equipment, the fluxes can be measured directly according to the (a) forms of Equations (1) and (2). This yields data for derivation of the bulk form coefficients as well. Based on the M-O similarity theory, the fluxes can also be defined from profile gradient measurements, because the profile gradient form (b) transfer coefficients can be written as

where the functions Φ M and Φ H are the gradient-form universal functions for velocity and temperature, and k is the von Karman constant. By making accurate gradient measurements, we may solve for the fluxes from Equations (1b), (2b) and (4). Accordingly, a gradient of wind speed with respect to height gives u* and τ from Equations (4) and (1b). Then the temperature gradient yields the heat flux h. However, we should again note that, because the argument (z/l) in the universal functions Φ M and Φ H includes the fluxes to be solved (u*, h), the final solution is iterative. For our study, a modified algorithm developed by Reference Launiainen and VihmaLauniainen and Vihma (1990) was applied. Regarding the universal functions, for the unstable regions the Reference Businger, Wyngaard, Izumi and BradleyBusinger and others (1971)-Reference DyerDyer (1974)-type forms with Reference HogstromHogstrom’s (1988) coefficients were adopted, while for the stable region those of Reference Holtslag and de BruinHoltslag and de Bruin (1988) were used. Exact formulae are given in Reference LauniainenLauniainen (1995, p. 177−178).
As for the water-vapour flux or latent heat, M-O similarity-theory-based forms analogous to those for sensible heat can also be derived. In our study, however, no eddy-flux equipment was used. Instead, we estimated these fluxes using a single-level moisture measurement and an inverse method. We first estimated the surface temperature using Equation (6) below, and assumed that the specific (saturation) humidity was determined by the surface temperature. We then used the bulk form to calculate the fluxes. The results are not reported here. We believe that the gradient method for the water-vapour and latent-heat flux is inaccurate in cold conditions, due to the very small humidity gradients.
Coupled model
As a third method to determine the turbulent surface fluxes, a coupled one-dimensional, multi-layer thermodynamic model (Reference Launiainen and ChengLauniainen and Cheng, 1998; Reference Cheng, Launiainen, Vihma and UotilaCheng and others, 2001) was used. In the model, air and snow/ice are coupled by the heat fluxes, and the interface temperature calculated at each time-step. In addition to the ice thermodynamics, the model produces air-ice fluxes, the stability parameter and profiles of wind speed, temperature and moisture. As meteorological input, the model uses a level wind speed, temperature and moisture. These may be arbitrary and mutually different. The model has been tested and yields accurate heat fluxes, momentum flux, surface energy balance, surface temperature and in-ice temperatures. For bulk calculation of the fluxes, the modelled surface temperature is used, so the method is practically independent of the eddy-flux and gradient methods described above.
Results and Discussion
Drag coefficient and aerodynamic roughness length
The neutral drag coefficient CDN derived from the momentum flux measurements, Equation (1a), and corrected for stability CDN = k2/(ln z/z0)2, is shown as a function of wind speed in Figure 1. The results show no apparent wind-speed dependence; the mean CDN(10) = 1.28 × 10⁻³ corresponds to a mean aerodynamic roughness length z0 = 1.2 × 10⁻⁴ m. All 13 points corresponding to the highest wind velocities and higher drag coefficients are from the same snowstorm episode. During this storm, blowing snow and sastrugi were observed on the surface, which might explain the higher drag coefficients. The results are regarded as generally reliable because the drag coefficients based on the above-described profile gradient method from Equations (1b), (4) and (1c) resulted in drag coefficients (not quantitatively shown here) very like those in Figure 1. The experimental site was located in an archipelago in a coastal area surrounded by an asymmetric island and coastline geometry and orography, with asymmetric roughness along the wind direction. Investigation of the neutral drag coefficient indicated an apparent dependence on the wind direction, i.e. a dependence on the geometric roughness of the sea ice and that of the land and archipelago in the coastal direction. This can be seen from Figure 2, which gives the neutral drag coefficient vs the wind direction, as projected on a map of the observation area. The drag coefficient shows interesting behaviour. From the direction of the archipelago (north and northeast) with a short fetch, the drag coefficient is comparatively high. From the south, west and northwest, the drag coefficients pretty well correspond with the main characteristics of the sea ice along the upwind fetch. Although the results seem reasonable, the upwind fetch in the direction of the deformed ice was unfortunately not homogeneous, and the strict geometric/aerodynamic sea-ice roughness ratio quantification still seems to remain semi-quantitative. An analysis with respect to helicopter laser roughness profiling data is in progress. Based on visual observations, RADARSAT images and photographs from a helicopter, we assume the drag coefficient CDN(10) to be 1.0 × 10⁻³ (z0 ≈ 2.7× 10⁻⁵ m) for the smooth snow-covered ice, and 1.5 × 10⁻³ (z0 ≈ 2.9× 10⁻⁴ m) for the rougher ice in the west, which was refrozen from broken ice fields. Even so, no apparent wind-speed dependence of aerodynamic roughness or drag coefficient was found for any of the surface types.
Eddy-flux-derived drag coefficient CDN(10) as a function of wind speed at the RV Aranda ice station during BASIS-98,17 february-6 march 1998 (0.5 h means).

Drag coefficient (red line) and its deviation vs the wind direction (green dotted line) observed at the RV Aranda ice station (a), as projected on a map of the observation area in the archipelago in the northern baltic sea.

As for the characterization of "rougher" ice, we are speaking here about thin (0.3−0.4 m) deformed Baltic Sea coastal ice of 100% concentration which included no ridges or roughness elements higher than 0.3−0.6 m. Therefore, when compared to the northern polar sea-ice roughness classification of Reference Quest and DavidsonQuest and Davidson (1991), our field site would correspond to very smooth or smooth first- or multi-year sea ice with no pressure ridges. Actually, the numerical drag-coefficient results and (more or less subjective) ice-roughness characterization in the literature vary quite a lot, as is evident, for example, from Reference HofmannHofmann (1998, table 4.1); sea-ice roughness information is given, almost without exception, in qualitative or semi-quantitative terms. The above definition and numerical uncertainty may be reflected in part as a large variability in the drag coefficients used by models in atmosphere-ice momentum-flux calculations (Reference Harder and FischerHarder and Fischer, 1999). We believe that for a "universal" resistance quantification and characterization of sea ice, we still need additional high-quality aerodynamic roughness data, as well as quantification of the height and distribution of the geometric roughness elements (cf the nice effort by Reference Banke, Smith and AndersonBanke and others, 1980). For very rough ice conditions and in conditions of ice concentration where ice concentration is <1, this would allow a reasonable partition of the total drag resistance into form drag and skin drag (Reference Mai, Wamser and KottmeierMai and others, 1996; Reference Garbrecht, Lubkes, Augstein and WamserGarbrecht and others, 1999).
Heat-transfer coeffient and temperature roughness length
Estimation of the bulk heat-exchange coefficient (CH) or the temperature roughness length (zt) is more problematic. For determination of the bulk heat-transfer coefficient from Equation (2c), accurate surface temperatures need to be known. Experience gained from BASIS suggests that derivation of the surface temperature, even from radiation measurements, is not always trivial and is insufficiently accurate for the purpose. We studied the temperature roughness length in conditions for which we believe the estimation of the surface temperature was quite accurate, i.e. when the temperature remained at the freezing point. We first calculated the air-ice interface temperature using the coupled thermodynamic model. In cases for which the model estimates an apparent positive surface heat balance and melting, we assumed a surface temperature of 0°C. Under variable and mild weather during the field campaign, we had several periods of such conditions (cf. Fig. 6, shown later). For those cases we could then calculate the bulk transfer coefficients and the roughness length for temperature from Equations (2) and (3).
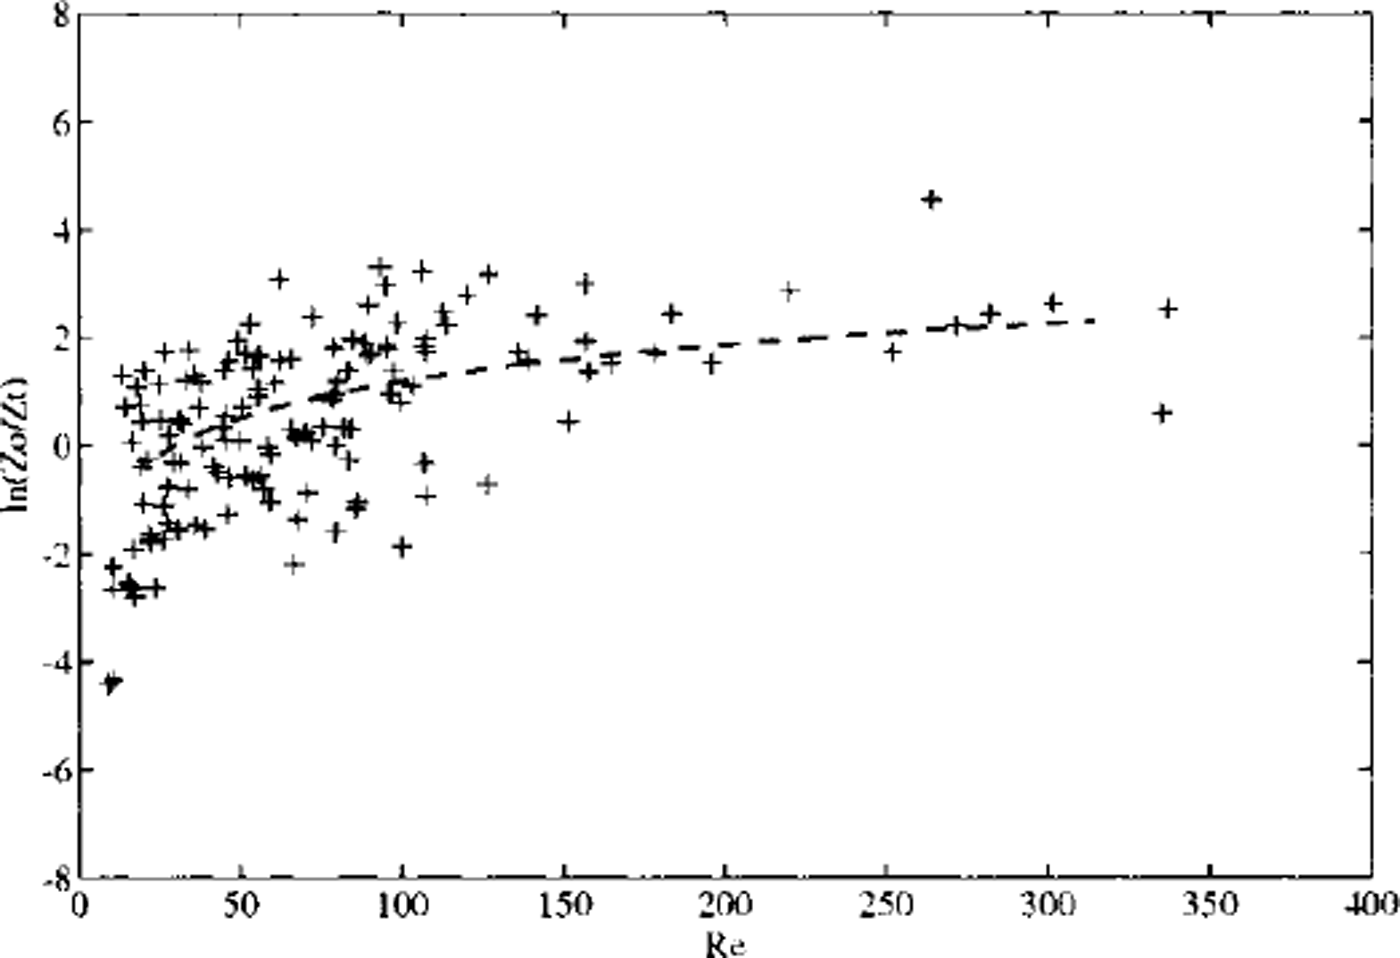
The results indicated that the temperature roughness and aerodynamic roughness were of the same order of magnitude, and that the scalar roughness was slightly larger than the aerodynamic roughness for low wind velocities, although zt < z0 for winds higher than 4−5 m s"1. An apparent dependence of zT on wind speed was found showing that zt decreased with wind. The results are shown in Figure 3 in terms of the aerodymamic to scalar roughness length ratio of ln(z0 /zT) ) = KB-1 plotted with respect to a roughness Reynolds number, in order to make the results less case-specific. The Reynolds number we use is defined as Re = (z0v)v−1, where v is the kinematic viscosity. We prefer this Reynolds number to the commonly used Re = (z0u*)v−1 1 (e.g. Reference Owen and ThomsonOwen and Thomson, 1963; Reference AndreasAndreas, 1987) because we do not have an accurate method to simultaneously obtain z0 and u, independently of each other. This is needed to avoid a spurious correlation, since z0 and u* are essentially governed by the same profile equation of wind speed (cf Reference LauniainenLauniainen, 1983, p. 482). This kind of spurious correlation tends to hide and smooth out even large experimental errors and scatter in the data. In terms of Re, a fit with our ln(z0/zT) data is given in Figure 3.
Ratio of the aerodynamic roughness to the temperature roughness ln(z0/zt) as a junction of the roughness reynolds number (Re = z0vv−1 ). a fit z0/zt = 0.035 Re0.98 is given as dashed line (20 < Re < 300).
As parameterized, our results of ln(z0/zt) can be written in a linear form as
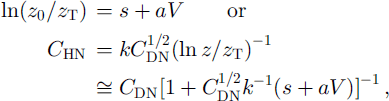
where CDN = k2[ln(z/zo)]2 and S −0.80. a =0.15 for wind speed at a height of 2 m, while for a wind referred to 10 m, a 0.13. For a site with CDN or z0 known or estimated, Equation (5) should give a reasonable estimate of CH and zt.
The region of our z0 observations in the analysis was limited to 3 × 10−55 to 9 × 140−4 m, i.e. CDN(10) = 1.0 × 10⁻³ to 1.9 × 10⁻³ and wind speeds of 3−15 m s"1. The analysis (Fig. 3) suggests that, for higher aerodynamic roughness and wind speeds, an asymptotic value ln(z0/zT) > 2 is attained. This value is in good agreement with the findings of Reference GarrattGarratt (1978, Reference Garratt1992) for rough surfaces with z0/zt = 7.3. Accordingly, our results might serve as proper first estimates for even higher wind speeds and roughness lengths. Generally, the dependence of the roughness ratio found above is in agreement with wind-tunnel studies, theoretical arguments and parameterizations for conditions over natural surfaces (Reference Owen and ThomsonOwen and Thomson, 1963; Reference AndreasAndreas, 1987; Reference GarrattGarratt, 1992) and with field studies (Reference Hicks and MartinHicks and Martin, 1972; Reference JoffreJoffre, 1982). Strictly, however, our results cannot be quantitatively compared with those of Reference AndreasAndreas (1987) because of our different definition of Re. Still, if we estimate ln(z0/zT) according to Reference AndreasAndreas (1987), using our mean z0 and u* = f ( z0, V, stability), the results are in rather good agreement with our data. Reference King and AndersonKing and Anderson (1994) obtained the unusual result of zT ≫ z0 over an Antarctic ice shelf. It is not known whether the reason for this anomalous roughness ratio was an overestimation of the temperature of the snow surface, the surface being cooled down by thermal radiative fluxes. The experience gained from determining zt with these data and from estimating; the surface temperature with our coupled thermodynamic model supports this conclusion.
Fluxes and surface temperature
As described above, in addition to the sonic anemometer eddy fluxes, the profile gradient data provided us with an independent method to determine the turbulent fluxes and transfer coefficients. The results of the gradient-method calculations are compared with the eddy-flux results in Figure 4a and b; fluxes calculated with the thermodynamic ice model are also shown for comparison. The gradient method (also called the level-difference method (LDM)) results shown are based on measurements from the (nominal) levels of 2.4 and 0.5 m. The results indicate the eddy-flux and gradient methods agree well. The sensible-heat flux comparison is given in Figure 4a only up to Julian day 59 in 1998. The LDM results were not presented in the comparison after this date because the LDM was inaccurate due to very low wind speeds, small turbulent fluxes and large interfering daily shortwave radiation fluxes.
Time series of the sensible-heat flux (a) and momentum flux (b). crosses give the results of the eddy flux observations. dashed red line gives the gradient-method result (ldm), and the blue line is the estimation by the coupled ice model (0.5 h means).

As may be expected from the agreement in the fluxes, the transfer coefficients (cd,ch) based on the sonic anemometer and LDM indicate good agreement in both the neutral and diabatic conditions. Strictly however, a detailed analysis of the observed diabatic eddy-flux-based transfer coefficients with the observed fluxes and the M-O similarity-theory-based flux-profile relationships suggests that the current universal functions for the stable region suppress the turbulence and transfer coefficients too much. For stability up to 10/L = 0.5, the well-known universal functions of Reference WebbWebb (1970) and Reference Holtslag and de BruinHoltslag and de Bruin (1988) yield 10−12% lower bulk transfer coefficients than those defined from our data. For 10/L = 1, the above difference was 15−17%. Actually, the non-linear Reference Holtslag and de BruinHoltslag and de Bruin (1988) form, defined particularly for the strongly stable region, gives essentially the same results for less stable conditions of z/l (up to 0.5 or 1) as the usual linear form by Reference WebbWebb (1970), the upper limit of this agreement depending on the aerodynamic roughness (cf Reference LauniainenLauniainen, 1995). The search for an improved universal function form is still in progress.
The flux estimates using the coupled thermodynamic ice model generally agree with those of the two other methods. However, during the latter part of the study period, from day 59 onwards, the magnitude of the sensible-heat flux tends to be too small for any quantitative comparison (Fig. 4a). During days 54−56, the ice model seems to smooth out the high, short-period flux variations. These days were connected with cold snowstorms. On the other hand, the momentum flux is well estimated, even during the large peaks in Figure 4b. This prompts us to investigate whether the heat-flux smoothing is due to a thermal "inertia" in the ice model. This will be studied using a shorter model time-step than in previous simulations.
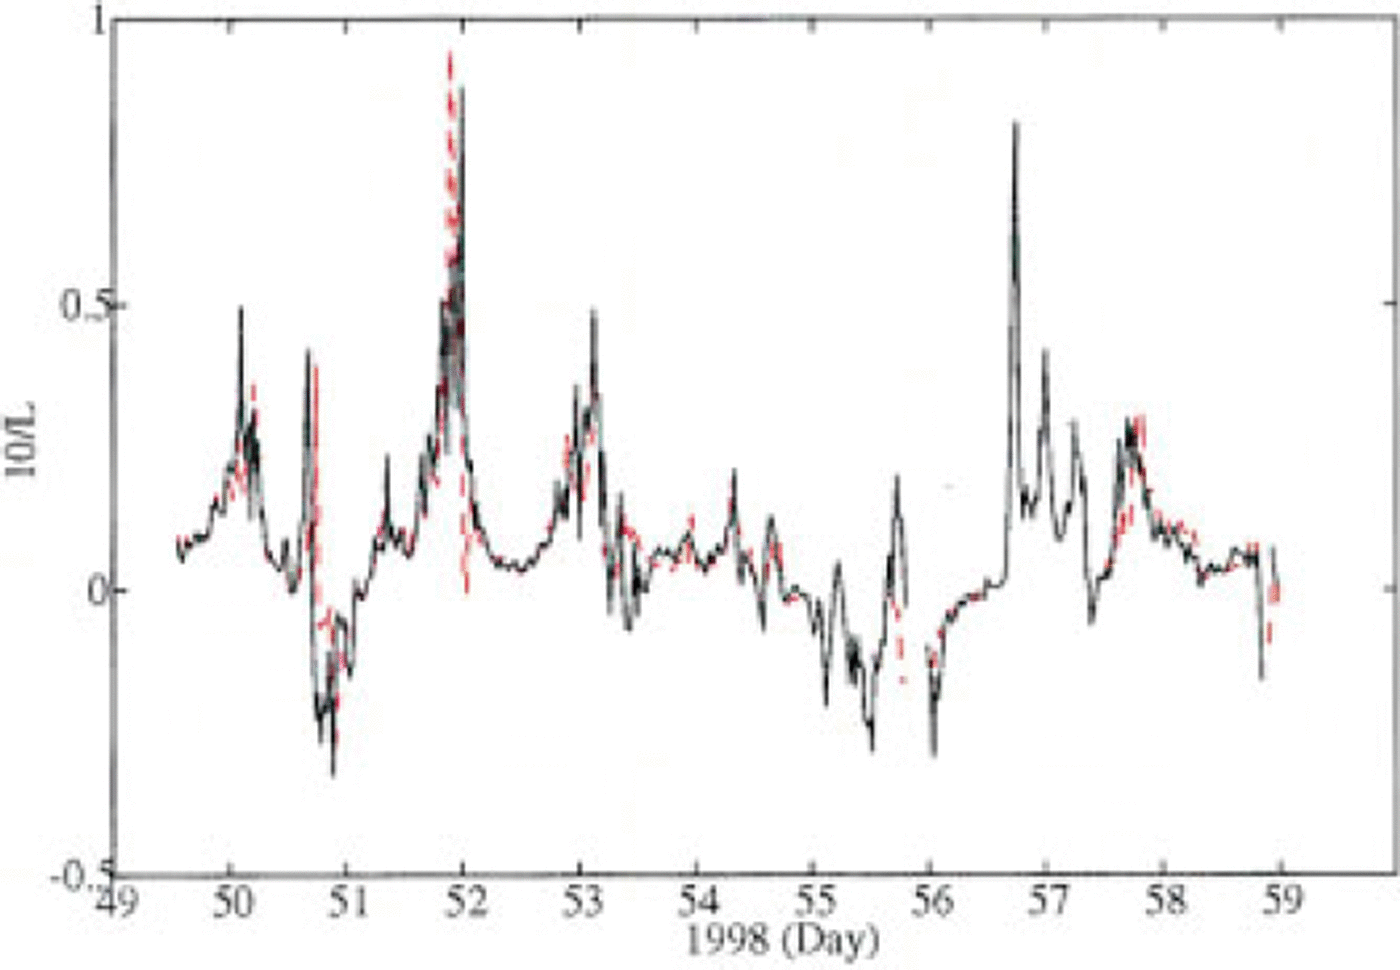
The time series of the stability parameter z/l is given in Figure 5. As can be seen, the stability characteristics derived from the direct eddy-flux measurements and LDM are almost identical.
Finally, we may calculate and compare the various estimates of the surface temperature. When integrated, the flux-profile gradient relation (2) gives

Time series of the stability parameter 10/l as calculated from the eddy flux results (dashed red line) and profile gradient method (solid line).
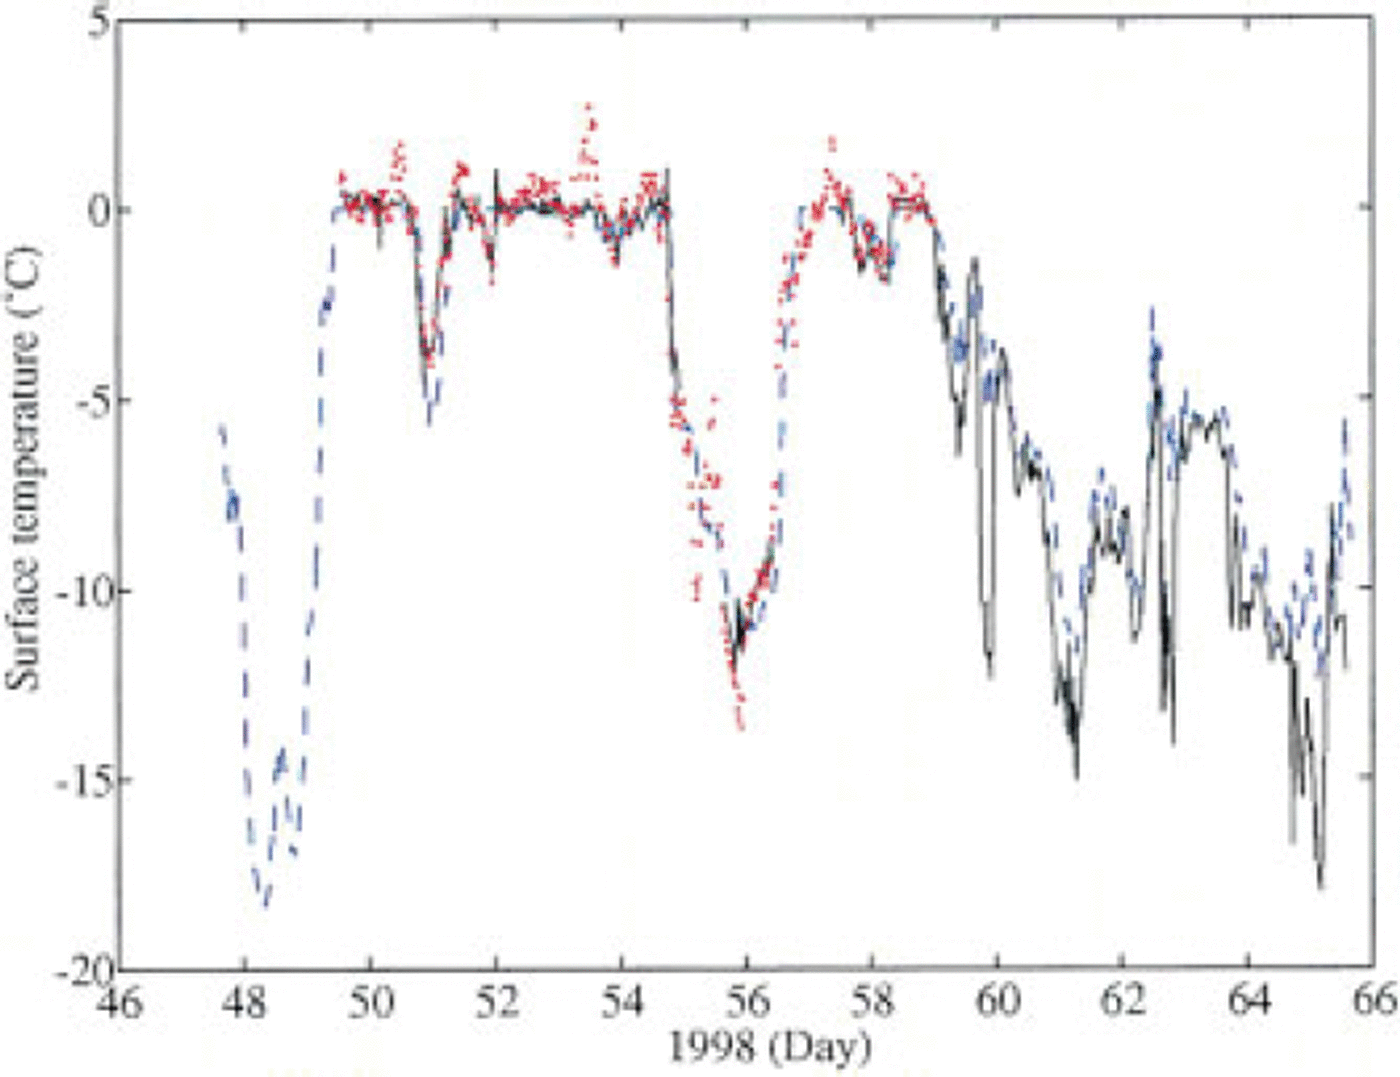
Estimates according to Equation (6), based on both the sonicanemometer and LDM data, were calculated. The results are shown in Figure 6, together with the surface temperature predicted by the ice model. (Even for the LDM-based estimate, the zt used was that derived above from the eddy-flux data, but this has a minor effect on the results.) As can be seen, the three alternatives generally agree well and seem to be effective tools for surface temperature estimation. This was confirmed by temperature estimates based on thermal radiation measurements during the first half of the measurement period (for clarity, not shown in Figure 6). However, in conditions of small fluxes but large variations in meteorological forcing (as from day 59 onwards), the ice model may not follow all the variations, whereas the other methods (especially the sonic-anemometer-based surface temperature) resolved them well. This conclusion was supported by the variations in the temperature estimate based on thermal radiation measurements.
Surface temperature during basis as derived by the coupled model (dashed blue line) and by equation (6), using the eddy flux data (solid line) and profile gradient data (dotted red line).
Conclusions
To summarize, we believe that the turbulent transfer coefficients and fluxes for the BASIS ice station are determined accurately. The drag coefficient (aerodynamic roughness) did not reveal a wind-speed dependence. The agreement of the gradient-method results with the eddy-flux results supports the validity of the M-O similarity theory, in conditions satisfying the preconditions for the theory. Fluxes modelled by the coupled air-ice model also compared reasonably well with the eddy-flux and gradient methods.
Analysis of the roughness lengths indicated that the temperature roughness was comparable to, or slightly larger than, the aerodynamic roughness for low wind speeds, while z0 > zt for moderate and strong winds. Accordingly, the temperature roughness length and bulk heat-transfer coefficients can be reasonably approximated by Equation (5) for winds up to 20 ms−1.
Surface temperature estimation by all three methods compared well, and these may (except for some limitations relating to the ice model) serve as a tool for temperature estimation. The flux verification and temperature comparison justify the overall relevancy of the ice-model construction and indicate the model’s potential for process studies.
Finally, we cannot overemphasize the need for accurate and strict calibration of sensors, especially for the gradient method. In addition to the sensor calibration (temperature, wind speed), we note that an inaccuracy in the measuring heights of even as little as, say, 5 cm when defining gradients in the lowest few metres causes significant error (∼10%) in fluxes and bulk transfer coefficients determined by the LDM method.
Acknowledgements
We are grateful to the participants in the BASIS-98 field campaign. The study is a part of the project BALTEX-BASIS supported by the European Commission under the contract MAST3−CT97−0117. E. Andreas (Cold Regions Research and Engineering Laboratory, Hanover, NH, U.SA.) and P. Guest (Naval Postgraduate School, Monterey, CA, U.S.A.) are acknowledged for their critical review of the paper.



