Introduction
Maize is the most cultivated cereal crop worldwide (Yang et al., Reference Yang, Balint-Kurti and Xu2017; FAO, 2018). Being an extremely versatile crop, it originated in Mexico and diffused to the rest of the world through trade routes to diversify into distinct landraces (Rebourg, et al., Reference Rebourg, Chastanet, Gouesnard, Welcker, Dubreuil and Charcosset2003; Bedoya et al., Reference Bedoya, Dreisigacker, Hearne, Franco, Mir, Prasanna, Taba, Charcosset and Warburton2017; Wang et al., Reference Wang, Beissinger, Lorant, Ross-Ibarra, Ross-Ibarra and Hufford2017). It was introduced in India both in pre- and post-Columbian era (Singh, Reference Singh1977; Kumar and Sachan, Reference Kumar and Sachan1994), and the Eastern Himalayan region reports a very high genetic variability for maize (Sharma et al., Reference Sharma, Prasanna and Ramesh2010; Prasanna, Reference Prasanna2010, Reference Prasanna2012; Hossain et al., Reference Hossain, Muthusamy, Bhat, Jha, Zunjare, Das, Sarika, Kumar, Singh and Kumar2016) with North East India designated as an Asiatic maize diversity centre (Sharma and Brahmi, Reference Sharma, Brahmi, Frison, López and Esquinas-Alcázar2011).
The genetic diversity of these landraces endemic particularly to the North Eastern Hill Region (NEHR) of India has been maintained for generations by tribal farmers as part of their socio-cultural practices and comprise a distinct gene pool of useful alleles (Singh, Reference Singh1977; Prasanna, Reference Prasanna2012). Very little of the novel alleles found in landraces however get utilized for cultivar development because of problems of adaptation in regions beyond their cultivation (Yao et al., Reference Yao, Yang, Pan and Rong2007; Lia et al., Reference Lia, Poggio and Confalonieri2009; Romay et al., Reference Romay, Butron, Ordas, Revilla and Ordas2012). Nonetheless, in the face of plateauing yields and climate change, the allelic richness of crop genetic resources such as landraces and/or close wild relatives that help to conserve heterogeneity in cropping systems will require to be harnessed for widening the genetic base of hybrid breeding programmes to ensure food security (FAO, 2019).
The commercial success of hybrid maize has been largely driven by the escalated demands as animal feed owing to the shift by farmers to cultivating high-yielding single cross hybrids (Kumar et al., Reference Kumar, Srinivas and Sivaramane2013; Pavithra et al., Reference Pavithra, Boeber, Shah, Subash, Birthal and Mittal2018). With a fast growing livestock sector, the NEHR would stand to greatly benefit from locally available quality animal feed (Feroze et al., Reference Feroze, Raju, Singh and Tripathi2010; Bhagat et al., Reference Bhagat, Mishra and Priyamvada2015), production of which is impeded by practices of shifting cultivation over reduced fallow periods and use of low-yielding varieties, leading to pronounced yield gaps compared to the national scenario (Tripathi et al., Reference Tripathi, Singh and Datta2003; Grogan et al., Reference Grogan, Lalnunmawia and Tripathi2012). One course of action to bridge this yield gap would be to emulate the commercial success of single cross hybrids as found elsewhere in the world and the country (Duvick, Reference Duvick2001, Reference Duvick2005; Dass et al., Reference Dass, Kaul, Manivannan and Chikkappa2009; Hallauer et al., Reference Hallauer, Carena and Miranda Filho2010; Dass et al., Reference Dass, Kumar, Jat, Parihar, Singh, Chikkappa and Jat2012) using genetically divergent landraces of the region which are already fortified with the advantage of local adaptation.
Since knowledge of maize diversity is critical for exploitation of heterosis in single cross breeding programmes, the objective of the current study was to investigate genetic divergence in a subset of 111 inbred lines developed from landraces originating at varying altitudes across the NEHR of India. The process of inbreeding phenotypically favourable individuals can be further reinforced with genetic analysis (Liu et al., Reference Liu, Goodman, Muse, Smith, Buckler and Doebley2003; Choukan et al., Reference Choukan, Hossainzadeh, Ghannadha, Warburton, Talei and Mohammadi2006; Charlesworth and Willis, Reference Charlesworth and Willis2009; Lai et al., Reference Lai, Li, Xu, Jin, Xu, Zhao, Xiang, Song, Ying, Zhang and Jiao2010; Morrell et al., Reference Morrell, Buckler and Ross-Ibarra2012; Nyaligwa et al., Reference Nyaligwa, Hussein, Amelework and Ghebrehiwot2015) and therefore the subset was subjected to population subgrouping based on maximum likelihood and distance-based analysis using simple sequence repeat (SSR) markers. This would allow us to understand the extent of differentiation in the subgroups, the ultimate goal being establishment of a germplasm base for heterotic grouping of the genetically diverse maize indigenous to this centre of diversity.
Materials and methods
Study material
A total of 111 lines developed from seven different landraces collected from five different North Eastern states of Meghalaya (M9, M22), Manipur (Ma5), Nagaland (N11, N25), Sikkim (S16) and Tripura (T9) were studied. While some of these landraces had been identified as tolerant/resistant to biotic stresses predominant in the NEHR from previous studies (Sanjenbam et al., Reference Sanjenbam, Sen, Tyagi and Chand2018) certain other were reported to be tolerant to abiotic stresses (unpublished data). The passport data of the landraces are provided in online Supplementary Table S1. The selection and inbreeding programme was initiated in 2015 at the Experimental Farm, College of Post-Graduate Studies in Agricultural Sciences, Central Agricultural University (Imphal), Umiam, Meghalaya, India (25°40′52.9″N, 91°54′40.7″E) employing full sib-mating from generations one to four and selfing in generations five and six respectively. Morphological data were recorded as per the standard descriptors outlined by the Protection of Plant Varieties and Farmers' Rights authority, New Delhi (Anonymous, 2007). Eight yield contributing quantitative traits viz. anthesis silking interval (ASI, days), plant height (PH, cm), ear height (EH, cm), ear with husk (EWH, g), ear without husk (EWWH, g), ear length (EL, cm), number of kernels per row (NK) and kernel yield per plant (GYP, g) were subjected to principal component analysis (PCA).
DNA extraction, polymerase chain reaction and SSR genotyping
For genotyping studies, fresh leaf samples were collected at seedling stage for extraction of genomic DNA using the modified CTAB extraction protocol (Doyle and Doyle, Reference Doyle and Doyle1990) from each of the individual lines under study. A total of 48 reported SSR markers consistent with high phenotypic variation and high polymorphic information content (PIC) values obtained from the maize GDB database (Portwood et al., Reference Portwood, Woodhouse, Cannon, Gardiner, Harper, Schaeffer, Walsh, Sen, Cho, Schott, Braun, Dietze, Dunfee, Elsik, Manchanda, Coe, Sachs, Stinard, Tolbert, Zimmerman and Andorf2018) were used to genotype the panel. DNA quantity was assessed in 0.8% agarose gel (Sigma) and individual samples were uniformly diluted to a final concentration of 10 ng/μl.
Polymerase chain reactions (PCRs) performed in 10 μl reaction volume in a programmable thermal cycler included an initial denaturation step at 94°C for 4 min followed by 35 cycles of denaturation at 94°C for 30 s, annealing for 30 s adjusted to temperatures depending on length of the primer (online Supplementary Table S2) and extension at 72°C for 30 s. The final extension was carried out at 72°C for 4 min. Depending on the size of the amplicon, 7 μl mixture of the amplified PCR product was resolved in either 1.5 or 2% agarose gel and stained with ethidium bromide. The DNA amplicons separated on the basis of size as observed under a gel documentation unit (Alpha Imager Mini) were scored relative to the standard 100 bp ladder (Gene Ruler, Fermentas).
Data analysis
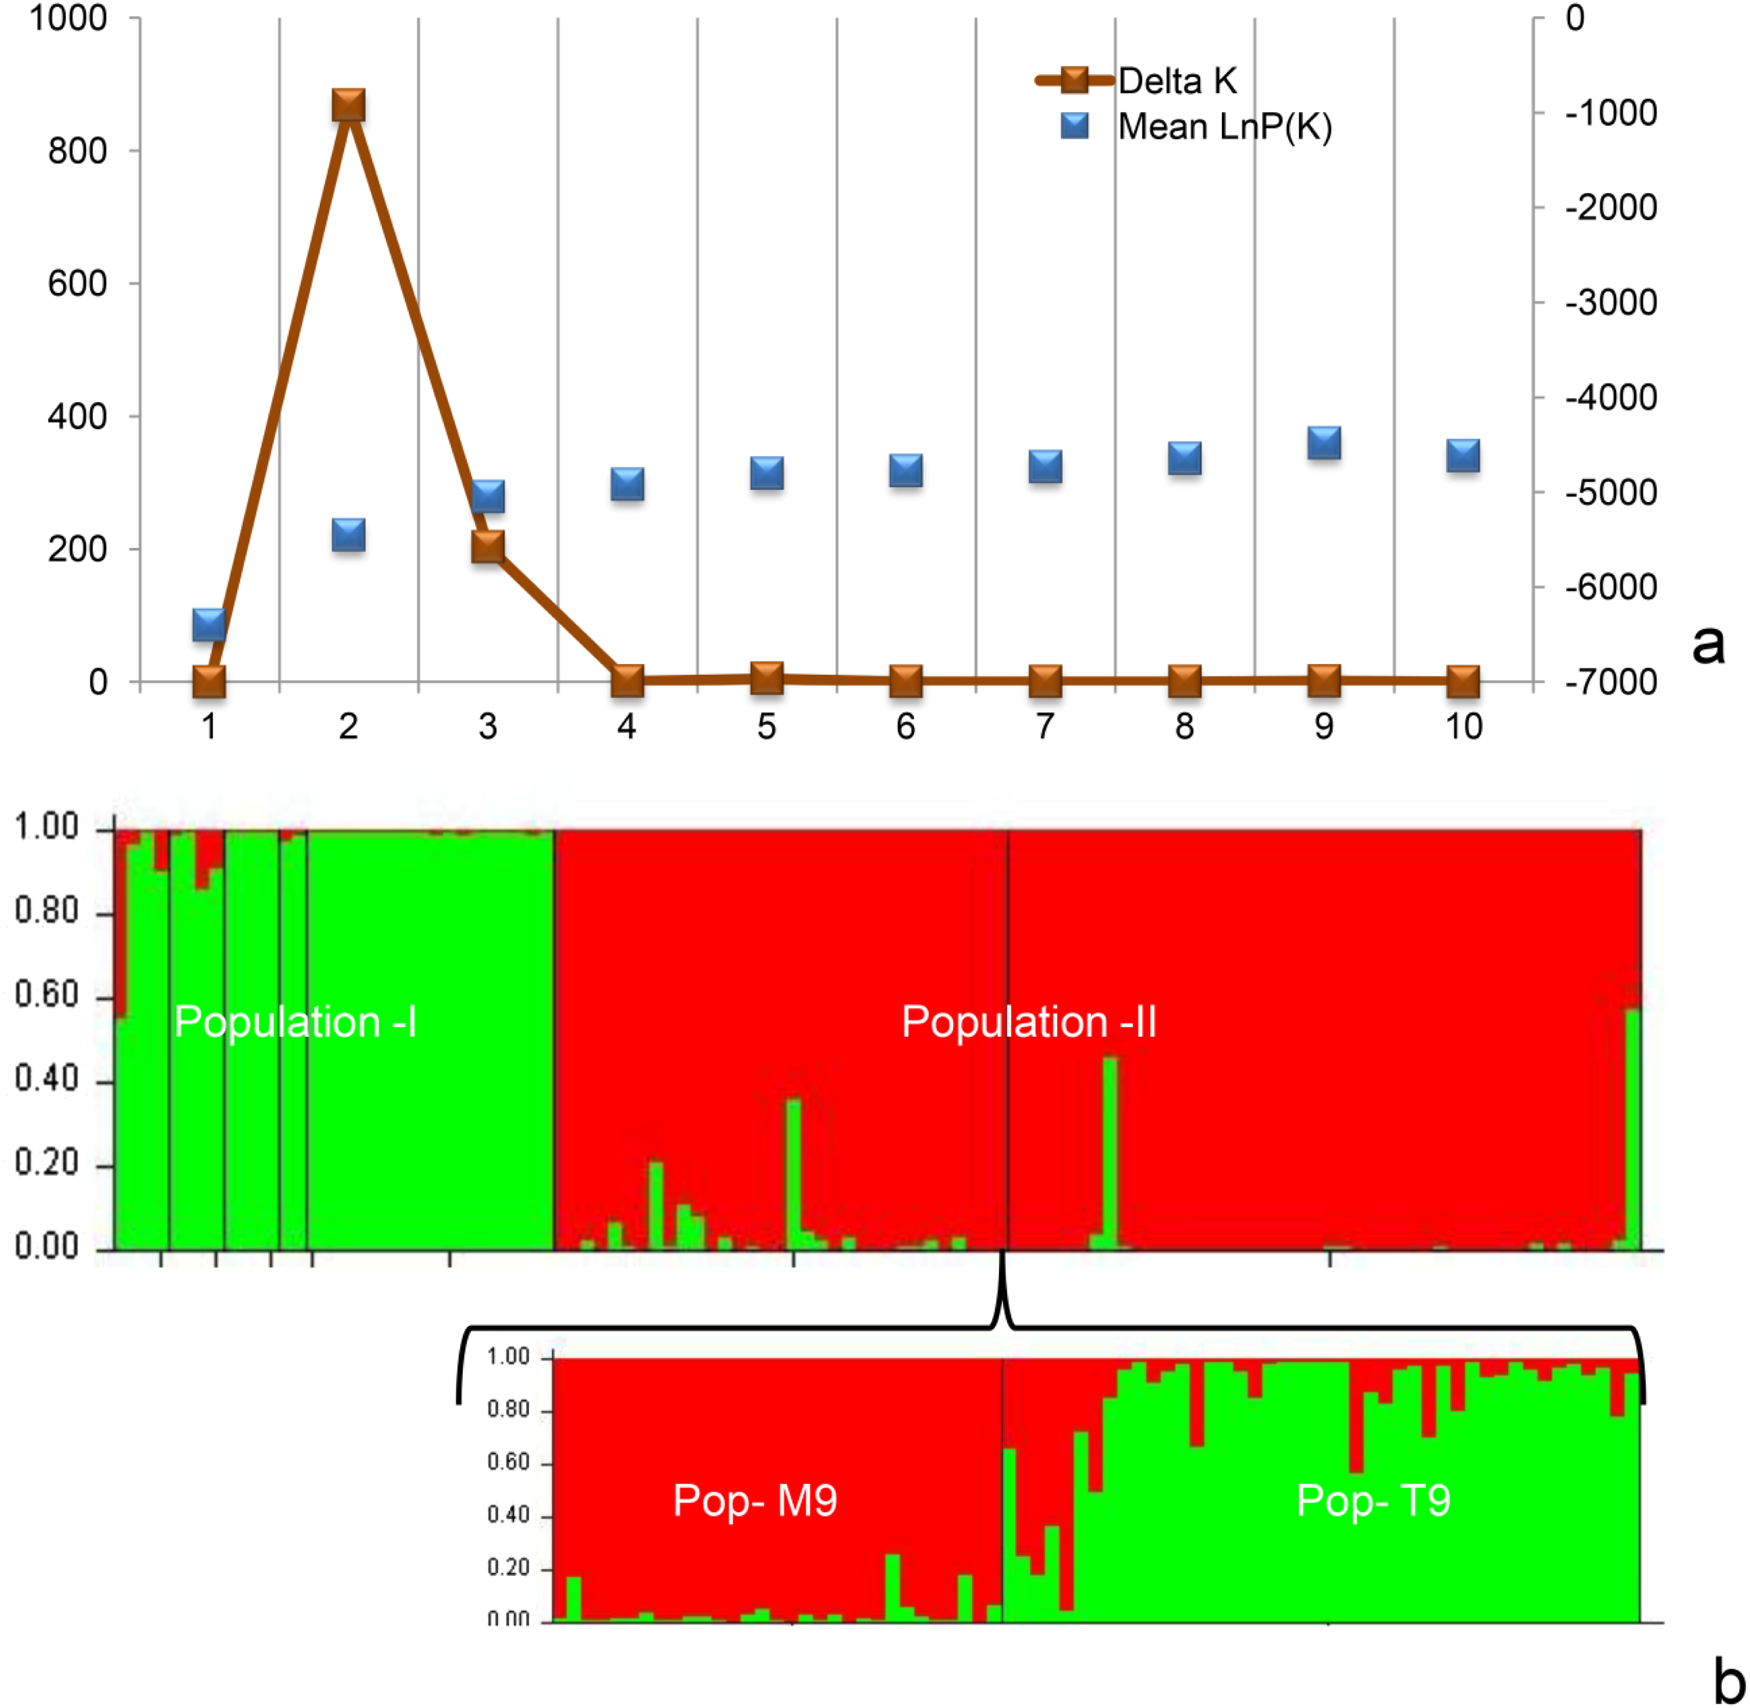
SSR data were analysed using software package STRUCTURE (Version 2.3.4) developed by Pritchard et al. (Reference Pritchard, Stephens and Donnelly2000). A total of 20 independent runs for each K, with K values ranging from 1 to 10 and a Markov chain Monte Carlo replication burn length of 10,000–100,000 was performed as per Evanno et al. (Reference Evanno, Regnaut and Goudet2005), the results of which were corroborated with those of STRUCTURE HARVESTER (Fig. 2(a)) to calculate optimal K value. Lines with membership probabilities Q ≥ 0.98 were assigned to the two subgroups while lines with membership probabilities below 0.98 were clubbed into a single admixture subgroup. The larger subgroup was further subdivided similarly. These subgroups defined by STRUCTURE hereafter also designated as populations were then studied for frequency and distance-based analysis with respect to F-statistics, G st adjusted for F st bias, Hedrick's standardized G st (G″st) further corrected for bias when the number of populations are small, analysis of molecular variance (AMOVA), principal coordinates analysis (PCoA), allele frequencies and expected and observed heterozygosity using GenAlex software version 6.5 (Peakall and Smouse, Reference Peakall and Smouse2012).
Allelic diversity as explained by PIC values was calculated as per Nei (Reference Nei1973) using the following formula:
 $$H_j = 1\ndash \sum {\,p_i^2 } \comma \;$$
where pi is the frequency of the ith allele.
The phylogenetic tree was constructed using the un-weighted neighbour joining clustering method based on dissimilarity index computed from simple matching coefficient in DARwin 6.0.21. Descriptive statistics for the eight yield contributing morphological traits, correlation studies and PCA was performed in MS excel using XLSTAT (Version 2014.5.03).
Results
SSR diversity studies
Of the 48 SSR markers studied, a total of 38 were polymorphic with missing values within permissible limits as determined by Genalex software and were used for further analysis. With a mean of 2.32 alleles per locus, the average PIC value for the informative markers was 0.38 with 25 markers recording PIC values higher than the average of which five markers viz. umc1277, umc2059, bnlg439, bnlg1484 and umc1149 of bins 9.08, 6.08, 1.03, 1.03 and 8.06 respectively recorded PIC values ranging from 0.57 to 0.50 (online Supplementary Table S3).
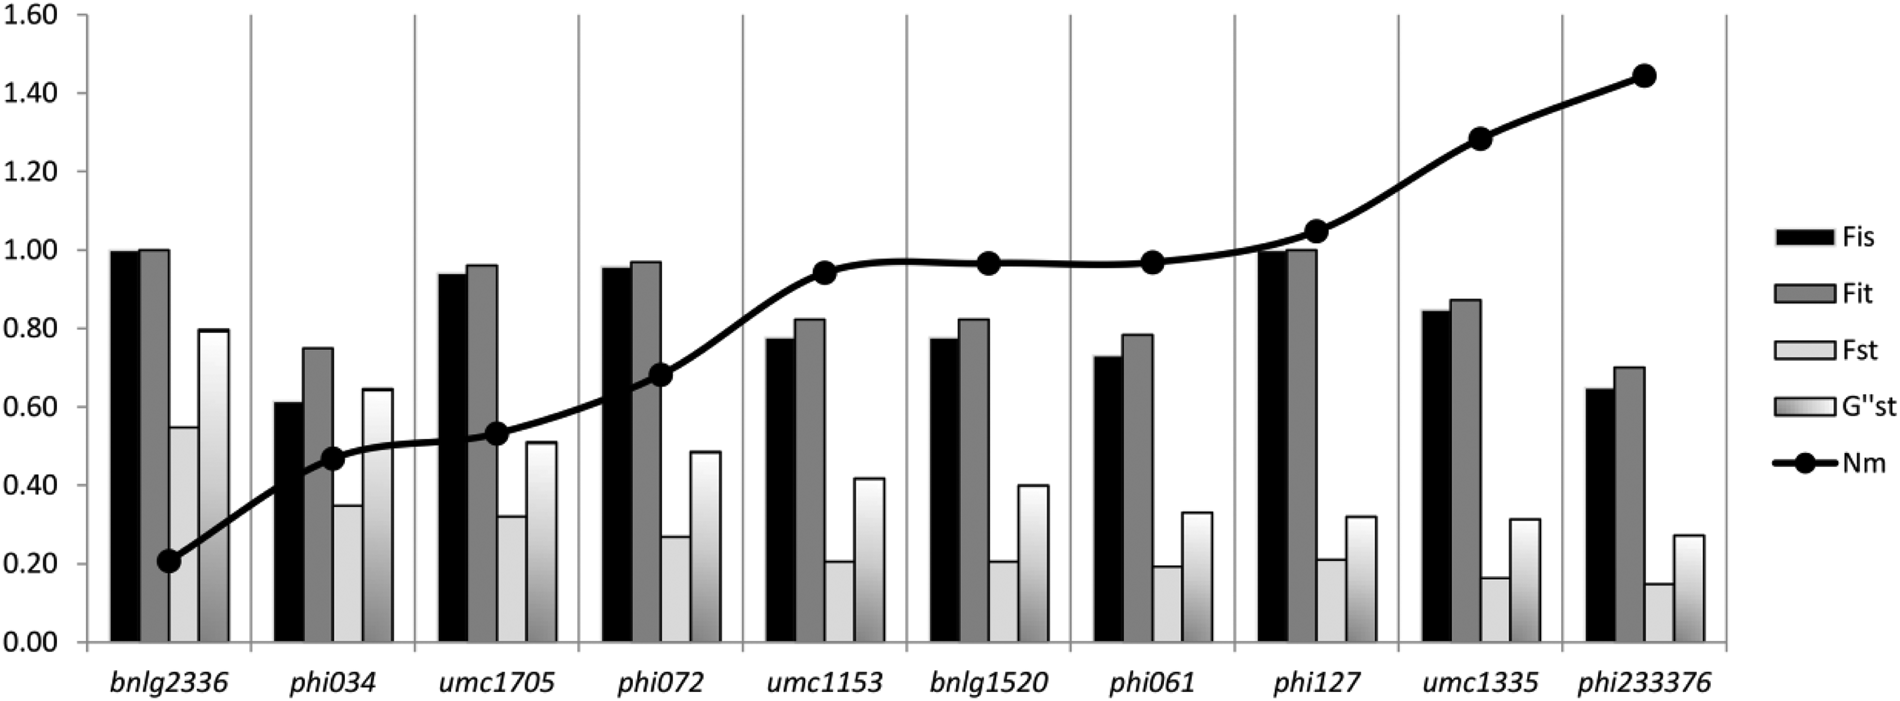
The least informative marker with the lowest PIC value of 0.07 was reported for phi053 located in bin 3.05. A total of 88 alleles were detected with observed heterozygosity (%Het) for the SSR markers studied ranging from 0 to 29.1%. Studies with respect to F-coefficients viz. F st the coancestry coefficient, F is the consanguinity coefficient and F it the inbreeding coefficient, revealed that 22 SSR markers recorded F st values in the range of 0.59 to 0.06 implicating their contribution in high to moderate population substructuring. With the exception of SSR markers mmc0241 and umc2101 of bins 6.05 and 3 which recorded low/negative F is but high F st values as a result of harbouring excess heterozygotes due to negative assortative mating, for the remaining loci, overall high F st values were positively correlated with high F is values. SSR markers bnlg2336, phi034, umc1705, phi072, umc1153, bnlg1520, phi061, phi127, umc1335 and phi233376 of bins 10.04, 7.02, 5.03, 4.01, 5.09, 2.09, 9.03, 2.08, 1.06 and 8.03, respectively (Fig. 1) recorded higher F st, F is and F it values than the mean. Collectively, these SSR markers recorded an average fixation index of 0.80. The overall G st mean of 0.122 when corrected for bias in small populations using Hedrick's standardized G st (G″st) stood at 0.263. As expected, the gene flow (Nm) was low for loci with high F st values.
F coefficient values of SSR markers bnlg2336, phi034, umc1705, phi072, umc1153, bnlg1520, phi061, phi127 and umc1335 with highest contribution to genetic differentiation positively correlated with Hedrick's standardized  ${G}^{\prime \prime}_{{\rm st}}$ values. The F values were negatively correlated with gene flow (Nm).

Population structuring based on SSR genotyping
Subgroup delineation using STRUCTURE based on the optimal value of K = 2 for the 111 lines with a cut-off Q ≥ 0.98 differentiated 88 of the 111 lines into two distinct groups. A rigid cutoff value of Q ≥ 0.98 was maintained to ensure strict delineation of the lines into different subgroups since no prior information on the heterotic pattern of these lines is known. A visual representation is depicted in Fig. 2(b) with 26 inbreds clustered in Population I (red) and 62 in Population II (green). The remaining 23 lines of mixed ancestry with Q < 0.98 were assigned to a third group, Population III. Members of Population II could be similarly further delineated in two subpopulations Pop-M9 and Pop-T9.
(a) Mean likelihood l (K) and variance per K value over 20 runs as per STRUCTURE in the subset of 111 individual lines studied for the 38 polymorphic SSR markers. (b) Population subgrouping with membership probabilities Q ≥ 0.98 achieved by STRUCTURE in the subset of 111 individual lines studied. Population II further subdivided into Pop-M9 and Pop-T9.

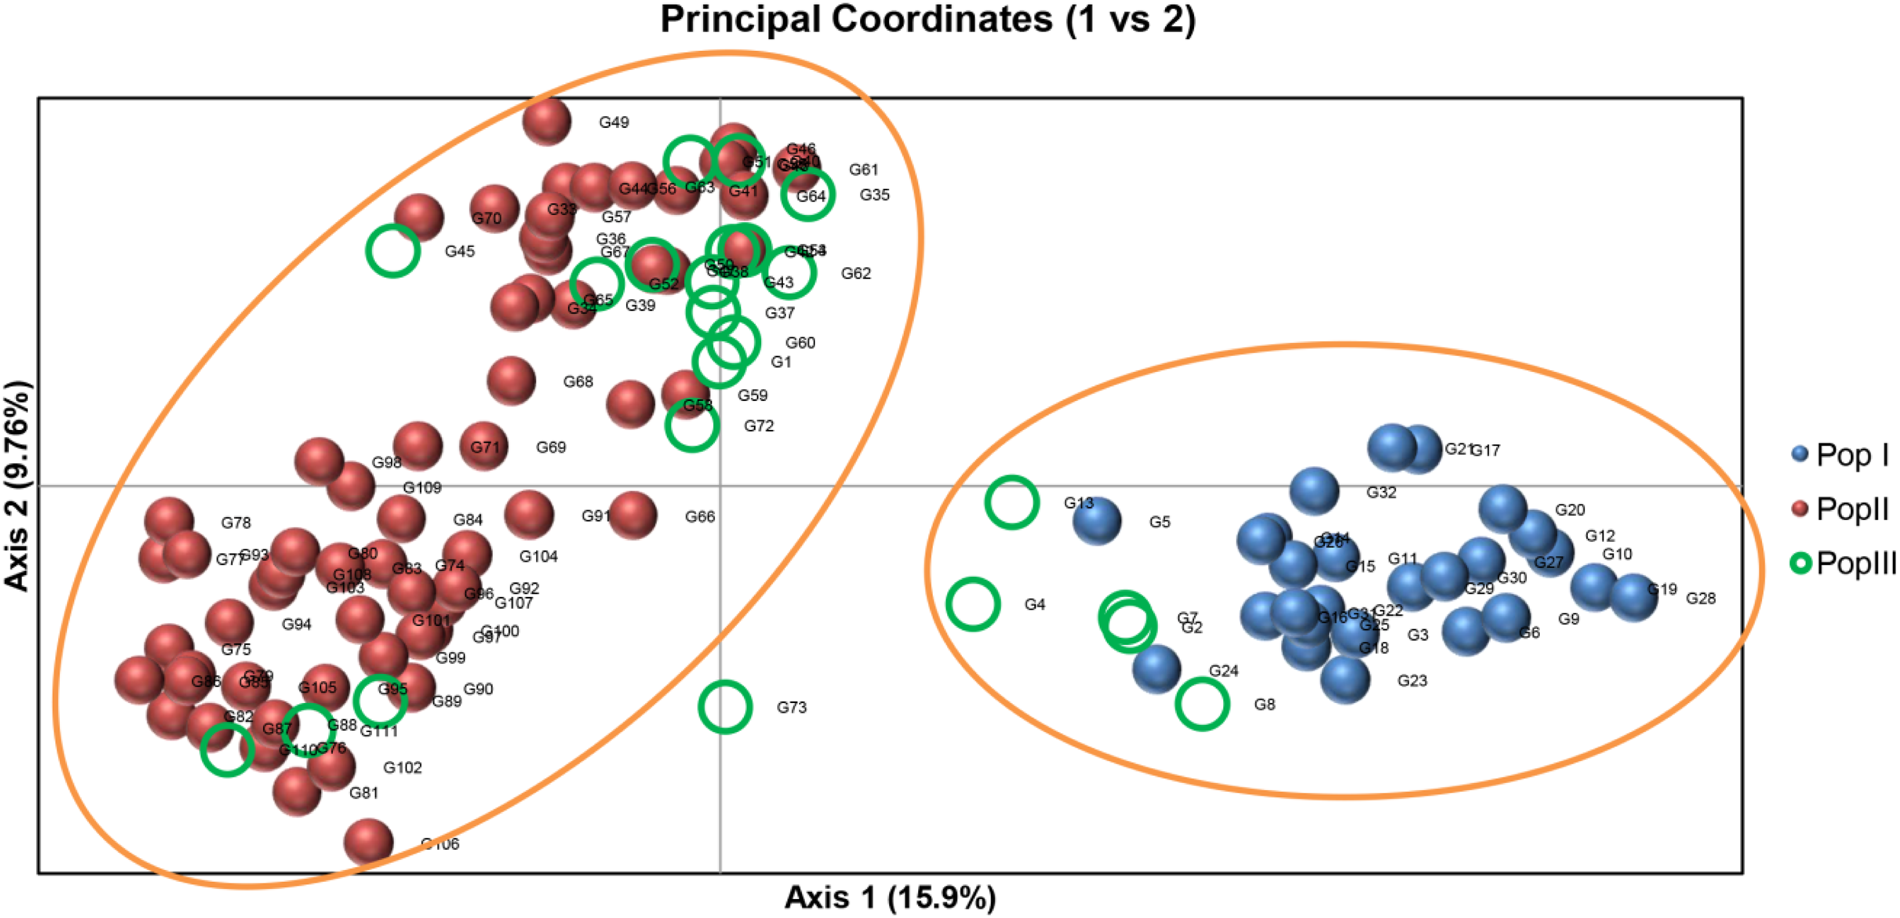
PCoA revealed that the first three axes could explain a total of 31.26% variation, individually accounting for 15.99, 9.75 and 5.52% of the total variation, respectively. The members of Populations I and II were found to occupy distinct quadrants with no overlaps. A majority of the admixtures overlapped members of Population II with relatively fewer individuals overlapping members of Population I (Fig. 3). Comparison of the principal coordinates (PCos) 1 versus 2 revealed that maximum variation reflected in PC1 with an eigen value of 42.96 was accounted by members of Population I. Individuals of Population II comprising lines developed from landraces belonging to M9 (Meghalaya) and T9 (Tripura) were spread across two quadrants along PC2 as per the subgroups obtained using Q probabilities.
PCoA for plot of axis-1 and axis-2 where Pop I along axis 1 represents Population I, Pop II along axis 2 represents Population II clearly spread across two distinct quadrants and Pop III represents the admixture subgroup.

Hierarchical partitioning of total variance using AMOVA indicated a departure from panimixis where 17% variation was the result of population grouping with majority of the variation (55%) accounted for by individuals within populations. Altogether 28% variation was accounted for by differences arising within the lines relative to the entire the population taken as a whole. A P value <0.001 indicated that the variation observed for F st, F is and F it (Table 1) at 0.171, 0.661 and 0.719 respectively was highly significant implying that six generations of inbreeding has led to the meaningful sub-structuring of the lines into distinct homogeneous units. The highest value of F st that could be achieved under situations of maximum possible among population diversity (F st max) was 0.644.
AMOVA and F coefficient values

F st = inbreeding coefficient within subpopulations relative to the total (AP/TOT).
F is = inbreeding coefficient within individuals relative to the subpopulation (AI/(WI + AI)).
F it = inbreeding coefficient within subpopulations relative to the total ((AI + AP)/TOT).
F st max = maximum F st achievable.
Pairwise calculations of Nei's genetic distance which is based on the assumption of biological changes viz. genetic drift and mutation resulting in differences among populations revealed greater differences between individuals of Populations I and II compared to Populations II and III or I and III. Similarly, a population F st value of 0.163 between Populations I and II indicated high genetic differentiation compared to Populations I and III with an F st value of 0.090 which was indicative of moderate genetic differentiation. In case of Populations II and III, an F st value of 0.03 indicated very small levels of genetic differentiation. A highly significant deviation from panimixis in all of the three populations for expected (H e) and observed heterozygosity (H o) was also observed following six generations of inbreeding. Allelic richness as indicated by the number of effective alleles (N e) was highest in Population I. A total of 8, 21 and 10 private alleles (PA) were identified in Populations I, II and III respectively. For the 39 PA identified, the frequency of occurrence ranged from 0.008 to 0.2 with the highest number of unique alleles observed for umc1149 and phi029 in Populations II and III respectively. Estimates of outcrossing (t) calculated from fixation index were also lowest in Population II (Table 2). Population I with the highest percentage of polymorphic loci (%P) recorded the lowest fixation index (F) which ranged from 0.661 to 0.457 (online Supplementary Fig. S1). Based on SSR genotyping, the overall percent heterozygosity for the individual lines studied ranged from 0 to 30.23% with Population II recording the lowest percent heterozygosity (0 to 19.5%). The observed heterozygosity for the individual lines (online Supplementary Table S4) varied between 7.14 and 25.52% in Population I and between 2.44 and 30.23% was highest for the admixture group constituting Population III.
Pairwise genetic distance of F st values (top diagonal), Nei's unbiased genetic distance (bottom diagonal) and mean values of genetic parameters for the three populations as revealed by the 38 polymorphic SSR markers under study

N, number of lines; N e, number of effective alleles ± standard error; PA, private alleles; H o, observed heterozygosity ± standard error; H e, expected heterozygosity ± standard error; F, fixation index; t, estimated out-crossing; %P, percentage of polymorphism.
Phylogenetic and phenotypic divergence
Of the 26 individuals grouped by STRUCTURE in Population I, all lines originating from landraces S16 and N25 were represented in this subgroup but none of T9 or M9 origin which were mostly clustered in Population II. Population III comprised of a mix of lines derived from M9, M22, Ma5, N11 and T9 but none from S16 and N25. Individual lines in Population I recorded the lowest ear weight, grain yield and also greatly reduced PH and EH when compared to mean values of Populations II and III. For the same traits, the admixture group recorded high values while Population II was the most variable with higher dispersion of individual trait values on either side of the mean (online Supplementary Fig. S2).
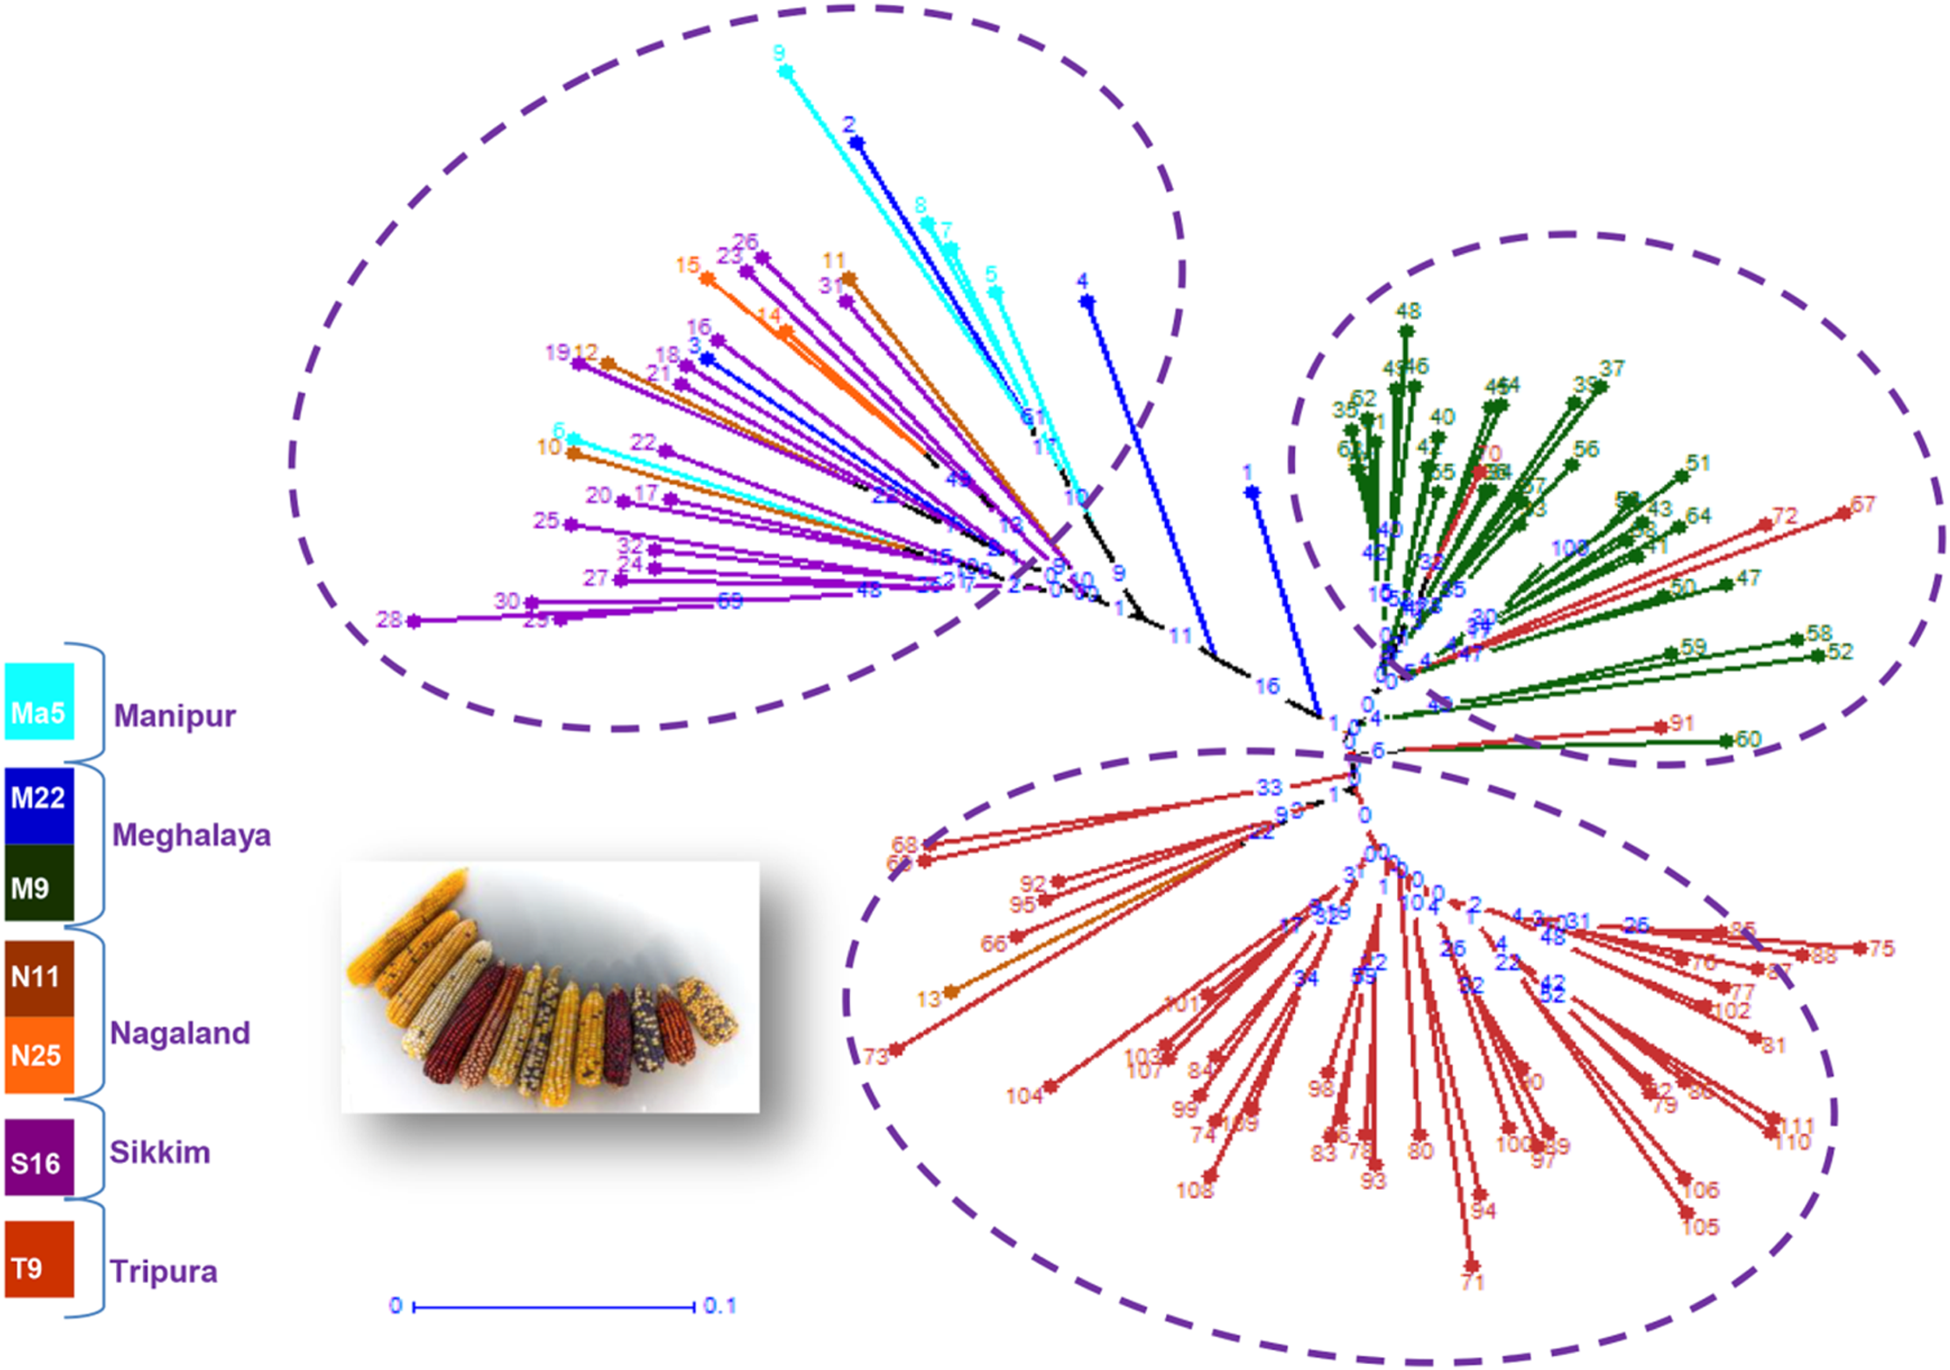
The dendrogram generated based on un-weighted neighbour joining also separated the lines studied into three distinct clusters (Fig. 4). Individuals other than M9 and T9 delineated as per STRUCTURE to Populations I and III grouped in a single cluster, while members of M9 and T9 concurrent to the subgrouping achieved as per STRUCTURE were found to occupy distinct clusters with a few exceptions. A minimum genetic distance of 0.049 was recorded for lines numbered 53 and 66 clustering within the M9 group and the maximum genetic distance of 0.587 was observed between lines numbered 28 and 105 originating from landraces S16 and T9, respectively. Maximum intra-cluster divergence (0.541) was observed in the cluster comprising members of Populations I and III. Despite originating from common progenitors, members of the cluster comprising M9 individuals recorded a maximum intra-cluster genetic distance of 0.332 while in case of T9, the maximum intra-cluster genetic distance recorded was 0.439.
Un-weighted neighbour joining tree based on dissimilarity matrix calculated from 38 SSR markers where each tip represents an individual line. The subgroups are indicated in different colours. Majority of the lines originating from M9 and T9 grouped into two distinct clusters with lines originating from landraces M22, Ma5, N11, N25 and S16 grouping into a separate cluster. Inset: A representative photo of maize landraces collected from various parts of NEHR.

With respect to the eight phenotypic traits studied, a highly significant and positive correlation at α = 0.01 was observed for all the traits, with higher correlations detected between EWH, EWWH and GYP when compared to NK and EL. Of the 80.87% total variation explained by the first three principal component (PC) analysis axes, ear traits EWH, EWWH and GYP contributed to 71.26% of the total variation in PC1. EWH ranged from a minimum of 25 g to a maximum of 195 g with a mean of 100 g while GYP was found to range from 3.1 to 104.3 g with a mean of 42.4 g in the 111 lines studied. The contributions of PH and EH which were highly significantly correlated with each other but not with ear/kernel traits or ASI, were highest in PC2 at 83.42%. ASI was the most variable trait under study ranging from 1 to 10 d and correlated negatively with other variables in PC3 contributing to 96.41% of the total variation accounted for in PC3. Squared cosine values indicated that EWH, EWWH and GYP were the most significant contributors to variation in PC1. Similarly, PH and EH were significant contributors to variation in PC2 and ASI in PC3 (online Supplementary Table S5).
Discussion
Landraces which are the collective outcome of both natural and human selection constitute a valuable genetic resource for plant breeding (Reif et al., Reference Reif, Hamrit, Heckenberger, Schipprack, Maurer, Bohn and Melchinger2005; Villa et al., Reference Villa, Maxted, Scholten and Ford-Lloyd2005; Mercer and Perales, Reference Mercer and Perales2010; Casanas et al., Reference Casanas, Simo, Casals and Prohens2017). A designated centre of diversity, the NEHR is home to a vast collection of diverse maize landraces that have been maintained under an informal seed system by the tribal farmers of the region over time (Dhawan, Reference Dhawan1964; Singh, Reference Singh1977; Kumar and Sachan, Reference Kumar and Sachan1994; Prasanna, Reference Prasanna2012; Wasala and Prasanna, Reference Wasala and Prasanna2012). The allelic richness of these landraces are yet to be explored to their full potential (Singode and Prasanna, Reference Singode and Prasanna2010) and the current study to characterize inbreds developed from the indigenous landraces of NEHR was one such attempt.
Genetic divergence studies help to define breeding strategies geared to address challenges of yield and an understanding of the same is a prerequisite for exploitation of heterosis (Yao et al., Reference Yao, Yang, Pan and Rong2007; Semagn et al., Reference Semagn, Magorokosho, Vivek, Makumbi, Beyene, Mugo, Prasanna and Warburton2012; Aci et al., Reference Aci, Lupini, Mauceri, Morsli, Khelifi and Sunseri2018). For the current subset, a significant increase in percent homozygosity ranging between 70 and 100% as against the expected theoretical average of approximately 88% (Hallauer et al., Reference Hallauer, Carena and Miranda Filho2010) on account of inbreeding leading to a deviation from Hardy–Weinberg expectations were observed. For the same SSR loci, moderate to high F st values were recorded in 22 of the 38 markers implying that these loci were favoured for genetic differentiation. Meirmans (Reference Meirmans2006) had reported that the presence of excess average heterozygotes tends to obscure genetic differentiation even in the presence of population structuring a view concurred by Aci et al. (Reference Aci, Revilla, Morsli, Djemel, Belalia, Kadri, Khelifi-Saloui, Ordas and Khelifi2013) from their studies on genetic diversity of Algerian maize accessions. They had observed that loci with high/moderate F st values contributed to increased genetic differentiation in a manner similar to what was obtained in the current study.
When extrapolated at the population level for defining natural subgroups based on maximum Hardy–Weinberg equilibrium and complete linkage equilibrium within populations (Pritchard et al., Reference Pritchard, Stephens and Donnelly2000; Liu et al., Reference Liu, Goodman, Muse, Smith, Buckler and Doebley2003), the 111 near homozygous inbred lines could be distinguished into two distinct and one admixture subgroup. As revealed by AMOVA and F st coefficients significantly greater than zero at P < 0.001, the subgrouping was a result of 17% structuring among populations. Since AMOVA and classical F coefficient interpretations are analogous, both of which are based on the null hypothesis that the population under study is one large random mating entity (Mengoni and Bazzicalupo, Reference Mengoni and Bazzicalupo2002; Holsinger and Weir, Reference Holsinger and Weir2009), an F st value of 0.17 observed at the population level not only indicated a significant deviation from panimixis but also implied the presence of a high variation in allele frequency (Holsinger and Weir, Reference Holsinger and Weir2009) between the differentiated subgroups. In fact, hierarchical splitting of the total molecular variance indicated that the subgroups were significantly differentiated at all three levels of stratification with the highest variation accounted for by the Among Individual (AI) within population component. High AI variance among individuals within a subgroup is generally the case when lines under study are derived from a broad genetic base (Reif et al., Reference Reif, Melchinger, Xia, Warburton, Hoisington, Vasal, Srinivasan, Bohn and Frisch2003) and would be advantageous for developing novel allelic combinations in F 1 hybrids for greater expression of heterosis (Springer and Stupar, Reference Springer and Stupar2007). The presence of population structuring in the current subset were further validated by a relatively low within individual (WI) component implying a low association between alleles within an individual relative to the entire population taken as a whole.
The distance-based neighbour joining cluster analysis method in a manner almost similar to grouping achieved by STRUCTURE also delineated majority of the individuals of Pop-M9 and Pop-T9 into two distinct clusters, while the remaining lines and the admixtures grouped into a third cluster which also recorded highest intra-cluster divergence. Where Nei's geographic distance and F st values at the population level indicated that Populations I and II were more divergent, neighbour joining method clearly identified lines originating from landraces belonging to Population I (S16) and Population II (T9) as the ones with the maximum genetic distance between them. These results obtained using both model-based and distance-based classification approaches revealed an almost similar pattern of population structuring clearly delineating the lines originating from certain landraces to be distinct from one another at the molecular level. Additionally, although over represented, intra-cluster divergence was also observed for individuals belonging to subpopulations Pop-M9 and Pop-T9 which had been revealed by PCoA to occupy distinct quadrants. The members of these subpopulations were also highly variable for the eight yield contributing traits studied. The divergence detected within and between the defined clusters can be attributed to have arisen from accumulated recombinations in the different lines as a result of four rounds of full sib mating prior to selfing. The process of full sib mating is advantageous over selfing in generating variability as it creates better opportunities for selection from crossing over in regions of the genome still heterozygous and give rise to new combinations (Rodrigues et al., Reference Rodrigues, Valva, Brasil and Chaves2001; Lee and Kannenberg, Reference Lee and Kannenberg2004).
However, with most of the variation seen in indigenous maize of NEHR arising either from alterations due to human intervention of the four originally grouped races (Singh, Reference Singh1977) or as a result of hybridization between them over time, moderate levels of genetic differentiation is expected and can be seen to range between 0.049 and 0.587 for the subset under study despite originating from varying altitudes. While the expression of heterosis is correlated with the genetic distance between the parental lines (Hochholdinger and Baldauf, Reference Hochholdinger and Baldauf2018), moderately differentiated lines tend to result in higher heterosis for yield as opposed to extremely divergent parents (Moll et al., Reference Moll, Lonnquist, Fortuno and Johnson1965; Springer and Stupar, Reference Springer and Stupar2007). A partial diallel experiment (unpublished data) involving 10 randomly drawn individuals from the three populations registered better parent heterosis for all of the highly variable ear-related traits in the 41 viable single cross hybrids (H1 to H41) which were evaluated. Encouraging results against the commercial checks for the inter-population crosses were also observed (online Supplementary Table S6) particularly in hybrids H3 and H19 which recorded highly significant superior grain yield/plant over all the three commercial checks in the second sowing window. The parental lines of both hybrids belonged to the moderately differentiated Populations I and III as delineated by STRUCTURE and had recorded genetic distances of 0.41 and 0.47 respectively when using the distance-based clustering approach. Also, while lines in Population I had recorded the lowest values for the highly variable ear-related traits, Population III comprised of individuals with highest values for the same. These results allow us to believe that the defined subgroups which appear to be divergent both at molecular and morphological levels can provide a suitable germplasm base for heterotic grouping.
The high variation observed for ear-related traits in the current study is already known to have a genetic basis for maize landraces of North East India (Sanjenbam et al., Reference Sanjenbam, Sen, Tyagi and Chand2018) as a result of seed selection habits of farmers which focuses mainly on ear characteristics as part of their socio-cultural requirements (Prasanna, Reference Prasanna2012). In such informal systems of selection, seed management at the individual level also plays a key role in generating variability influenced by (a) sample size, which has a bearing on genetic drift and (b) selection decisions, which are almost always tilted towards the most vigorous plants/cobs and promote heterogeneity (Pressoir and Berthaud, Reference Pressoir and Berthaud2004; Bellon and Van Etten, Reference Bellon, van Etten, Jackson, Ford-Lloyd and Parry2013). Over time, a significant amount of individuality within these landraces are generated which continue to be maintained due to space isolation (Berthaud and Gepts, Reference Berthaud and Gepts2004). However, although such a seed selection process maintained under a system of open pollination helps in evolution of the conserved traditional landraces, since it is informal in nature, morphological traits other than seed characteristics may or may not improve in the desired direction of selection. Therefore, interventions by plant breeders involving scientific selection methods become imperative for generating improved varieties (Louette and Smale, Reference Louette and Smale2000).
When such interventions involve utilization of genetically variable landraces as a potential source of inbred development, a successful single cross hybrid development would depend on the identification and utilization of heterotic groups and patterns (Melani and Carena, Reference Melani and Carena2005) where heterotic groups are a collection of related inbreds and presence of genetic variation is fundamental to such grouping (Melchinger and Gumber, Reference Melchinger, Gumber, Larnkey and Staub1998; Reif et al., Reference Reif, Melchinger, Xia, Warburton, Hoisington, Vasal, Srinivasan, Bohn and Frisch2003; Semagn et al., Reference Semagn, Magorokosho, Vivek, Makumbi, Beyene, Mugo, Prasanna and Warburton2012). With molecular markers efficiently predicting genetic divergence, there is a general consensus today that such markers can effectively assign individuals to respective heterotic groups (Melchinger et al., Reference Melchinger, Messmer, Lee, Woodman and Lamkey1991; Barbosa et al., Reference Barbosa, Geraldi, Benchimol, Garcia, Souza and Souza2003) at lower costs (Fernandez et al., Reference Fernandez, Schuster, Scapim, Vieira and Coan2015; Punya et al., Reference Punya and Kumar2018). Heterotic grouping using molecular markers also allows greater number of lines to be evaluated as opposed to traditional methods and are vital in situations where heterotic patterns for developing single cross hybrids are not well established (Gichuru et al., Reference Gichuru, Derera, Tongoona and Murenga2016), such as in the current study.
While we seek to take advantage of the locally available diversity for developing a robust hybrid breeding programme, the fear of genetic erosion with the introduction of hybrids also needs to be addressed. Studies have shown that despite introduction of hybrids, cultivation of traditional landraces continues to thrive in areas of crop diversity since it is community based, depends on an informal seed exchange system and is strongly dictated by cultural preferences of the indigenous people involved (Bellon and Hellin, Reference Bellon and Hellin2011; Fenzi et al., Reference Fenzi, Jarvis, Reyes, Moreno and Tuxill2015). Also, at the individual level, depending on the farmers' perception there is always a tradeoff between utilization of genetic resources (local/improved varieties) available at his/her disposal. While hybrids with higher responsiveness to fertilizers are generally grown under favourable ecological conditions, the hardy landraces known to give higher returns under non-optimal situations are preferred in marginal environments (Ficiciyan et al., Reference Ficiciyan, Loos, Sievers-Glotzbach and Tscharntke2018). Additionally, once heterotic groups are defined, the knowledge of the same can also be utilized for developing cost effective synthetics/composites with improved agronomic traits. Such populations when developed under conditions of open pollination will not only stem genetic drift but also generate new recombinations. Under these circumstances, the genetic diversity may even increase should the improved germplasm be more heterogeneous than the traditional landraces (van Heerwaarden et al., Reference van Heerwaarden, Hellin, Visser and van Eeuw2009).
Conclusion
For our current study, genetic analysis of this subset of inbred maize lines originating from different altitudes of NEHR of India using both model and distance-based clustering approaches showed an almost concurrent pattern of population structuring. Each defined population was also associated with a definite pattern of morphological traits leading us to conclude that these populations are distinct. Taking advantage of the promising results of the partial diallel analysis for heterosis, defining heterotic groups of the indigenous NEHR maize lines would be the next step forward. Once achieved, such a grouping would help initiate a productive breeding programme geared to address challenges of yield while utilizing the rich genetic resources local to this centre of Asiatic maize diversity.
Supplementary material
The supplementary material for this article can be found at https://doi.org/10.1017/S1479262120000246.
Acknowledgements
The authors are extremely grateful to the farmers of NEHR of India from whom the landraces for the current study were procured for their generosity. The authors are also grateful to the Central Agricultural University (Imphal), for providing the necessary infrastructure for completing all field and laboratory work and to the Jawaharlal Nehru Memorial Fund (JNMF), New Delhi, for providing financial assistance during the course of the research work. Thanks are also due to Dr Wricha Tyagi, Professor, School of Crop Improvement, for her generous help with the molecular work done. The help rendered by ICAR-NBPGR Regional Station Umroi, India for advancing the generations is also gratefully acknowledged.
Conflict of interest
None.