1. Introduction
Vortex-induced vibration (VIV) is a fundamental fluid–structure interaction phenomenon that occurs when fluid flows past bluff bodies, generating periodic vortex shedding that can induce significant structural vibrations through frequency synchronisation. This phenomenon has profound implications across multiple engineering disciplines, particularly for offshore structures like deep-sea risers, civil infrastructure including long-span bridges and tall buildings and various slender structural components exposed to fluid flow environments. The complexity and practical importance of VIV have motivated extensive research efforts spanning several decades, as documented in seminal review articles by Sarpkaya (Reference Sarpkaya1979), Bearman (Reference Bearman1984) and Williamson & Govardhan (Reference Williamson and Govardhan2004), and more recent comprehensive reviews by Wang, Fan & Lin (Reference Wang, Fan and Lin2020), Gao et al. (Reference Gao, Deng, Yang and Chen2021) and Huera-Huarte (Reference Huera-Huarte2025).
The circular cylinder has served as the canonical geometry for VIV studies due to its geometric simplicity and well-characterised vortex dynamics. Fundamental research by Huerre & Monkewitz (Reference Huerre and Monkewitz1990) established the theoretical framework for understanding stationary cylinder wakes, with the classical Kármán vortex street providing as a benchmark for wake instability. However, the wake dynamics becomes more complex when the cylinder undergoes either forced or free oscillations, particularly as the excitation frequency (
 $f_{\!e}$
) approaches the natural vortex shedding frequency (
 $f_{\!s}$
). Extensive experimental investigations by Sarpkaya (Reference Sarpkaya1978, Reference Sarpkaya1995), Bishop & Hassan (Reference Bishop and Hassan1963) and Williamson & Roshko (Reference Williamson and Roshko1988) have demonstrated that the
 $f_{\!e}/f_{\!s}$
≈ 1.0 regime represents a critical transition. This regime is characterised by discontinuous phase jumps (typically of order π) in lift forces, significant amplitude variations, qualitative changes in near-wake vortex patterns and transitions between distinct shedding modes (particularly two single vortices per cycle (2S) and two vortex pairs per cycle (2P) configurations).
Subsequent studies by Gopalkrishnan (Reference Gopalkrishnan1993); Carberry et al. (Reference Carberry, Sheridan and Rockwell2001, Reference Carberry, Sheridan and Rockwell2003, Reference Carberry, Sheridan and Rockwell2005), Morse & Williamson (Reference Morse and Williamson2009), Fan et al. (Reference Fan, Wang, Triantafyllou and Karniadakis2019) and Wang, Fan & Triantafyllou (Reference Wang, Fan and Triantafyllou2021) have revealed that vibration patterns are governed by coupled changes in the timing of vortex formation relative to cylinder motion, the reorganisation of vortex structures in the near wake and the energy transfer between the fluid and structure. Notably, similar transition phenomena have been observed across diverse bluff body geometries (triangular, rectangular, etc.) by researchers including Deniz & Staubli (Reference Deniz and Staubli1997), Zhao et al. (Reference Zhao, Leontini, Jacono and Sheridan2014), Seyed-Aghazadeh, Carlson & Modarres-Sadeghi (Reference Seyed-Aghazadeh, Carlson and Modarres-Sadeghi2017), Carlson, Currier & Modarres-Sadeghi (Reference Carlson, Currier and Modarres-Sadeghi2021), Lin & Alam (Reference Lin and Alam2024) and Benner, Carleton & Modarres-Sadeghi (Reference Benner, Carleton and Modarres-Sadeghi2025), suggesting that certain universal aspects of the underlying flow physics may transcend specific geometrical configurations. Complementary numerical studies by Blackburn & Henderson (Reference Blackburn and Henderson1999) at low Reynolds numbers have provided additional insights into the phase-coupled nature of these transitions, while Morse & Williamson (Reference Morse and Williamson2006, Reference Morse and Williamson2010) and Fan & Triantafyllou (Reference Fan and Triantafyllou2022) have successfully utilised controlled vibration data to predict free-vibration responses, offering valuable insights into the wake–body coupling dynamics.
However, under realistic marine conditions, the VIV phenomenon becomes significantly more complex. In addition to current-driven self-excited VIV, offshore structures simultaneously experience multiple excitation sources, such as wave-induced forced vibrations, shear flow effects causing spanwise-varying excitation and dynamic boundary conditions from floating platform motions. These complex interactions can create multi-frequency VIV responses characterised by several distinct features, including multiple lock-in regions along the structure’s span, travelling wave patterns with significant phase variations, nonlinear beating phenomena between competing frequencies and hybrid wake patterns combining 2S, 2P and higher-order vortex configurations. This enhanced complexity has been systematically documented in pioneering studies by Trim et al. (Reference Trim, Braaten, Lie and Tognarelli2005), Vandiver, Jaiswal & Jhingran (Reference Vandiver, Jaiswal and Jhingran2009), Bourguet et al. (Reference Bourguet, Karniadakis and Triantafyllou2011, Reference Bourguet, Lucor and Triantafyllou2012, Reference Bourguet, Karniadakis and Triantafyllou2013) and more recently by Fu et al. (Reference Fu, Fu, Ren, Xie, Xu, Zhang, Liu and Meng2022).
Despite substantial research efforts, existing studies on VIV have predominantly focused on either purely forced vibration or freely self-excited vibration, leaving the mechanism in multi-frequency VIV largely unexplored. This is particularly concerning because, in practical applications, marine structures typically experience both types of excitations simultaneously. Specifically, when the vortex shedding frequency is locked onto the natural frequency of structures through VIV, other factors such as wave-induced motions and shear flow can significantly modify the self-excited VIV mechanism. While forced vibration experiments provide controlled insights into wake synchronisation and hydrodynamic forces, and self-excited vibration studies reveal natural lock-in characteristics, the introduction of external excitation to self-excited VIV may result in a rich and complex nonlinear dynamics that significantly influences the structural response and wake patterns. Nevertheless, there still exists a critical knowledge gap regarding multi-frequency VIV in ocean environments involving waves, moving boundary conditions and shear flows. This gap in understanding is particularly critical for engineering applications where structures are subjected to both external forced vibrations (e.g. mechanical excitations, wave-induced motions) and flow-induced self-excited vibrations (e.g. vortex shedding) (Liu et al. Reference Liu, Li, Qiu, Leng, Li and Li2020).
The superposition of forced vibration on a system undergoing self-excited VIV can lead to several distinct phenomena. Existing studies by Khalak & Williamson (Reference Khalak and Williamson1999) and Carberry, Sheridan & Rockwell (Reference Carberry, Sheridan and Rockwell2005) have demonstrated that external forcing can disrupt the natural frequency matching between the fluid and the structure, leading to unexpected transitions between response branches. Forced vibration at or near the natural vortex shedding frequency may alter the classical synchronisation observed in pure VIV. Furthermore, the introduction of forced vibration modifies the classical 2S and 2P shedding modes identified by Williamson & Roshko (Reference Williamson and Roshko1988) and Nakano & Rockwell (Reference Nakano and Rockwell1993). In coupled systems, hybrid wake patterns may emerge, particularly near critical frequency ratios (
 $f_{\!e}/f_{\!s}$
≈ 1.0), where phase jumps and mode switching become highly sensitive to forcing conditions. In addition, forced vibration alters the energy exchange between the fluid and structure, as demonstrated by Blackburn & Henderson (Reference Blackburn and Henderson1999).
Despite these important findings, existing research has primarily treated forced and self-excited vibrations as independent phenomena. Few studies have systematically investigated their coupled behaviour, leaving the following critical question unresolved:
-
(i) How does forced vibration reshape the coupled dynamics of vortex-induced free vibration, and can the resulting structural responses and wake patterns be universally classified across a wide range of excitation parameters?
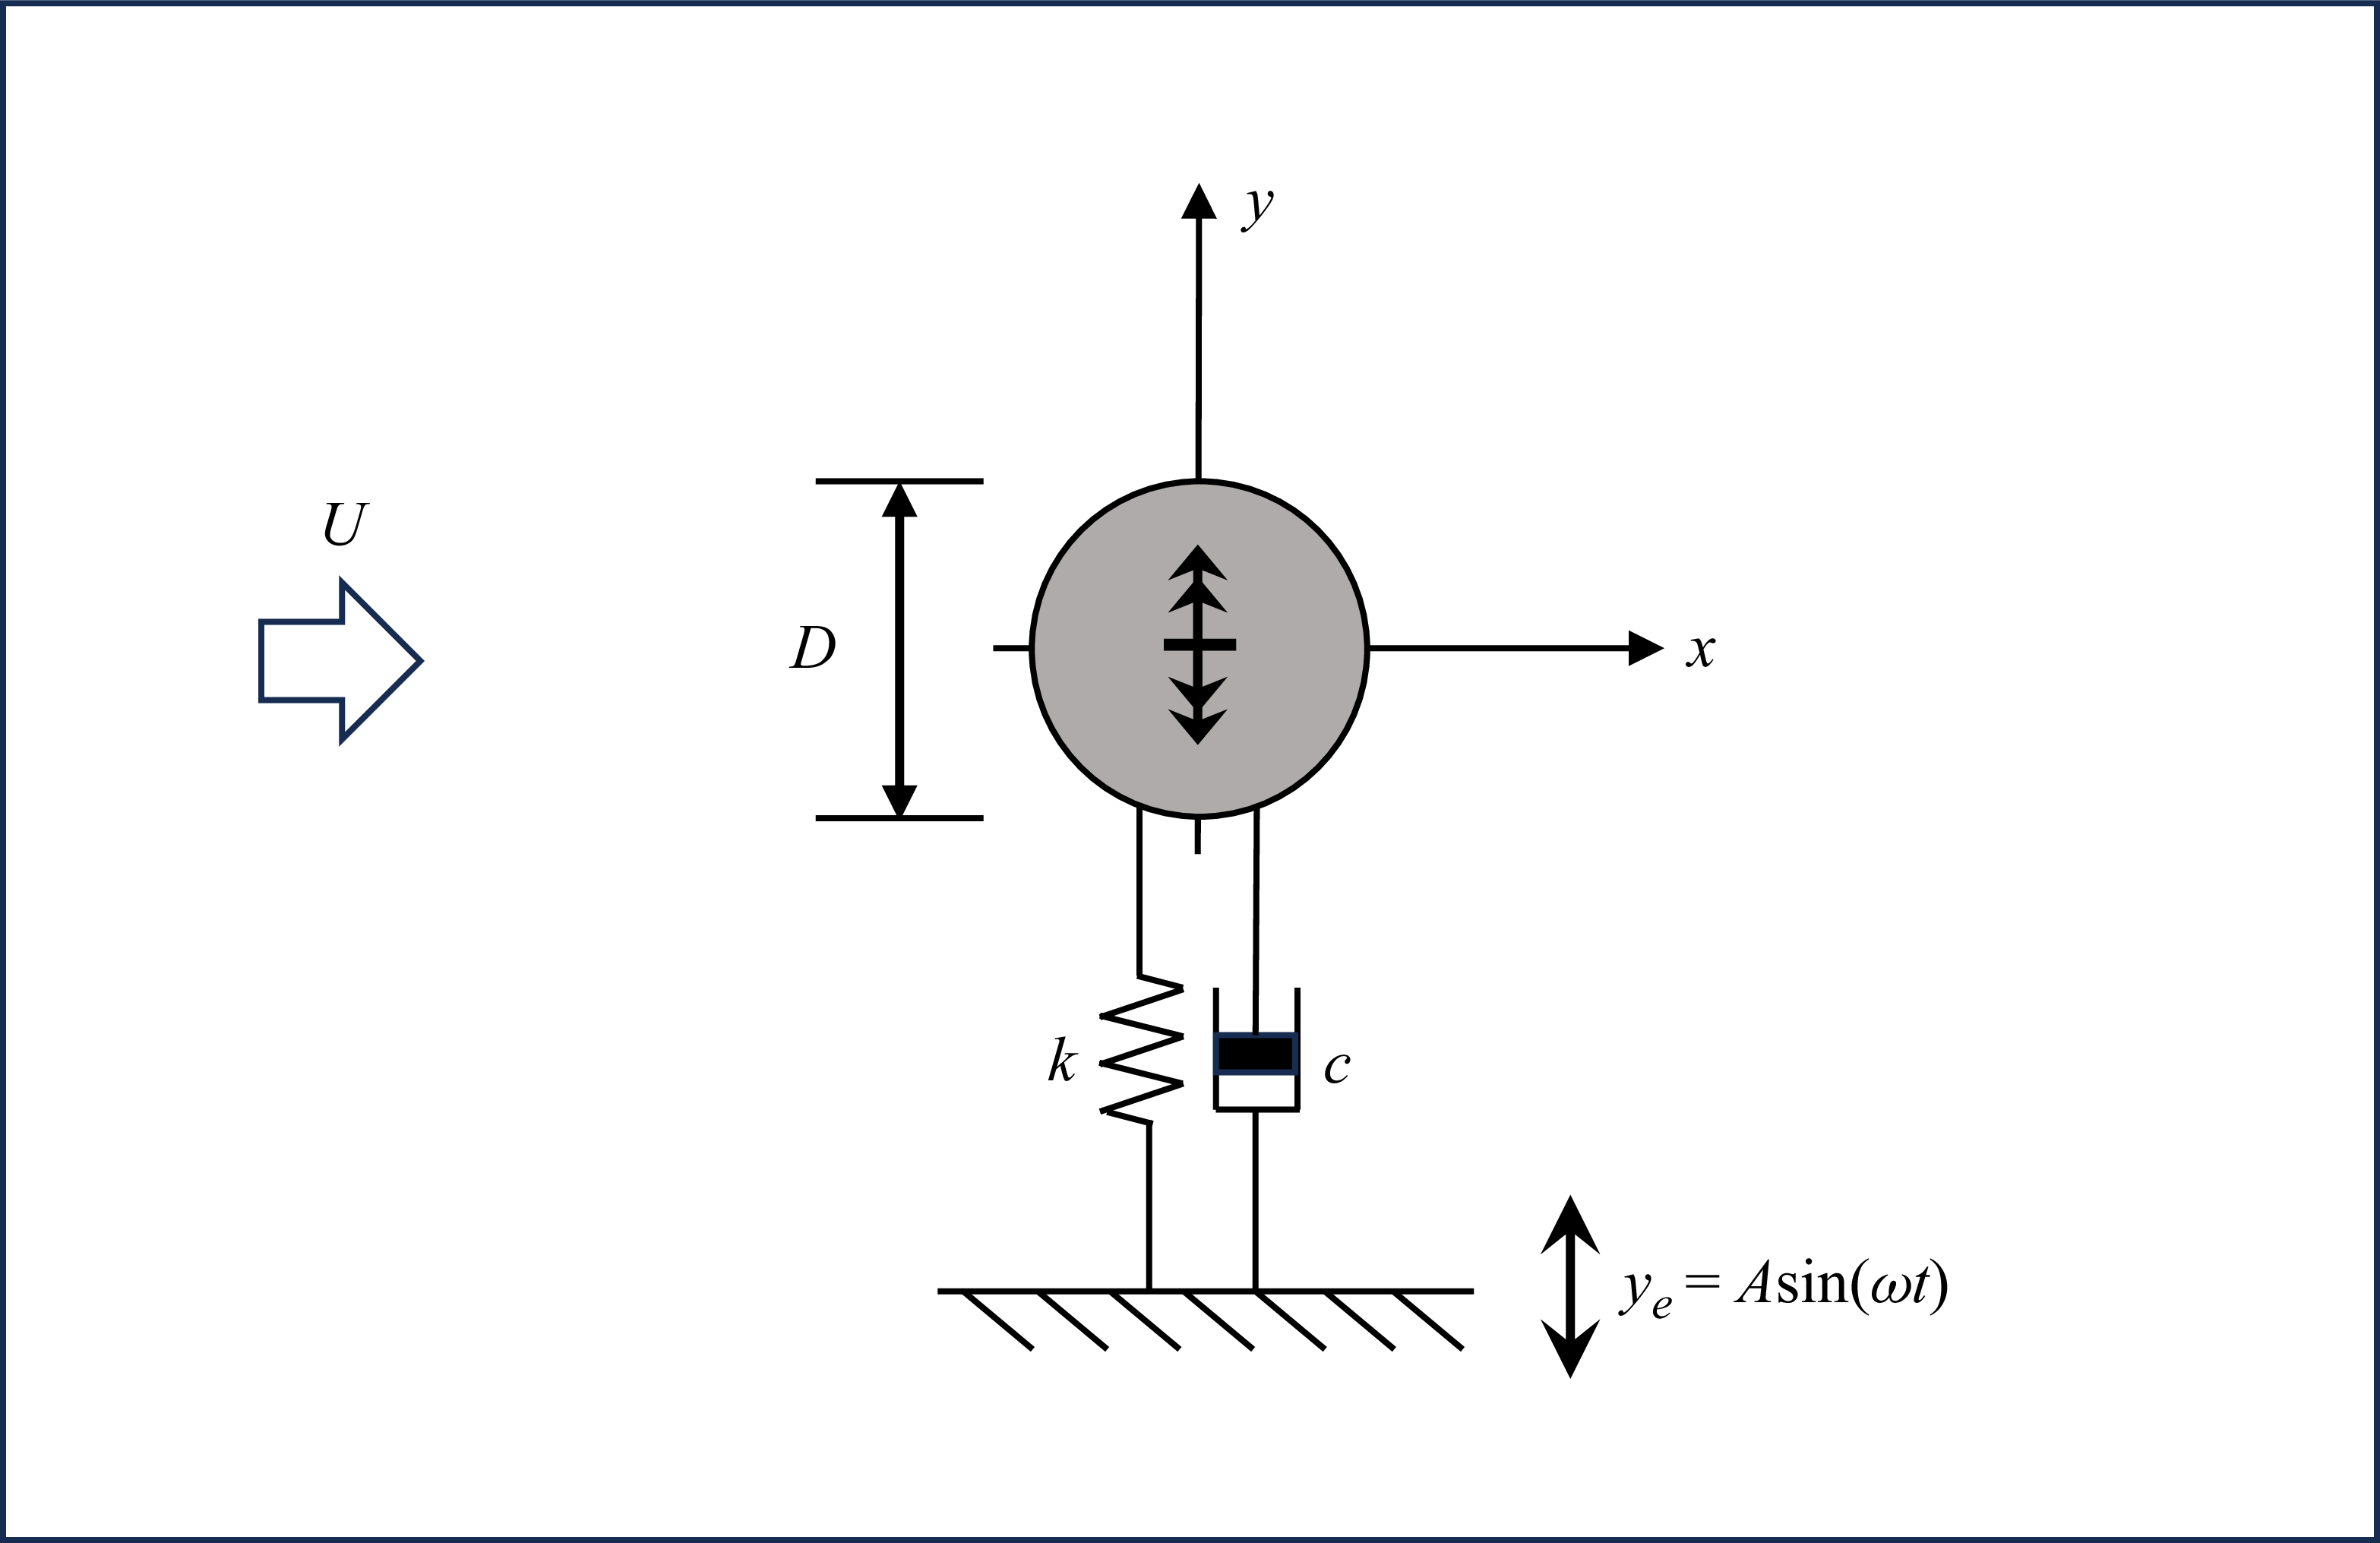
Therefore, this study aims to address these gaps by examining the dynamics of self-excited VIV under various forced excitations through systematically experimental investigations. Our experimental approach involves an elaborately designed set-up where an external actuator is installed alongside the self-excitation system, allowing precise control and measurement of both excitation components. The boundary of the self-excitation system can be sinusoidally moved to achieve two-frequency VIV response, as shown in figure 1, enabling detailed investigation of self-excited VIV under various forced parameters. Our research aims to characterise the complicated VIV response and its underlying mechanism under forced vibration, then to establish universal features in response regime, wake structure and hydrodynamic coefficients across different frequency and amplitude ratios. Through detailed flow visualisation synchronised with force measurements, we examine the complex interplay between forced and self-excited vibrations, which might highlight the need to account for coupled excitation effects in design and analysis, particularly for structures operating in dynamic fluid environments.
A schematic of configuration for self-excited VIV under forced excitation.

The paper is organised to first present the experimental methodology for studying self-excited VIV under various forced excitations, followed by detailed results on modified response characteristics and the wake dynamics under combined excitation. The concluding discussion addresses implications for both fundamental fluid mechanics and practical engineering design.
2. Experiment methodology
2.1. Experimental set-up
The experimental investigations were conducted in the Westlake University free-surface recirculating water channel facility, featuring a 100 cm (length) × 30 cm (width) × 30 cm (height) test section with transparent glass side and bottom walls for optical access. Flow velocities were precisely controlled using an electromagnetic flow meter, adjustable within the range of 0.04–0.36 m s–1 (Lin et al. Reference Lin, Sun, Liu, Zhu, Wang, Triantafyllou and Fan2024).
As illustrated in figure 2, the experimental set-up incorporated several key components: a pair of air bearings mounted above the water channel connected to the test cylinder’s upper end, with the cylinder elastically supported by springs to permit only transverse motion. An externally mounted actuator system, consisting of an electric motor connected to the spring, provided controlled forced excitation. This system was precisely aligned with the cylinder’s transverse motion axis at the same horizontal level to ensure strictly unidirectional vibrational input. The actuator’s operation was governed by a dedicated controller that enabled precise input of specified frequencies and amplitudes, generating the desired sinusoidal forced vibration patterns while maintaining strict alignment with the cylinder’s transverse degree of freedom. This configuration ensured that all excitation was confined to the transverse direction, thereby maintaining experimental repeatability and measurement accuracy.
Experimental set-up of the one-degree-of-freedom rig holding the cylinder undergoing forced vibration: (a) schematic; (b) photograph. The free stream flows out of the page in the x-axis direction.

The experimental cylinder was fabricated from a lightweight and rigid photopolymer material with an outer diameter of D = 30 mm. With an immersed length of 300 mm, the design maintained a minimal 2 mm clearance between the cylinder’s free end and the channel floor to effectively reduce end effects. These carefully controlled parameters ensured sufficient rigidity while minimising unwanted boundary interactions. The total oscillating mass for the low and high mass ratio cases was 509.0 and 4070.4 g, respectively. With a constant displaced fluid mass of approximately 212 g, the system was tested under two mass ratio configurations: a low mass ratio of
 $m^{*}$
= 2.4 and a high mass ratio of
 $m^{*}$
= 19.2. Through free decay tests in air, the natural frequency and structural damping ratio were determined to be
 $f_{0}$
= 0.8667 Hz and
 $\varsigma _{0}$
= 0.4 % for the
 $m^{*}$
= 2.4 case, and
 $f_{0}$
= 0.7707 Hz and
 $\varsigma _{0}$
= 0.08 % for the
 $m^{*}$
= 19.2 case.
Hydrodynamic forces acting on the cylinder were measured using an ATI-Gamma 6-axis force transducer mounted between the cylinder top and air bearing assembly. The cylinder displacement in the transverse direction was captured by a laser displacement sensor positioned adjacent to the water channel. The force transducer’s 6-axis capability allowed decomposition of all hydrodynamic load components, while the non-contact laser displacement measurement ensured minimal interference with cylinder dynamics. For comprehensive flow characterisation, quantitative flow measurements were conducted using a time-resolved particle image velocimetry (TR-PIV) system. To ensure high flow-following fidelity, the water tunnel was seeded with hollow glass spheres (MV-H0520) characterised by a nominal diameter of 10 μm and a density of 1.05 g/cm3, which closely matches that of water. The measurement plane was illuminated by a horizontal laser sheet (thickness
 $\approx$
2 mm) generated by a 10 W continuous-wave laser (SM-SEMI-532 nm-10W). A high-speed CMOS camera (Photron FASTCAM Mini UX50), positioned beneath the test section, captured the particle images at a resolution of 1280 × 1024 pixels with a sampling rate of 500 Hz. The acquired image sequences were processed using MicroVec 3.6.5 software. Velocity vector fields were computed using a multi-pass iterative cross-correlation algorithm, starting with an interrogation window size of 32 × 32 pixels and refining to a final window size of 16 × 16 pixels with a 50 % overlap. The field of view covered an area of at least 5D × 5D (streamwise × transverse), allowing for the detailed resolution of vortex structures. This set-up enabled synchronised acquisition of structural response and flow field data, allowing for complete analysis of the coupled fluid–structure interaction.
It should be mentioned that to ensure the reliability of the experimental data, the measurement uncertainties were evaluated through a series of rigorous repeatability tests, which account for both instrumental precision and ambient environmental fluctuations. Statistical analysis of these datasets confirms the robustness of the load cell and the accuracy of the present experimental configuration. Please refer to supplemental materials are available at https://doi.org/10.1017/jfm.2026.11533.
2.2. Experimental validation and implementation
To validate our experimental methodology, we conducted benchmark tests under mass ratio
 $m^{*}$
= 2.4 comparing our VIV results with established data from Assi, Bearman & Meneghini (Reference Assi, Bearman and Meneghini2010) and Lin et al. (Reference Lin, Sun, Liu, Zhu, Wang, Triantafyllou and Fan2024). Our investigation spanned reduced velocities (
 $U_{\!r}=U/(f_{0}D)$
) of 2.43–10.73, corresponding to flow velocities of 63–279 mm s–1 and Reynolds numbers of 1890–8370, where
 $f_{0}$
represents the natural frequency measured in air. Figure 3 presents direct comparisons of oscillation amplitudes and frequencies between our experimental data and those from Assi et al. (Reference Assi, Bearman and Meneghini2010) and Lin et al. (Reference Lin, Sun, Liu, Zhu, Wang, Triantafyllou and Fan2024) (mass ratio
 $m^{*}$
= 2.4 and 2.72, respectively), demonstrating strong agreement across three critical aspects: the lock-in velocity range, peak amplitude values and frequency response characteristics.
A comparison of experimental results in (a) the amplitude and (b) the frequency responses as a function of reduced velocity
 $U_{\!r}$
with the experiments of Assi et al. (Reference Assi, Bearman and Meneghini2010) and Lin et al. (Reference Lin, Sun, Liu, Zhu, Wang, Triantafyllou and Fan2024).

It should be also noted that in the high reduced velocity range (
 $U_{\!r}$
= 8–10), the measured vibration amplitudes are slightly lower than those reported by Assi et al. (Reference Assi, Bearman and Meneghini2010) and Lin et al. (Reference Lin, Sun, Liu, Zhu, Wang, Triantafyllou and Fan2024). This discrepancy is likely attributed to the sensitivity of the VIV response to flow turbulence at higher flow speeds. As the reduced velocity increases, the incoming flow velocity rises, which invariably enhances the background turbulence intensity and flow disturbances within the test section. High-intensity turbulence or disturbances are known to disrupt the two-dimensional coherence of vortex shedding, leading to a reduction in the spanwise correlation of the lift force (Hover, Techet & Triantafyllou Reference Hover, Techet and Triantafyllou1998). In the current set-up, stronger flow–structure interaction disturbances in the high reduced velocity regime likely contribute to the more rapid decay of vibration amplitude compared with the comparative studies. Nevertheless, despite these differences, the overall close correspondence with the existing literature confirms the reliability and accuracy of our experimental configuration. This consistent reproduction of fundamental VIV phenomena serves to validate our approach for subsequent investigations.
Then the experiments were conducted based on the aforesaid experimental set-up. Here, it is important to note that the structural parameters of the elastic support were fixed throughout the whole experiments. The spring stiffness was not adjusted (i.e. no replacement or tuning of springs was performed during the test runs). To accurately prescribe the parameters for the forced excitation applied to the self-excited system, the experiments were designed in a strict sequential procedure. First, a baseline self-excited VIV test was conducted at a target flow velocity to quantify the intrinsic oscillation frequency and the amplitude. Using these baseline characteristics as reference targets, the forced vibration was subsequently superimposed onto the system at the exact same flow velocity. By defining the forced excitation frequencies and amplitudes strictly relative to the self-excited response (i.e. specifying the frequency ratio and amplitude ratio), this two-step procedure guarantees that the applied forcing is precisely calibrated to interact with the system’s inherent fluid–structure coupling state under the specific hydrodynamic load.
3. Results and discussion
Building upon the characterised VIV response versus reduced velocity
 $U_{\!r}$
, we systematically investigated a series of representative cases:
 $U_{\!r}$
= 3.50, 3.93, 4.37, 4.81, 5.25, 6.56 for the low mass ratio (
 $m^{*}$
= 2.4), and
 $U_{\!r}$
= 4.67, 5.41, 6.14, 6.88 for the high mass ratio (
 $m^{*}$
= 19.2). For each specific
 $U_{\!r}$
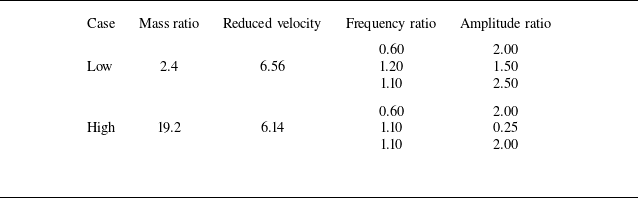
, the forced vibration parameters were explicitly prescribed based on its corresponding baseline self-excited characteristics. To systematically evaluate the interaction between the forced excitation and the intrinsic self-excited dynamics, four representative reduced velocities were selected:
 $U_{\!r}$
= 4.37, 6.56 for
 $m^{*}$
= 2.4 and
 $U_{\!r}$
= 4.67, 6.14 for
 $m^{*}$
= 19.2. These values were deliberately chosen based on the baseline free-vibration response to capture distinct fluid–structure interaction states. However, to maintain a concise and focused narrative within the main paper, the detailed analysis presented in the subsequent sections primarily concentrates on the cases of
 $U_{\!r}$
= 4.37 (
 $m^{*}$
= 2.4) and
 $U_{\!r}$
= 4.67 (
 $m^{*}$
= 19.2). For the sake of brevity, the comprehensive results and analogous interaction patterns for the higher reduced velocities (
 $U_{\!r}$
= 6.56 and 6.14) are provided in the Appendix for completeness.
The experimental matrix employed two key dimensionless parameters: the frequency ratio
 $f^{*}=f_{\!e}/f_{\!s}$
(forced to self-excited frequency) and amplitude ratio
 $A^{*}=A_{\!e}/A_{\!s}$
(forced to self-excited amplitude), spanning ranges of
 $f^{*}\in [0.25,2.0]$
and
 $A^{*}\in [0.25,4.0]$
. It should be noted that the specific frequency and amplitude ratios were selected to systematically investigate the competition mechanism between the forced excitation and the intrinsic vortex shedding. The frequency ratios
 $f^{*}$
were chosen to cover both the complete synchronisation region and detuned conditions. Similarly, the amplitude ratios
 $A^{*}$
were selected across a broad spectrum to systematically explore the transitions between different potential interaction regimes. The chosen range aims to cover scenarios progressing from weak perturbations, where the intrinsic VIV mechanism is expected to remain dominant, through a region of intense competition between forced and self-excited modes, and ultimately to conditions where the external forcing may completely dictate the response. This comprehensive parameter space was designed to facilitate the observation and capture of characteristic wake patterns, such as the 2S and 2P modes (Williamson & Roshko Reference Williamson and Roshko1988), alongside potential chaotic switching behaviours.
For each test condition at a constant flow velocity (fixed
 $U_{\!r}$
) with mass ratios
 $m^{*}$
= 2.4 and 19.2, we systematically varied the excitation ratios to comprehensively examine their effects on critical aspects of the VIV response, including oscillation amplitude, dominant frequency, phase difference, hydrodynamic force coefficients and wake vortex patterns. To specifically investigate the independent influence of the forced excitation on the overall dynamics, the structural response signal was decomposed to extract the individual forced vibration component and the self-excited vibration component, wherein the detailed process can be referred to Appendix A. This extraction is performed based on the spectral separation between the excitation frequency (
 $f_{\!e}$
) and the self-excited frequency (
 $f_{\!s}$
). If distinct spectral peaks are observed (indicating incomplete synchronisation), band-pass filters are applied around
 $f_{\!e}$
and
 $f_{\!s}$
to successfully isolate the individual forced vibration component and the self-excited vibration component. It should be noted that within the fully coupled resonant regime, the forced and self-excited vibration components become perfectly synchronised and physically inseparable. Consequently, mathematical decoupling of these individual components was not performed for this specific state. As a result, data points corresponding to the resonant regime are deliberately omitted from the isolated forced and self-excited amplitude plots. Instead, the vibration response for this complete resonant state is exclusively presented in the total global response plot. This methodological design effectively isolates the individual and combined effects of amplitude and frequency modulation while maintaining consistent baseline flow conditions.
3.1. Structural response
To systematically investigate the effects of forced vibration on VIV characteristics, we focus our analysis on VIV responses at two representative reduced velocities
 $U_{\!r}$
= 4.37 (
 $m^{*}$
= 2.4) and
 $U_{\!r}$
= 4.67 (
 $m^{*}$
= 19.2), at which the cylinder exhibits periodic oscillations with frequency
 $f_{\!s}$
= 0.79 Hz and 0.77 Hz and amplitude
 $A_{\!s}/D$
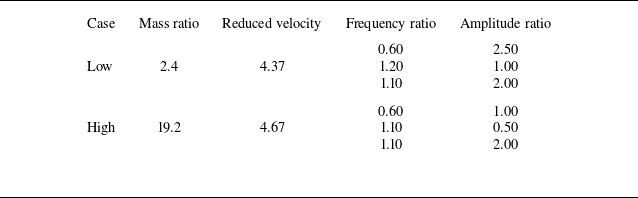
= 0.77 and 0.74, respectively. This section explores the variation of VIV response under selected forced vibration inputs as presented in table 1.
Parameters of the selected presented cases.

Figures 4 and 5 compare these cases via time histories of displacement (first column), corresponding fast Fourier transform (FFT) spectra (second column) and time–frequency distributions (third column). To capture the temporal evolution of the vibration frequency, particularly in the regime of frequency switching, a time–frequency analysis was performed using the continuous wavelet transform, as shown in the third columns of figures 4 and 5. Frequencies are normalised by the natural VIV frequency (
 $f_{\!s}$
) for consistent cross-case comparison. To better illustrate the temporal evolution of the fluid–structure interaction, the time histories of the response are plotted against a normalised time scale
 $T=t\times f_{\!s}$
. This systematic approach reveals how variations in forcing parameters reshape key aspects of the VIV response, including oscillation waveforms, spectral content and the temporal evolution of dominant frequencies, thereby offering critical insights into the complex interaction between forced and self-excited vibrations.
The dynamics of (a) self-excitation response as well as (b) dual frequency (
 $f^{*}$
= 0.60 and
 $A^{*}$
= 2.50); (c) frequency switching (
 $f^{*}$
= 1.20 and
 $A^{*}$
= 1.00) and (d) resonant response (
 $f^{*}$
= 1.10 and
 $A^{*}$
= 2.00) induced by the couple effect of forced vibration and self-excitation responses: (i) time traces; (ii) normalised power spectra and (iii) time-varying frequency components at the reduced velocity
 $U_{\!r}$
= 4.37 with mass ratio
 $m^{*}$
= 2.4.

The dynamics of (a) self-excitation response as well as (b) dual frequency (
 $f^{*}$
= 0.60 and
 $A^{*}$
= 1.00); (c) frequency switching (
 $f^{*}$
= 1.10 and
 $A^{*}$
= 0.50) and (d) resonant response (
 $f^{*}$
= 1.10 and
 $A^{*}$
= 2.00) induced by the couple effect of forced vibration and self-excitation responses: (i) time traces; (ii) normalised power spectra and (iii) time-varying frequency components at the reduced velocity
 $U_{\!r}$
= 4.67 with mass ratio
 $m^{*}$
= 19.2.

3.1.1. Oscillation pattern
As shown in figures 4 and 5, in contrast to the self-excited VIV response, three distinct oscillation regimes exhibiting significantly more complex behaviour are observed under different combinations of frequency and amplitude ratios with both low and high mass ratios (
 $m^{*}$
= 2.4 and 19.2). These regimes can be systematically classified as: (b) dual-frequency vibration (second row), (c) frequency-switching response (third row) and (d) resonant response (fourth row).
In the self-excited VIV cases with both low and high mass ratios, the cylinder undergoes nearly sinusoidal motion with constant amplitude and frequency, characteristic of classical lock-in behaviour wherein vortex shedding synchronises with the structure’s natural frequency (figures 4 a and 5 a). However, the oscillation time histories deviate significantly from sinusoidal form under dual-frequency and frequency-switching conditions, while remaining sinusoidal – albeit with larger amplitude – under resonant forcing, as shown in figures 4 and 5.
The dual-frequency regime is particularly noteworthy for its distinctive alternating amplitude pattern. For instance, in the cases
 $f^{*}$
= 0.60 and
 $A^{*}$
= 2.50 with
 $m^{*}$
= 2.4 (Figure 4
b i) and
 $f^{*}$
= 0.60 and
 $A^{*}$
= 1.00 with
 $m^{*}$
= 19.2 (Figure 5
b i), the cylinder rapidly reaches peak displacement, remains near that extremum with small residual motion for a short duration, then quickly transitions to the opposite extreme. This results in a time series exhibiting alternating segments of large and small amplitude, suggesting an interplay between the forced excitation and self-excited VIV.
More intricate behaviour arises in the frequency-switching regime (figures 4
c and 5
c), which closely resembles the amplitude beating phenomena described by Gopalkrishnan (Reference Gopalkrishnan1993). In representative cases such as
 $f^{*}$
= 1.20 and
 $A^{*}$
= 1.00 with
 $m^{*}$
= 2.4, Figure 4
c i and
 $f^{*}$
= 1.10 and
 $A^{*}$
= 0.50 with
 $m^{*}$
= 19.2, Figure 5
c i, the time traces reveal a pronounced amplitude modulation cycle. The oscillation amplitude grows rapidly, reaches a clear maximum and then decays gradually to a minimum before the cycle repeats. This regime is characterised by three key features: dominance of high-amplitude segments, hysteresis in the amplitude envelope marked by asymmetric growth and decay rates and well-defined periodicity. The observed asymmetry in amplitude evolution implies a differing energy exchange dynamics between the growth and decay phases of the response.
In contrast to these above complex patterns, the resonant response regime maintains the sinusoidal character of VIV but with significantly larger amplitudes, as observed in figures 4(d) and 5(d). The cases
 $f^{*}$
= 1.10 and
 $A^{*}$
= 2.00 with
 $m^{*}$
= 2.4 as well as
 $f^{*}$
= 1.10 and
 $A^{*}$
= 2.00 with
 $m^{*}$
= 19.2 exemplify this regime. These responses demonstrate how specific combinations of forcing frequency and amplitude can constructively enhance vibration, effectively reinforcing the natural energy transfer mechanisms associated with lock-in.
Collectively, these three regimes illustrate how forced excitation can alter the VIV response through distinct interaction mechanisms. The dual-frequency regime shows superposition effects; the frequency-switching regime indicates nonlinear competition between excitation modes; and the resonant case exhibits notable synchronisation. Transitions among these regimes are governed by the relative magnitude (amplitude ratio) and timing (frequency ratio) of the imposed forcing relative to the intrinsic VIV dynamics.
3.1.2. Frequency component
The spectral features of self-excited VIV with
 $m^{*}$
= 2.4 and 19.2 observed under forced vibration reveal a complex dynamics that complements the time-domain patterns described earlier. As shown in figures 4 and 5, each regime exhibits distinct frequency signatures that offers further insight into the underlying fluid–structure interaction mechanisms with both low and high mass ratios.
In the dual-frequency regime, the spectra consistently display two dominant peaks throughout the oscillation period: one corresponding to the natural vortex shedding frequency
 $f_{\!s}$
and the other matching the forced vibration frequency
 $f_{\!e}$
. This persistent dual-peak structure indicates the coexistence of self-excited and forced vibrations with minimal mutual interference. In other words, the two excitation mechanisms operate independently, with neither dominating nor suppressing the other.
In the frequency-switching regime, the spectral behaviour is more dynamic. The instantaneous frequency varies continuously between
 $f_{\!s}$
and
 $f_{\!e}$
, producing a characteristic ‘frequency hopping’ pattern in the time–frequency domain (figures 4
c iii and 5
c iii). This modulation reflects intermittent transitions between the two excitation modes, highlighting a competitive interaction wherein the system alternately locks onto one frequency before shifting to the other.
In contrast, the resonant response displays a fundamentally different spectral signature. Here, the vibration locks into a single, narrowband frequency component located near but not necessarily identical to
 $f_{\!s}$
(figures 4
d ii and 5
d ii). This spectral pattern reflects complete synchronisation between the forced input and natural VIV, resulting in a unified, phase-coherent response. The system behaves as a single-mode oscillator driven by the composite dynamics of both mechanisms.
Importantly, all regimes retain some spectral trace of the natural VIV frequency
 $f_{\!s}$
, indicating that flow-induced vibration mechanisms remain active even under substantial external excitation. In both dual-frequency and frequency-switching regimes, a clear spectral peak at
 $f_{\!s}$
persists, confirming the continued presence of flow-induced shedding. In the resonant case, while the dominant frequency may shift slightly from
 $f_{\!s}$
, the system remains tightly coupled to the natural shedding dynamics, as seen in figures 4(d ii) and 5(d ii).
3.1.3. Phase difference
The total phase relationship between cylinder displacement and hydrodynamic forces undergoes significant modifications under forced vibration conditions, exhibiting distinct patterns across different response regimes. As demonstrated in figure 6, the phase dynamics is evaluated across the dimensionless time
 $T$
for representative dynamic response regimes, with the left column representing the low mass ratio (
 $m^{*}$
= 2.4) and the right column representing the high mass ratio (
 $m^{*}$
= 19.2), offering critical insights into the underlying fluid–structure interaction mechanisms.
The total phase differences between motion and flow force of (a,b) self-excitation response as well as (c,d) dual frequency (
 $f^{*}$
= 0.60 and
 $A^{*}$
= 2.50,
 $f^{*}$
= 0.60 and
 $A^{*}$
= 1.00); (e, f) frequency switching (
 $f^{*}$
= 1.20 and
 $A^{*}$
= 1.00,
 $f^{*}$
= 1.10 and
 $A^{*}$
= 0.50) and (g,h) resonant response (
 $f^{*}$
= 1.10 and
 $A^{*}$
= 2.00,
 $f^{*}$
= 1.10 and
 $A^{*}$
= 2.00) at the reduced velocities
 $U_{\!r}$
= 4.37 with
 $m^{*}$
= 2.4 (a,c,e,g) and
 $U_{\!r}$
= 4.67 with
 $m^{*}$
= 19.2 (b,d, f,h).

In the absence of external forcing, both mass ratios operate in their baseline states, as demonstrated in figures 6(a) and 6(b). The phase angles exhibit only minor, random fluctuations around 0°, reflecting the inherent background turbulence and the natural energy balance between the wake and the structure.
When the system enters the dual-frequency regime, exemplified by
 $f^{*}$
= 0.60 and
 $A^{*}$
= 2.50 with
 $m^{*}$
= 2.4 (figure 6
c),
 $f^{*}$
= 0.60 and
 $A^{*}$
= 1.00 with
 $m^{*}$
= 19.2 (figure 6
d), the phase angle displays periodic oscillations indicative of intense phase modulation. As the structural response fluctuates within the amplitude envelope, the total phase angle
 $\phi$
undergoes continuous drifting interspersed with abrupt phase slips, where the angle shifts suddenly from near-minimum to near-maximum values. The continuous expansion and contraction of the phase difference reflect the periodic competition between forced and self-excited components under both low and high mass ratios, with neither mechanism fully dominating the energy transfer process.
During the frequency-switching regime (figures 6
e and 6
f), the total phase angle
 $\phi$
universally exhibits a distinct gradual drifting followed by abrupt jumps, forming a characteristic sawtooth-like wrapped trajectory. This phase slip behaviour demonstrates that the system is unlocked. The phase mismatch accumulates over time until the current fluid–structure coupling mode can no longer be sustained, inevitably triggering a sudden ‘mode switch’ to release the accumulated phase difference, a mechanism observed independently of the structural mass. This behaviour indicates more abrupt shifts between competing vibration modes observed in the frequency-switching regime, indicating stronger coupling between excitation sources, likely due to closer frequency matching.
Finally, in the resonance regime, the intense phase drifting and periodic modulations completely vanish for both mass ratios. The total phase angle
 $\phi$
rapidly converges and establishes a constant mean value, signifying perfect phase locking between displacement and hydrodynamic force, as shown in figures 6(g) and 6(h). This synchronisation represents optimal energy transfer conditions, wherein the imposed vibration aligns precisely with the natural vortex shedding, resulting in full system entrainment. All components operate in coordinated fashion, with minimal phase drift or disruption.
While the fundamental phase synchronisation mechanisms remain universally consistent, it is worth noting that the structural inertia does exert a secondary influence on the transient characteristics of these forced response models. Specifically, a higher mass ratio (e.g.
 $m^{*}$
= 19.2) can increase the system’s resistance to fluid-induced phase modulations. Consequently, the amplitude of the periodic phase oscillations during the dual-frequency regime is noticeably attenuated compared with the lighter cylinder. Furthermore, during the frequency-switching and resonance regimes, the high-inertia system exhibits more pronounced high-frequency fluctuations along the phase trajectories. This indicates that although the macroscopic mode competition dictates the global state, the immense momentum of the heavier cylinder can induce complex, higher-order harmonic interactions with the surrounding wake.
The observed phase jumps are particularly noteworthy, as they reveal discrete transitions between fluid–structure interaction states. These likely correspond to shifts in vortex formation timing relative to cylinder motion, governed by the interaction between the natural shedding cycle and the imposed forcing frequency. In contrast, the stable phase locking observed under resonant conditions indicates a complete reorganisation of the wake dynamics to accommodate and reinforce the external excitation.
3.1.4. Response amplitude
Figure 7 presents the variation of dimensionless oscillation amplitudes with respect to the frequency ratio (
 $f^{*}$
) and amplitude ratio (
 $A^{*}$
), revealing several key trends in the cylinder’s vibrational response. While both parameters influence the overall amplitude, the frequency ratio exerts a substantially greater effect on system behaviour than the amplitude ratio.
Contours of (a,d) global amplitude and amplitude components corresponding to (b,e) forced vibration and (c, f) self-excitation respectively of the cylinder across different frequency ratios
 $f^{*}$
and amplitude ratios
 $A^{*}$
at the reduced velocities
 $U_{\!r}$
= 4.37 with
 $m^{*}$
= 2.4 (a,b,c) and
 $U_{\!r}$
= 4.67 with
 $m^{*}$
= 19.2 (d,e, f).

The data are decomposed into three amplitude components: the total (global) response amplitude, the component attributable to forced excitation and the component due to self-excited VIV. Notably, despite the inherent differences in structural inertia, the topological distributions of the amplitude contours exhibit universally consistent patterns across both low and high mass ratios, highlighting a fundamental fluid–structure interaction mechanism. It can be observed from figure 7 that, with both mass ratios
 $m^{*}$
= 2.4 and 19.2, as the forcing frequency approaches the natural frequency of self-excitation (i.e.
 $f^{*}$
→ 1), all three components exhibit notable trends. In particular, both the global and self-excited amplitudes increase remarkably, reaching peak values near resonance. This amplification phenomenon signifies strong coupling between the forced excitation and natural VIV response when their frequencies align. However, the forced vibration component follows a non-monotonic ‘V-shaped’ trend with respect to
 $f^{*}$
. At high amplitude ratios, this component initially decreases as
 $f^{*}$
approaches 1.0, reaching a local minimum near resonance before increasing again as
 $f^{*}$
moves further away. This behaviour suggests the presence of competing energy transfer pathways between the forced and self-excited modes.
Amplitude ratio
 $A^{*}$
also influences these response components, but in a more nuanced manner. Increasing
 $A^{*}$
consistently amplifies both global and self-excited amplitudes across the entire frequency range. However, the forced vibration component shows dual behaviour: it increases near resonance but diminishes at off-resonant frequencies. This contrast highlights the system’s sensitivity to the frequency alignment between external excitation and natural shedding.
These observations point to two dominant physical mechanisms underlying the response: resonance enhancement and energy distribution. When
 $f^{*}$
≈ 1.0, the imposed vibration frequency aligns with the natural vortex shedding frequency, resulting in constructive interference and significantly amplified amplitudes. This condition corresponds to optimal energy transfer between the fluid and the structure. For off-resonance conditions (
 $f^{*}$
< 0.8 or
 $f^{*}$
> 1.3), frequency mismatch leads to more complex energy partitioning between excitation modes. Instead of reinforcing each other, the forced and self-excited components interact destructively or shift energy across modes, leading to reduced amplitudes in one or more components.
The balance between these mechanisms, resonance enhancement and off-resonance energy redistribution, governs the system’s overall response. Their interplay explains the characteristic amplitude trends observed across the range of excitation parameters, offering a clear framework for tuning forced vibration inputs to control VIV responses.
3.2. Hydrodynamic coefficient
As VIV response is closely related to the change of the hydrodynamic forces (Zhu et al. Reference Zhu, Xu, Alam, Gao and Zhou2023), this section examines the fluid forces acting on the cylinder under varying excitation conditions. To elucidate the complex vibration mechanisms under varying
 $f^{*}$
and
 $A^{*}$
, we employ two analytical parameters following the methodology used in Fan & Triantafyllou (Reference Fan and Triantafyllou2022): the energy transfer coefficient (
 $C_{lv}$
) and effective added mass coefficient (
 $C_{\textit{my}}$
).
These coefficients enable quantitative evaluation of two fundamental aspects of fluid–structure interaction. Here,
 $C_{lv}$
quantifies energy exchange between the fluid and the structure by measuring the in-phase component of the lift force with respect to velocity and
 $C_{\textit{my}}$
characterises the inertial effect of the fluid, representing the added mass contribution to the structural response. The coefficients are defined as
 \begin{equation} C_{lv}=\frac{F_{0}\textit{sin}\phi }{\rho \textit{DU}^{2}L}, \end{equation}
 \begin{equation} C_{\textit{my}}=-\frac{F_{0}\textit{cos}\phi }{A_{0}\pi ^{3}f^{2}D^{2}\rho L}, \end{equation}
where
 $A_{0}$
and
 $F_{0}$
are the amplitude of the cylinder motion and fluid force, respectively,
 $\phi$
is the phase difference between the cylinder motion and fluid force and
 $f$
denotes the oscillation frequency.
It should be emphasised that, due to the time-varying nature of the phase difference, particularly in the dual-frequency and frequency-switching regimes, a global time average of the hydrodynamic coefficients would yield unrepresentative results. Therefore, the energy transfer coefficient (
 $C_{lv}$
) and effective added mass coefficient (
 $C_{\textit{my}}$
) were evaluated using a moving cycle-average method. For states exhibiting constant phase (e.g. pure resonant response), the reported values represent the temporal mean of these stable cycle-averaged results. For transitional states, the analysis specifically targets the values within localised, quasi-steady temporal windows to accurately reflect the instantaneous fluid–structure energy transfer.
Figures 8 and 9 present contour plots of the experimentally measured coefficients
 $C_{lv}$
and
 $C_{\textit{my}}$
across different
 $f^{*}$
and
 $A^{*}$
with mass ratios
 $m^{*}$
= 2.4 and 19.2. The analysis focuses on three components of the system response: the total (global) system response, the forced vibration contribution and the self-excited component. This decomposition provides insight into how imposed forcing alters fundamental fluid–structure interaction characteristics across distinct vibration regimes.
Contours of (a,d) global excited coefficient and the excited coefficient components corresponding to (b,e) forced vibration and (c, f) self-excitation respectively of the cylinder across different frequency ratios
 $f^{*}$
and amplitude ratios
 $A^{*}$
at the reduced velocities
 $U_{\!r}$
= 4.37 with
 $m^{*}$
= 2.4 (a,b,c) and
 $U_{\!r}$
= 4.67 with
 $m^{*}$
= 19.2 (d,e, f).

Contours of (a,d) global added mass coefficient and the added mass coefficient components corresponding to (b,e) forced vibration and (c, f) self-excitation respectively of the cylinder across different frequency ratios
 $f^{*}$
and amplitude ratios
 $A^{*}$
at the reduced velocities
 $U_{\!r}$
= 4.37 with
 $m^{*}$
= 2.4 (a,b,c) and
 $U_{\!r}$
= 4.67 with
 $m^{*}$
= 19.2 (d,e, f).

The results in figures 8 and 9 demonstrate strong dependence of both hydrodynamic coefficients
 $C_{lv}$
and
 $C_{\textit{my}}$
on excitation parameters, wherein the contour maps clearly show distinct response regions corresponding to different vibration regimes, highlighting how variations in
 $f^{*}$
and
 $A^{*}$
govern both energy transfer and fluid-induced inertial effects. Consistent with the amplitude response behaviour, the topological distributions of these force coefficients exhibit universally similar patterns across different structural mass ratios.
3.2.1. Energy transfer coefficient
The sign and magnitude of
 $C_{lv}$
provide direct insight into the direction of energy flow between the fluid and the oscillating cylinder. A positive value of
 $C_{lv}$
indicates net energy transfer from the fluid to the structure, sustaining motion, while a negative value signifies that the fluid extracts energy from the structure, acting as a damper.
Under forced vibration, the energy transfer characteristics exhibit complex dependence on excitation parameters, as shown in figure 8. It can be observed that regardless of mass ratios, the value of
 $C_{lv}$
can be notably affected by the variation of frequency ratio while large amplitude ratio can also pose a remarkable effect on
 $C_{lv}$
. Compared with the amplitude ratio, the variation of frequency ratio plays a dominated role in affecting
 $C_{lv}$
. As the frequency ratio is approaching 1.0,
 $C_{lv}$
shows dramatic reduction, particularly for
 $A^{*}$
> 2.0. This reduction is most evident in the global system response, which shows a broad, intense drop in
 $C_{lv}$
near resonance (
 $f^{*}$
≈ 1.0), while the forced vibration component exhibits a narrower transition band centred at the same frequency.
In addition, the increase of the amplitude ratio can also decrease the value of
 $C_{lv}$
, especially near resonance. As seen in figure 8, significant modifications for
 $C_{lv}$
only occur at the amplitude ratio
 $A^{*}$
> 1.0. In contrast, for small amplitude ratios, the frequency dependence of
 $C_{lv}$
is minimal. These observations indicate that resonance-induced damping is strongly amplified by large vibration amplitudes.
Notably, all experimentally measured values of
 $C_{lv}$
remain negative, across the tested parameter space, indicating consistent energy dissipation regardless of the excitation condition. Particularly striking is the behaviour of the self-excited component. Under natural VIV conditions, this component is inherently responsible for extracting energy from the flow to drive the vibration (which would yield a positive coefficient). However, under strong external forcing near resonance, the intrinsic VIV mechanism is completely suppressed, and its energy transfer direction is unequivocally reversed. The violently sheared, enslaved wake actively dissipates energy rather than feeding it. Furthermore, the global system response exhibits an even broader and stronger damping transition than its individual parts, suggesting that the dynamic interplay between the forced and self-excited components enhances the net energy loss well beyond simple linear superposition.
While the overarching topological distributions of the damping valleys are universally similar, comparing the top and bottom panels reveals the profound modulating effect of the structural mass ratio. For the high mass ratio cylinder, the absolute magnitudes of the negative excitation force coefficients are drastically amplified. This significant amplification indicates that maintaining large-amplitude oscillations for a heavy structure requires overcoming a proportionally more violent hydrodynamic resistance. The immense structural momentum forces a more aggressive shearing of the boundary layers and a more delayed, energetic rupture of the vortices.
These findings imply that the fluid acts as a persistent energy sink, even under strong external excitation. The particularly sharp reduction of
 $C_{lv}$
near resonance (
 $f^{*}$
≈ 1.0) suggests that frequency matching enhances energy extraction from the structure, possibly due to improved synchronisation of vortex shedding or an altered wake dynamics. The consistently negative
 $C_{lv}$
values confirm that forced excitation, although capable of controlling amplitude, does not reverse the direction of energy flow in the system. Instead, the imposed vibration must overcome fluid-induced damping entirely, and the interplay between forced and self-excited components contributes to enhanced global damping.
3.2.2. Added mass coefficient
In terms of the added mass coefficient (
 $C_{\textit{my}}$
), complex behaviour is observed under forced vibration conditions, as shown in figure 9. By analysing the global response alongside its decoupled components across different structural mass ratios, the fundamental mechanisms of inertial modulation are explicitly revealed.
For both the global VIV response and the forced vibration component,
 $C_{\textit{my}}$
maintains consistently positive values across all tested frequency and amplitude ratios. However, its magnitude shows a strong dependence on excitation parameters, establishing a pronounced V-shaped ‘trough’ strictly localised around the primary synchronisation bandwidth (
 $f^{*}$
≈ 1.0).
At large amplitude ratios (
 $A^{*}$
> 2.0),
 $C_{\textit{my}}$
exhibits a dramatic reduction as the excitation frequency approaches resonance, reaching a distinct minimum before increasing again. This characteristic trough behaviour implies a significant alteration in the fluid’s inertial contribution when the imposed vibration aligns with the natural vortex shedding frequency. Physically, within the resonant regime, the intense synchronisation dictates that the dominant fluid forces align with the structural velocity (acting as hydrodynamic damping) rather than the acceleration, thereby minimising the fluid’s inertial contribution.
Furthermore, the system’s response to variations in the amplitude ratio reveals a unique threshold-like behaviour. Below
 $f^{*}$
≈ 1.2, increasing
 $A^{*}$
leads to reduced values of
 $C_{\textit{my}}$
, while above this critical frequency, the opposite trend emerges, with
 $C_{\textit{my}}$
growing alongside
 $A^{*}$
. This transition indicates a shift in the dominant fluid–structure interaction mechanism at higher frequencies. In contrast, at low amplitude ratios (
 $A^{*}$
< 1.0),
 $C_{\textit{my}}$
exhibits minimal sensitivity to frequency variations.
In contrast, the signal decomposition exposes a markedly different behaviour in the self-excitation component of
 $C_{\textit{my}}$
, which diverges entirely from the V-shaped valley topology. Most notably, it exhibits a strong horizontal gradient that is heavily dependent on frequency but possesses negligible sensitivity to
 $A^{*}$
.
A distinct transition from negative to positive values can be observed at
 $f^{*}$
≈ 0.5 for low mass ratio, accompanied by a rapid increase in
 $C_{\textit{my}}$
within the low-frequency range (
 $f^{*}$
< 0.5) and continuous growth across the entire frequency spectrum. The negative values of
 $C_{\textit{my}}$
observed at low frequency ratios indicate a phase inversion in the fluid inertial response. A negative added mass coefficient implies that the intrinsic wake acts to effectively reduce the system’s apparent mass, providing a force in the same direction as the structural acceleration. This behaviour stems from fundamental changes in vortex shedding timing relative to the cylinder’s motion, forcing the wake to transition from an inertia-reducing agent to a heavy inertial burden as the excitation frequency increases.
Comparing the low and high mass ratio configurations reveals the profound amplifying effect of structural inertia on these inertial fluid forces. For the high mass ratio cylinder, the absolute values and the gradient steepness of the added mass coefficients are significantly amplified across the parameter space. Because the heavy cylinder introduces immense structural momentum into the flow, the fluid is forced to undergo much more violent accelerations and decelerations to conform to the prescribed kinematics. This aggressive shearing forces the fluid to generate a proportionally larger inertial reaction force, leading to more densely packed contour gradients. This confirms that large structural inertia leads to more abrupt dynamic transitions and a sharpened resonant boundary.
Perhaps most importantly, the experimental data reveal that the
 $C_{\textit{my}}$
components from forced vibration and self-excitation do not superimpose linearly to yield the global response. This nonlinear combination highlights the complex mode competition between the two excitation mechanisms, which fundamentally alters the system’s overall added mass behaviour. The external forcing actively manipulates the phase and spatial distribution of the wake, dictating how much of the fluid force manifests as damping versus inertial modulation. These macroscopic modifications arise directly from underlying changes in vortex formation and wake dynamics, which will be analysed in detail in the subsequent section on wake structure.
3.3. Response regimes
With variation in the frequency and amplitude ratios, figure 10 consistently reveals the emergence of three distinct vibration regimes – dual-frequency, frequency-switching and resonant responses – across a range of reduced velocities (
 $U_{\!r}$
= 4.37 and 6.56 with
 $m^{*}$
= 2.4 and
 $U_{\!r}$
= 4.67 and 6.14 with
 $m^{*}$
= 19.2), thereby validating the universal applicability of this regime classification framework. The results indicate that the frequency ratio is the primary controlling parameter for regime transitions, while the amplitude ratio dictates the synchronisation bandwidth and coupling strength across all tested conditions under both low and high mass ratios.
Response regimes across different frequency ratios and amplitude ratios at various reduced velocities
 $U_{\!r}$
= (a) 4.37, (b) 6.56 with
 $m^{*}$
= 2.4 and
 $U_{\!r}$
= (c) 4.67, (b) 6.14 with
 $m^{*}$
= 19.2. Green triangles: dual-frequency response; blue circles: frequency-switching response; red squares: resonant response.

It can be seen from figure 10 that dual-frequency responses dominate at both low (
 $f^{*}$
< 0.7) and high (
 $f^{*}$
> 1.3) frequency ratios, appearing consistently regardless of amplitude variations with
 $m^{*}$
= 2.4 and 19.2. This regime corresponds to a weak coupling state where the forced and natural shedding frequencies operate independently. The resonant response is concentrated in a V-shaped core region near
 $f^{*}\approx$
0.8–1.25. While it generally requires sufficient forcing strength (i.e. high amplitude ratios), perfect frequency alignment (
 $f^{*}\approx$
1.0) allows resonance to occur at amplitude ratios as low as
 $A^{*}\approx$
0.25. Increasing the amplitude ratio significantly expands the bandwidth of this resonant domain. Additionally, higher reduced velocities (e.g.
 $U_{\!r}$
= 6.56) promote the onset of resonant behaviour at lower-amplitude thresholds for the low mass ratio. Acting as a transitional buffer, the frequency-switching response emerges envelops the resonant core. It emerges primarily near the resonance boundaries where the system struggles to maintain stable synchronisation, reflecting intense mode competition.
A comparison of the regime maps reveals a significant dependence of the transition boundaries on the mass ratio (
 $m^{*}$
). Notably, as
 $m^{*}$
increases, the transition region completely vanishes at high amplitude ratios and is markedly compressed at low frequency ratios. This topological shift is fundamentally governed by the increasing dominance of structural inertia. In the high-amplitude regime, the transition zone, which typically manifests as mode competition, disappears for heavy cylinders. Because the structural inertia is large, the external forcing required to maintain high amplitudes overwhelmingly dominates the relatively weak self-excited hydrodynamic forces. Consequently, the wake loses its ability to compete and is completely enslaved by the structural kinematics, leading to an abrupt boundary between states rather than a gradual transition. Furthermore, in the low frequency ratio regime, the large structural inertia renders the cylinder less susceptible to fluid-induced phase modulations. The hydrodynamic forces are insufficient to sustain a broad region of phase-drifting competition against the heavy, detuned structure. As a result, the synchronisation boundaries become sharper, and the parameter space occupied by the transition region is significantly reduced.
Importantly, the selected reduced velocities represent characteristic points along both the upper and lower branches of the VIV response curve under low and high mass ratios, confirming the robustness of the proposed classification scheme across fundamental VIV regimes. The consistent patterns observed across different flow conditions strongly suggest that the identified vibration regimes reflect intrinsic response modes in coupled forced and self-excited VIV systems, rather than artefacts of specific experimental configurations.
3.4. Flow characteristics
This section presents a comprehensive comparative analysis of wake patterns across three distinct forced vibration regimes (dual-frequency, frequency-switching and resonant responses) against the baseline natural self-excited VIV. The analysis focuses on a representative reduced velocity of
 $U_{\!r}$
= 4.37 with the low mass ratio of
 $m^{*}$
= 2.4. Given that the fundamental topological evolution of the wake across these three dynamic regimes remains highly consistent regardless of the structural mass ratio, this specific configuration serves as a robust representative case to elucidate the underlying vortex dynamics. To explore in detail the vortex generation, shedding and interaction mechanisms, TR-PIV measurements were utilised to visualise the vorticity contours. Representative cases were selected for the dual frequency (
 $f^{*}$
= 0.50 and
 $A^{*}$
= 2.00), frequency switching (
 $f^{*}$
= 1.25 and
 $A^{*}$
= 1.50) and resonant response (
 $f^{*}$
= 1.10 and
 $A^{*}$
= 2.00), along with the self-excited VIV. For each scenario, the instantaneous wake structure is strictly correlated with the time histories of cylinder displacement, hydrodynamic force and phase difference. To enhance the visualisation of the coherent wake structures, the instantaneous PIV velocity and vorticity fields were post-processed using a short-window temporal smoothing technique. Specifically, a moving-average filter spanning ten adjacent frames was applied to the raw transient data. Given the high sampling rate of the TR-PIV system, this narrow temporal window effectively filters out high-frequency spurious noise while rigorously preserving the instantaneous topological features of the dynamic vortex shedding process.
In addition, advanced analytical treatments were applied to the hydrodynamic phase and forces to deeply generalise the findings and verify the physical origin of the measured responses. First, it is recognised that the total hydrodynamic phase (
 $\phi$
) inherently contains contributions from both the added mass (potential flow) and the vorticity dynamics. Because the potential force is always 180° out of phase with the structural acceleration, it tends to mask the subtle variations caused by the wake. By mathematically removing this potential component, the isolated vortex phase (
 $\phi _{vor}$
) serves as a much more sensitive indicator for tracking the timing of the vortex shedding process and detecting wake mode bifurcations (Jauvtis & Williamson Reference Jauvtis and Williamson2004). Furthermore, a theoretical analysis based on vortex impulse theory was performed here. Because the structural dynamics is governed by a linear deterministic system, the observed complex behaviours (e.g. dual-frequency coexistence and frequency switching) stem fundamentally from nonlinear fluid–structure interactions. Rather than employing a simplified phenomenological model that assumes independent superimposed loads, we apply vortex impulse theory to our TR-PIV data. By reconstructing the hydrodynamic forces directly from fluid momentum transfer and wake topology evolution, this approach accurately captures the deep coupling between the forced and self-excited fluid components that a basic superposition model would obscure. According to this theory, the instantaneous fluid force acting on the cylinder is directly related to the rate of change of the vorticity field’s impulse. By extracting the vorticity integration from the flow field at successive time steps and tracking the circulation strength, we reconstructed the theoretical vortex-induced force curve. This rigorously bridges the measured kinematics with theoretical momentum transfer. Details of this theoretical application can be found in Appendix B (Kang et al. Reference Kang, Liu, Su and Wu2018; Yuan et al. Reference Yuan, Kang, Dai, Ge and Fan2025).
During the analysis and discussion, particular attention is devoted to changes in vortex formation length, shedding phase and wake symmetry, as these features provide critical physical insight into the distinct fluid–structure interaction mechanisms at play. The analysis highlights the departure from classical 2S or 2P wake modes under the effect of forced vibration, demonstrating how different combinations of frequency and amplitude ratios reorganise the wake structure. This comparison underscores how external forcing modulates the vortex dynamics relative to the baseline self-excited VIV response, fundamentally altering the fluid’s momentum transfer and contributing to the observed variations in structural vibration characteristics.
3.4.1. Self-excited VIV response
To deeply unveil the underlying physical mechanisms of the fluid–structure interaction, figure 11 extracts the macroscopic mechanical responses over a typical vibration cycle (
 $T^{*}$
) and perfectly aligns them with the transient evolution of the vorticity field. A joint analysis of the structural displacement (
 $y_{t}/D$
), total hydrodynamic force (
 $C_{y}$
), reconstructed vortex-induced force (
 $C_{yv}$
), total phase angles
 $\phi$
, vortex phase angles
 $\phi _{vor}$
and the corresponding vortex shedding contours at four representative instants (a, b, c, d) clearly elucidates the intrinsic connection between energy transfer and wake topology. Crucially, this detailed characterisation of the natural self-excited state is explicitly presented to establish a fundamental baseline, providing a direct comparative reference for the distinct wake modulations and topological variations observed under the forced vibration regimes discussed subsequently.
The time history of the displacement (black) and direct force measurement (orange) (first row), the displacement (black) and reconstructed vortex force from PIV vorticity fields (purple) (second row), the total phase difference (orange) and calculated vortex phase difference (purple) (third row) as well as its corresponding time-averaged vorticity fields over a cycle of oscillation for self-excitation response at the reduced velocity
 $U_{\!r}$
= 4.37 with
 $m^{*}$
= 2.4.

As illustrated in the first and second rows of figure 11, the cylinder’s displacement (black line) exhibits a highly synchronised evolution with both the measured total lift force
 $C_{y}$
(orange line) and the flow-field-reconstructed vortex-induced force
 $C_{yv}$
(purple line), reaching their peaks and troughs almost simultaneously. This phenomenon is perfectly corroborated by the phase angle trajectories in the third row: throughout the entire cycle, both the total phase angle
 $\phi$
and the isolated vortex phase angle
 $\phi _{vor}$
stably fluctuate around 0°. A phase angle near 0° is the hallmark of a perfect resonance (lock-in) state, indicating that the efficiency of the fluid performing positive work on the cylinder is maximised. The fluid energy is optimally transferred to the structure to sustain its large-amplitude oscillations. Furthermore, the remarkable agreement in waveform and phase between the reconstructed vortex force
 $C_{yv}$
and the total lift force
 $C_{y}$
confirms that transient vortex dynamics strictly dictates the driving forces during self-excited vibration.
The TR-PIV vorticity contours in the fourth and fifth rows reveal the microscopic wake origins driving these force fluctuations. The flow field during this cycle demonstrates a classic, large-amplitude 2P vortex shedding mode. At instant (a), both the displacement and the vortex-induced force are at or near their positive peaks. A massive positive (counter-clockwise) vortex, denoted as P
1, has fully matured on the right surface and is initiating shedding. Simultaneously, a strong negative (clockwise) shear layer, N
1, attaches to the left surface. The shedding of P
1 directly corresponds to the climax of the positive lift force. As the cylinder moves downward to instant (b), the lift force
 $C_{y}$
rapidly drops toward zero. Vortex P
1 convects downstream, while the negative shear layer on the left side ruptures and rolls up, successively forming two distinct negative vortices, N
1 and N
2. This separation of same-sign vortices is the defining characteristic of the 2P mode. At instant (c), the cylinder reaches its lowest trajectory point, with both
 $C_{y}$
and
 $C_{yv}$
synchronously hitting their negative peaks. Here, the negative vortex N
2 fully develops and sheds, generating a massive negative suction force. Concurrently, a new positive vortex P
2 begins to incubate on the right side, accompanied by a nascent negative shear layer N
3 left. Then the cylinder rebounds upward, arriving at instant (d), and vortex N
2 advects downstream. The right shear layer rolls up again, shedding vortex P
2, which is immediately followed by the generation of another positive vortex P
3. This completes the paired shedding of same-sign vortices, prompting the lift force to recover.
Similar to the traditional self-excited VIV, the observed 2P mode exhibits strong periodicity, symmetry and coherence in vortex generation and propagation, providing critical validation of the experimental set-up and measurement fidelity. These experimental results establish a baseline wake structure, serving as a crucial reference for the subsequent analysis of wake modifications under externally forced vibration conditions. In the following cases under the effect of forced excitations, we anticipate substantial departures from the classical 2P mode, reflecting the influence of imposed excitation frequency and amplitude on the wake dynamics.
3.4.2. Dual-frequency response
In stark contrast to the perfectly synchronised self-excited VIV, figure 12 illustrates the complex fluid–structure interaction dynamics within the dual-frequency regime. This unique regime emerges from the nonlinear interplay between the external forced vibration and the natural self-excitation. Unlike a pure self-excited VIV system, which maintains a stable amplitude and a constant phase, the imposition of the forced vibration induces a pronounced amplitude modulation in both the structural displacement (
 $y_{t}/D$
) and the total hydrodynamic force (
 $C_{y}$
). This modulation envelope is the macroscopic manifestation of the forced vibration continuously interfering with the intrinsic self-excited fluid force.
The time history of the displacement (black) and direct force measurement (orange) (first row), the displacement (black) and reconstructed vortex force from PIV vorticity fields (purple) (second row), the total phase difference (orange) and calculated vortex phase difference (purple) (third row) as well as its corresponding time-averaged vorticity fields over a cycle of oscillation for the dual-frequency response (
 $f^{*}$
= 0.50 and
 $A^{*}$
= 2.00) at the reduced velocity
 $U_{\!r}$
= 4.37 with
 $m^{*}$
= 2.4.

By correlating these macroscopic time histories, including the reconstructed vortex-induced force
 $C_{yv}$
, with the total phase angles
 $\phi$
and the isolated vortex phase angles
 $\phi _{vor}$
over a modulation cycle
 $T^{*}$
, the core mechanism of this external disruption is explicitly revealed. The most critical evidence of this interference lies in the phase dynamics:
 $\phi _{vor}$
cannot maintain a locked state; instead, it is forced to drift continuously. In the presented case, near
 $T^{*}\approx$
0.4, at the node of the modulation envelope, the external kinematic constraint completely overwhelms the intrinsic fluid rhythm, forcing an abrupt phase slip (wrapping from near + 180° to −180°). This confirms that the forced vibration periodically suppresses and unlocks the self-excited mechanism, continuously reversing the direction of the fluid–structure energy transfer.
This continuous phase drifting physically reorganises the natural vortex shedding process, as demonstrated by the microscopic PIV contours (panels (a)–(i)) in figure 12. The phase mismatch due to the imposed forced vibration actively breaks the stable synchronisation of the shear layers, preventing the wake from sustaining a classical, singular 2S or 2P mode. Instead, the fluid continuously adapts its vortex formation process to match the evolving momentum and pressure fields, resulting in a recurring alternation of shedding modes that closely corresponds to the modulated amplitude.
During the peak of the modulation cycle, the system experiences constructive interference where the energy inputs from both forcing sources are momentarily aligned. In this large-displacement phase, the boundary layer on the suction side separates cleanly to form a strong clockwise vortex N 1, while simultaneously an anticlockwise vortex P 1 forms on the pressure side. As the cylinder continues to oscillate within its large-displacement vibration cycle, the vortex N 1 is stretched downstream, delaying its detachment. Concurrently, P 1 intensifies and bisects the trailing edge of N 1, indicating enhanced shear layer interaction. Subsequently, a new clockwise vortex N 2 begins forming while the N 1–P 1 pair is released into the wake. This sequential formation leads to a well-defined 2P shedding mode, demonstrating strong fluid–structure coupling and extended vortex formation regions characteristic of high-energy oscillations.
However, as the excitation transitions to the low-amplitude phase (e.g. panels (c)–( f)), induced by the aforementioned phase slip and misalignment, the wake undergoes a qualitative transformation. The forced motion aggressively opposes the natural shedding rhythm, preventing the structural amplitude to a maximum. During this stage, the shear layers do not develop sufficient momentum or coherence to sustain full vortex pairing. The external forcing fragments the shear layers prematurely, causing the developing vortex P 2 to detach as an isolated structure, followed similarly by its counterpart N 2 without pairing. This leads to a weak and disorganised 2S shedding mode, reflecting a state where the energy input is insufficient to sustain the inertial and viscous processes needed for a full 2P configuration.
The alternation between 2P and 2S shedding thus corresponds directly to the periodic amplitude modulation seen in dual-frequency vibrations. During high-amplitude cycles, the wake recovers its full complexity, demonstrating strong fluid–structure coupling and extended vortex formation regions, while in low-amplitude phases, the wake simplifies, reverting to a more elementary shedding mode characteristic of low-energy oscillations. This cyclic behaviour is further corroborated in figure 13, where the schematic illustrates how the flow field reorganises synchronously with the cylinder motion, showcasing the time-resolved nature of the competing dynamics.
Sketch of the vortex street behind the cylinder for the dual-frequency response, following Figure 12. The red dashed line encircles the vortices shed in one complete modulation cycle.

The aforementioned behaviour indicates that the wake structure is not merely a consequence of cylinder motion, but a sensitive reflection of the nonlinear phase alignment and energy interplay between internal (self-excited) and external (forced) oscillatory drivers. Operating in a dynamically rich dual-frequency regime governed by the relentless interference of forced vibration, the system continuously alternates between constructive reinforcement and destructive interference. In response to these evolving momentum and pressure fields, the fluid adapts its vortex formation process, switching between highly organised (2P) and simplified (2S) modes. This mode transition coincides directly with the vortex phase slip, demonstrating that the nonlinear coupling of frequency and amplitude in the coupled VIV systems directly imprints onto the wake structure to control the onset, evolution and decay of shedding modes. Ultimately, the temporal and spatial complexity of this regime provides a unique window into the fundamental fluid–structure interaction mechanisms that dictate how energy is distributed, transferred and dissipated under competing excitation inputs.
3.4.3. Frequency-switching response
The frequency-switching response represents a transitional regime between forced vibration dominance and natural VIV, characterised by non-periodic alternation between two competing excitation frequencies. This regime reflects a state of intermediate coupling, where neither the external forcing nor the self-excited VIV mechanisms fully control the system, resulting in an evolving balance that dynamically shifts between them. The corresponding wake patterns are rich and temporally complex, featuring systematic transitions between high-energy and low-energy vortex shedding modes, tightly synchronised with the modulation of oscillation amplitude, as presented in figure 14 (
 $f^{*}$
= 1.25 and
 $A^{*}$
= 1.50).
The time history of the displacement (black) and direct force measurement (orange) (first row), the displacement (black) and reconstructed vortex force from PIV vorticity fields (purple) (second row), the total phase difference (orange) and calculated vortex phase difference (purple) (third row) as well as its corresponding time-averaged vorticity fields over a cycle of oscillation for the frequency-switching response (
 $f^{*}$
= 1.25 and
 $A^{*}$
= 1.50) at the reduced velocity
 $U_{\!r}$
= 4.37 with
 $m^{*}$
= 2.4.

Unlike the relatively organised beating envelope observed in the dual-frequency regime, the macroscopic responses in the frequency-switching regime, displacement (
 $y_{t}/D$
) and total hydrodynamic force (
 $C_{y}$
), exhibit highly irregular amplitude modulations. During intervals where the self-excited VIV reasserts control, the vibration shifts toward the natural shedding frequency
 $f_{\!s}$
, driving large-amplitude excursions. Conversely, when the external forced vibration temporarily dominates, the system aligns closer to the forcing frequency
 $f_{\!e}$
, actively suppressing the structural amplitude. This frequency ‘hopping’ behaviour, observed both in time-domain displacement signals and spectral analysis (figures 4 and 5), confirms that the wake serves as a direct physical indicator of the shifting dominance between the two excitation mechanisms.
The root cause of this macroscopic chaos is captured in the phase dynamics. The isolated vortex phase angle
 $\phi _{vor}$
demonstrates severe, continuous and jagged drifting (third row in figure 14). The relentless forced vibration constantly overpowers the self-excited mechanism’s attempt to synchronise, resulting in multiple, abrupt phase distortions within a modulation cycle
 $T^{*}$
. This erratic phase trajectory confirms that the forced excitation continuously shatters the fluid–structure coupling, leading to a highly chaotic, alternating direction of energy transfer.
Microscopically, this severe phase mismatch and frequency hopping actively fragment the stable synchronisation of the shear layers. As illustrated in figure 14, the wake adapts continuously to the evolving phase and amplitude relationship, compelling the flow to reorganise into an exceptionally complex, multi-mode shedding sequence.
During the large-amplitude segments driven by the self-excited frequency alignment, the boundary layers undergo massive excursions across the flow direction. A clockwise vortex N 1 forms on the suction side, while a counterclockwise vortex P 1 develops on the pressure side, forming a coherent N 1–P 1 pair. The elongated shear layers maintain coherence long enough to sustain multiple paired shedding events per modulation cycle (N 2–P 2, N 3–P 3), a hallmark of vigorous vortex interaction and sustained energy input.
Notably, at these extreme amplitudes, the intense forced kinematics trigger secondary instabilities in the near wake. For example, vortex P 3 undergoes premature fragmentation into smaller-scale structures before completing its pairing process. This indicates that local Reynolds number elevation and intense shearing, which caused by the brief constructive alignment of both excitation mechanisms, trigger short-wavelength instabilities.
As the system frequency hops toward
 $f_{\!e}$
and transitions into low-amplitude phases, the character of the wake changes markedly. The diminished cylinder displacement and the opposing high-frequency forced motion prematurely truncate the shear layer development. Consequently, the flow cannot sustain the momentum required for full 2P development. Vortices such as N
7 and P
7 shed individually, forcing the wake to revert to a lower-energy 2S configuration.
These mode transitions of vortex shedding are also summarised in figure 15, where the wake schematic illustrates how the system cyclically alternates between 2P and 2S vortex shedding in response to underlying oscillation amplitude modulation. Specifically, each full vibration period typically comprises multiple 2P shedding events during large-amplitude excursions (three distinct vortex pairs here) followed by simpler 2S shedding in the small-amplitude segments, typically producing two alternating vortices. This behaviour reflects an inherent energy modulation mechanism driven by the interplay of the two excitation sources.
Sketch of the vortex street behind the cylinder for the frequency-switching response, following Figure 14. The red dashed line encircles the vortices shed in one complete modulation cycle.

From a fluid–structure interaction perspective, the frequency-switching regime highlights how incomplete synchronisation leads to fierce nonlinear competition, rather than linear superposition, between the forced and self-excited drivers. The external forcing acts as a continuous disruptor that prevents phase locking, forcing the intrinsic wake to rapidly alternate between 2P and 2S modes to accommodate the chaotic phase misalignment. From an engineering perspective, this regime is particularly critical for safety assessments and fatigue loading predictions, as it combines the unpredictability of nonlinear phase drift with intermittent, highly destructive periods of strong vortex–body coupling and secondary wake instabilities.
3.4.4. Resonant response
The resonant response regime presents a qualitatively distinct and highly organised wake behaviour compared with the dual-frequency and frequency-switching responses. Marked by complete synchronisation between the forced vibration and the natural VIV, this regime represents the most energetically efficient state among all observed responses. By jointly analysing the macroscopic dynamics and the time-resolved PIV contours, the absolute dominance of the forced excitation over the intrinsic wake is explicitly revealed, as shown in figure 17 for the representative case
 $f^{*}$
= 1.10 and
 $A^{*}$
= 2.00 at the reduced velocity
 $U_{\!r}$
= 4.37 with
 $m^{*}$
= 2.4.
The macroscopic time histories instantly demonstrate the cessation of the mode competition that characterised the previous regimes. The pronounced amplitude modulations vanish completely, replaced by perfectly stable, constant-amplitude periodic oscillations in both the structural displacement and the hydrodynamic forcing.
The fundamental mechanism behind this stability lies in the phase dynamics. Throughout the oscillation cycle, the isolated vortex phase angle
 $\phi _{vor}$
neither drifts continuously nor slips abruptly; instead, it securely locks onto a constant value. Under these resonant conditions, the cylinder’s displacement, the timing of vortex shedding and the hydrodynamic forcing all evolve strictly in phase. This absolute phase locking arises from perfect constructive interference between the external forcing and the self-excited system, establishing an optimally efficient channel for fluid–structure energy transfer.
Microscopically, this strict temporal periodicity forces the wake into a highly organised spatial topology. Unlike the dual-frequency and frequency-switching regimes, where amplitude modulation introduces intermittent periods of weakened shedding and transitions into 2S modes, the resonant regime sustains robust and pure 2P vortex shedding throughout the entire cycle. The complete lack of 2S transitions underlines the robustness of this regime, as both energy input and vortex generation occur in a fully phase-locked fashion.
However, the extreme kinematics of the forced vibration significantly distort the spatial evolution of the near wake. As the cylinder traverses its massive oscillation trajectory, both the positive and negative shear layers undergo unprecedented elongation (figure 16). The forced motion physically drags the boundary layers far downstream, preventing them from rolling up compactly near the cylinder base. This shear layer elongation is a hallmark of maximum energy transfer efficiency, driven by the increased oscillation amplitude and near-perfect phase alignment between the two excitation sources.
The time history of the displacement (black) and direct force measurement (orange) (first row), the displacement (black) and reconstructed vortex force from PIV vorticity fields (purple) (second row), the total phase difference (orange) and calculated vortex phase difference (purple) (third row) as well as its corresponding time-averaged vorticity fields over a cycle of oscillation for the resonant response (
 $f^{*}$
= 1.10 and
 $A^{*}$
= 2.00) at the reduced velocity
 $U_{\!r}$
= 4.37 with
 $m^{*}$
= 2.4.

Sketch of the vortex street behind the cylinder for the resonant response, following Figure 16. The red dashed line encircles the vortices shed in one complete modulation cycle.

Vortex formation initiates at the extremities of these extended shear layers, where strong vorticity accumulates due to sustained boundary layer separation. The resulting large vortex cores (e.g. P 1 and N 2) are shed with exceptional coherence and intensity, indicating that the wake is fully entrained by the oscillatory motion. Notably, due to the massive amplitude of motion, these highly energetic vortices are uniquely prone to secondary instabilities. As they convect downstream, the vortices often undergo early-stage fragmentation or breakup. This phenomenon, rarely observed in the lower-energy 2S transitions of the other regimes, reflects the elevated local Reynolds numbers and the intense vortex–vortex interactions induced by the synchronised, high-amplitude excitation.
In summary, the resonant response showcases the optimal fluid–structure interaction state, where external and internal excitation sources work in unison to reinforce shear layer growth, synchronise vortex formation and maintain a strictly periodic wake structure. The forced excitation effectively enslaves the wake, eliminating phase mismatch. Compared with the chaotic mode switching in previous regimes, the resonant state demonstrates enhanced vortex coherence, intensified wake structures and distinct secondary vortex instabilities. These findings underscore the critical importance of excitation frequency and amplitude tuning in governing the nonlinear wake dynamics of elastically mounted bluff bodies, providing a powerful theoretical basis to modulate vortex topology and control energy exchange in engineered VIV systems.
4. Conclusion
This experimental investigation systematically examines how forced vibration modifies the VIV characteristics of an elastically mounted cylinder with low and high mass ratios, providing comprehensive insights into amplitude response, hydrodynamic coefficients, phase relationships and wake patterns. Through carefully controlled experiments spanning frequency ratios (
 $f^{*}$
) from 0.25 to 2.0 and amplitude ratios (
 $A^{*}$
) from 0.25 to 4.0 at various reduced velocities with low and high mass ratios 2.4 and 19.2, we identify and characterise three universal vibration regimes under forced excitation: dual frequency, frequency switching and resonant response. These regimes reflect fundamental interaction mechanisms between natural VIV and externally imposed oscillations.
The dual-frequency regime arises when forced and natural frequencies differ substantially, resulting in coexisting oscillations with weak coupling. It features modulated time histories alternating between large- and small-amplitude phases. Spectral analysis confirms persistent dual-frequency content, while wake patterns alternate between 2P and 2S shedding modes, synchronised with amplitude changes.
The frequency-switching regime, observed near resonance (
 $f^{*}$
≈ 1.0), exhibits amplitude-modulated beating and continuous frequency hopping between
 $f_{\!e}$
and
 $f_{\!s}$
, indicating competitive excitation. Wake patterns are dominated by 2P shedding in large-amplitude phases and brief 2S intervals during weaker oscillations. Phase transitions are smoother than in the dual-frequency regime, reflecting moderate coupling.
The resonant regime occurs when both frequency matching and sufficient forcing amplitude (
 $A^{*}$
> 2) are met. Forced and natural vibrations synchronise fully, producing sinusoidal motion with amplified amplitude at a single dominant frequency. The wake maintains pure 2P shedding, and phase locking confirms optimal energy transfer.
Amplitude response analysis shows the frequency ratio as the dominant parameter, with resonance producing peak amplitudes. The forced component follows a V-shaped trend with frequency ratio, while global and self-excited components increase near resonance. The amplitude ratio enhances the global and self-excited responses broadly, but affects the forced component mainly near resonance.
Crucially, this study also highlights that the structural mass ratio fundamentally governs the boundaries and transient dynamics of these regimes. The massive cylinder abruptly compresses or even entirely eliminates the transitional frequency-switching zone at high amplitude ratios, completely ‘enslaving’ the relatively weak self-excited wake and leading to sharper state transitions compared with lighter structures.
Energy transfer coefficients (
 $C_{lv}$
) remain negative throughout, confirming fluid-induced damping, which intensifies near resonance. The added mass coefficient (
 $C_{\textit{my}}$
) shows complex dependence, including a trough near resonance and varying trends with amplitude ratio. Notably, the self-excitation component transitions from negative to positive at
 $f^{*}$
≈ 0.5, with continuous growth as frequency increases. Forced and self-excited components interact nonlinearly, producing global effects not predictable by linear superposition.
It is worth noting that the most significant contribution of this work lies in the establishment of a systematic regime classification framework. While complex multi-frequency patterns have been sporadically reported as transient or intermediate states in prior active VIV control literature (e.g. Nakano & Rockwell Reference Nakano and Rockwell1993; Khalak & Williamson Reference Khalak and Williamson1999; Carberry et al. Reference Carberry, Sheridan and Rockwell2005), a systematic understanding has remained elusive, as previous studies primarily focused on suppression efficiency. As summarised in the regime classification map (figures 10 and 29), we have definitively delineated the boundaries of the dual-frequency, frequency-switching and resonant regimes in the frequency–amplitude domain, while factoring in the topological shifts induced by structural inertia. This framework not only explains the scattered observations in prior control studies but also offers robust predictive capabilities for the dynamic behaviour of coupled systems under dual excitations.
Overall, forced vibration enables precise control over VIV behaviour through tuneable frequency and amplitude inputs. The identified regimes are consistent across flow conditions, suggesting fundamental fluid–structure interaction mechanisms. These findings offer a useful framework for VIV prediction and control in applications such as flow control, energy harvesting and offshore structure design, and deepen our understanding of nonlinear forced–natural vibration coupling.
Supplementary materials
Supplementary material are available at https://doi.org/10.1017/jfm.2026.11533.
Acknowledgement
The authors would like to express their sincere gratitude to Mr Lugang Ye for his valuable assistance and technical support during the experimental phase of this study. Special thanks are also extended to Mr Dehan Yuan for his insightful contributions to the theoretical analysis and reconstruction of the vortex-induced forces based on the PIV flow field measurements.
Funding
The authors gratefully acknowledge financial support from the National Natural Science Foundation of China (grant nos. 52394254, 12132018 and 12202455).
Declaration of interests
The authors report no conflicts of interest.
Appendix A. Decomposition of cylinder vibration signals
To investigate the competition between the forced excitation and self-excited mechanisms, the total cross-flow vibration displacement
 $y(t)$
was decomposed into two independent components based on their spectral characteristics. The decomposition process follows a frequency-domain filtering approach, consisting of the following steps.
The time history of the cylinder vibration,
 $y(t)$
, was first transformed into the frequency domain using FFT
 \begin{equation} Y(f)=\mathcal{F}\left[y(t)\right]\!. \end{equation}
As shown in figures 4 and 5, the spectrum exhibits distinct peaks corresponding to the two vibration regimes: (a) a component centred around the structural natural frequency (
 $f_{\!s}$
), representing the self-excited vibration; (b) a component centred around the external excitation frequency (
 $f_{\!e}$
), representing the forced excitation.
Two non-overlapping band-pass filters were constructed to isolate these components. Let
 $f_{c1}$
and
 $f_{c2}$
be the cutoff frequencies separating the two regimes. The self-excited component
 $Y_{\textit{self}}(f)$
is extracted by retaining frequencies within the band
 $[f_{\!s}-\Delta f,f_{\!s}+\Delta f]$
. The forced component
 $Y_{\textit{forced}}(f)$
is extracted by retaining frequencies within the band
 $[f_{\!e}-\Delta f,f_{\!e}+\Delta f]$
, where
 ${\unicode[Arial]{x0394}} f$
is the bandwidth half-width selected to capture the energy of the respective peak without interference from adjacent modes.
The time-domain signals for the self-excited component,
 $y_{\textit{self}}(t)$
, and the forced component,
 $y_{\textit{forced}}(t)$
, were reconstructed using the inverse FFT
 \begin{equation} y_{\textit{self}}(t)=\mathcal{F}^{-1}\left[Y_{\textit{self}}(f)\right]\! , \end{equation}
 \begin{equation} y_{\textit{forced}}(t)=\mathcal{F}^{-1}\left[Y_{\textit{forced}}(f)\right]\!. \end{equation}
Based on the above approach, the forced and self-excited components can be extracted from the global response.
Appendix B. Theoretical analysis of wake-induced forces
While a reduced-order model of dual excitation offers a simplified phenomenological view of the competition mechanism, the complex phase coupling between the self-excited force and structural motion necessitates a deeper look into the hydrodynamic origins of the forces. To this end, a rigorous theoretical analysis based on vortex impulse theory was conducted to explicitly link the transient wake dynamics (e.g. the alternating 2P and 2S shedding modes) to the structural response of the oscillating cylinder.
For any piecewise differentiable vector field
 $\boldsymbol{g}$
and scalar field
 $\xi$
defined on an
 $n$
-dimensional Euclidean space (where
 $n$
= 2 for the two-dimensional cylinder cross-section analysis, yielding
 $k = n$
-1 = 1), the following general vector integral identities hold:
 \begin{equation}\int _{V}\boldsymbol{g}{d}V=\frac{1}{k}\int _{V}\boldsymbol{x}\times \left(\boldsymbol{\nabla }\times \boldsymbol{g}\right)\!{d}V-\frac{1}{k}\int _{\partial V}\boldsymbol{x}\times \left(\boldsymbol{n}\times \boldsymbol{g}\right)\!{d}S,\end{equation}
 \begin{equation}\int _{S}\xi \boldsymbol{n}{d}S=-\frac{1}{k}\int _{S}\boldsymbol{x}\times \left(\boldsymbol{n}\times \boldsymbol{\nabla }\xi \right){d}S.\end{equation}
By Newton’s third law, the total hydrodynamic force
 $\boldsymbol{F}$
exerted on the oscillating cylinder by the fluid is determined by integrating the pressure and viscous stresses over the cylinder surface
 $\partial B$
 \begin{equation}\boldsymbol{F}=-\int _{\partial B}\left(-p\boldsymbol{n}+\boldsymbol{\tau }\right){d}S,\end{equation}
where
 $p$
is the pressure,
 $\boldsymbol{\tau }=\mu (\boldsymbol{\omega }\times \boldsymbol{n})$
represents the viscous shear stress,
 ${\unicode{x03BC}}$
is the dynamic viscosity and
 $\boldsymbol{n}$
is the outward normal vector on the cylinder surface.
To relate this surface integral to the measurable flow field (such as the PIV domain), (B3) can be rewritten by integrating the local momentum balance over a generic fluid control volume
 $V_{\!f}$
 \begin{equation}\boldsymbol{F}=-\int _{{V_{\!f}}}\rho \boldsymbol{a}{d}V+\int _{\sum }\left(-p\boldsymbol{n}+\boldsymbol{\tau }\right){d}S.\end{equation}
Here,
 $a=Du/Dt$
is the fluid acceleration, u is the velocity vector,
 $\rho$
is the fluid density and
 $\sum$
represents the outer boundary of the control volume (e.g. the boundaries of the PIV measurement window). By applying the identity from (B1), (B4) becomes
 \begin{equation}\boldsymbol{F}=-\frac{\rho }{k}\int _{{V_{\!f}}}\boldsymbol{x}\times \left(\boldsymbol{\nabla }\times \boldsymbol{a}\right){d}V+\frac{\rho }{k}\int _{\partial {V_{\!f}}}\boldsymbol{x}\times \left(\boldsymbol{a}\times \boldsymbol{n}\right){d}S+\int _{\sum }\left(-p\boldsymbol{n}+\boldsymbol{\tau }\right){d}S.\end{equation}
Recognising that the curl of acceleration is related to the vorticity
 $\boldsymbol{\omega }=\boldsymbol{\nabla }\times \boldsymbol{u}$
by the kinematic relation
 $\boldsymbol{\nabla }\times \boldsymbol{a}=\boldsymbol{\nabla }\times ({Du}/{Dt})=\boldsymbol{\omega }_{,t}+\boldsymbol{\nabla }\times (\boldsymbol{\omega }\times \boldsymbol{u})$
(where
 $\boldsymbol{\omega }_{,t}= ({\partial \omega }/{\partial t})$
), and noting that the total boundary of the fluid domain is
 $\partial V_{\!f}=\partial B\cup \sum$
, the force equation is expanded as
 \begin{equation}\boldsymbol{F}=\rho \int _{{V_{\!f}}}\boldsymbol{u}\times \boldsymbol{\omega }{d}V+\frac{\rho }{k}\int _{\sum }\boldsymbol{x}\times [\boldsymbol{n}\times (\boldsymbol{u}\times \boldsymbol{\omega })]{d}S-\frac{\rho }{k}\int _{{V_{\!f}}}\boldsymbol{x}\times \boldsymbol{\omega }_{,t}{d}V+\frac{\rho }{k}\int _{\partial B}\boldsymbol{x}\times (\boldsymbol{n}\times \boldsymbol{a}){d}S.\end{equation}
Finally, by utilising the Navier–Stokes equations and the integral identities ((B1) and (B2)) to eliminate the pressure term on the outer boundary, the total hydrodynamic force acting on the vibrating cylinder is elegantly decomposed into distinct physical components
 \begin{equation}\boldsymbol{F}=\rho \int _{{V_{\!f}}}\boldsymbol{u}\times \boldsymbol{\omega }{d}V-\frac{\rho }{k}\int _{{V_{\!f}}}\boldsymbol{x}\times \boldsymbol{\omega }_{,t}{d}V+\boldsymbol{F}_{\!B}+\boldsymbol{F}_{\sum },\end{equation}
where the boundary components are
 \begin{equation} \boldsymbol{F}_{\!B}=\frac{\rho }{k}\int _{\partial B}\boldsymbol{x}\times \left(\boldsymbol{n}\times \boldsymbol{a}_{\boldsymbol{s}}\right){d}S, \end{equation}
 \begin{equation} \boldsymbol{F}_{\sum }=\int _{\sum }\boldsymbol{\tau }dS-\frac{\mu }{k}\int _{\sum }\boldsymbol{x}\times \left[\boldsymbol{n}\times \left(\boldsymbol{\nabla }\times \boldsymbol{\omega }\right)\right]{d}S+\frac{\rho }{k}\int _{\sum }\boldsymbol{x}\times \left[\boldsymbol{n}\times \left(\boldsymbol{u}\times \boldsymbol{\omega }\right)\right]{d}S. \end{equation}
The first two volume integrals in (B7) explicitly define the true vortex-induced force. The term involving
 $\boldsymbol{\omega }_{,t}$
captures the dynamic, localised generation and shedding of shear layers (e.g. the formation of 2P or 2S structures near the cylinder), while the Lamb vector integral (
 $\boldsymbol{u}\times \boldsymbol{\omega }$
) accounts for the downstream convection of these vortical structures.
Appendix C. Response of the cylinder undergoing forced excitations at the reduced velocity
 $\boldsymbol{U}_{\boldsymbol{r}}$
= 6.56 with
$\boldsymbol{m}^{\boldsymbol{*}}$
= 2.4 and
$\boldsymbol{U}_{\boldsymbol{r}}$
= 6.14 with
$\boldsymbol{m}^{\boldsymbol{*}}$
= 19.2


To elucidate the complex response of a cylinder undergoing forced excitations, this appendix presents detailed experimental results across four representative VIV regimes: dual frequency, frequency switching, resonant response and self-excited VIV at the reduced velocity
 $U_{\!r}$
= 6.56 with
 $m^{*}$
= 2.4 and
 $U_{\!r}$
= 6.14 with
 $m^{*}$
= 19.2 respectively.
Parameters of the selected presented cases.

Schematic of a cylinder body of volume
 $B$
moving arbitrarily in a viscous fluid. The body surface is
 $\partial B$
, and the analysis flow field
 $V_{\!f}$
is bounded internally by
 $\partial B$
and externally by a boundary
 $\sum$
. The unit normal vector
 $\boldsymbol{n}$
is directed outward from
 $V_{\!f}$
.

The dynamics of (a) self-excitation response as well as (b) dual frequency (
 $f^{*}$
= 0.60 and
 $A^{*}$
= 2.00); (c) frequency switching (
 $f^{*}$
= 1.20 and
 $A^{*}$
= 1.50) and (d) resonant response (
 $f^{*}$
= 1.10 and
 $A^{*}$
= 2.50) induced by the couple effect of forced vibration and self-excitation responses: (i) time traces; (ii) normalised power spectra and (iii) time-varying frequency components at the reduced velocity
 $U_{\!r}$
= 6.56 with mass ratio
 $m^{*}$
= 2.4.

The dynamics of (a) self-excitation response as well as (b) dual frequency (
 $f^{*}$
= 0.60 and
 $A^{*}$
= 2.00); (c) frequency switching (
 $f^{*}$
= 1.10 and
 $A^{*}$
= 0.25) and (d) resonant response (
 $f^{*}$
= 1.10 and
 $A^{*}$
= 2.00) induced by the couple effect of forced vibration and self-excitation responses: (i) time traces; (ii) normalised power spectra and (iii) time-varying frequency components at the reduced velocity
 $U_{\!r}$
= 6.14 with mass ratio
 $m^{*}$
= 19.2.

The total phase differences between motion and flow force of (a,b) self-excitation response as well as (c,d) dual frequency (
 $f^{*}$
= 0.50 and
 $A^{*}$
= 2.50,
 $f^{*}$
= 0.60 and
 $A^{*}$
= 2.00); (e, f) frequency switching (
 $f^{*}$
= 1.20 and
 $A^{*}$
= 1.50,
 $f^{*}$
= 0.80 and
 $A^{*}$
= 1.50) and (g,h) resonant response (
 $f^{*}$
= 1.10 and
 $A^{*}$
= 2.50,
 $f^{*}$
= 1.10 and
 $A^{*}$
= 2.00) at the reduced velocities
 $U_{\!r}$
= 6.56 with
 $m^{*}$
= 2.4 (a,c,e,g) and
 $U_{\!r}$
= 6.14 with
 $m^{*}$
= 19.2 (b,d, f,h).

Contours of (a,d) global amplitude and amplitude components corresponding to (b,e) forced vibration and (c, f) self-excitation respectively of the cylinder across different frequency ratios
 $f^{*}$
and amplitude ratios
 $A^{*}$
at the reduced velocities
 $U_{\!r}$
= 6.56 with
 $m^{*}$
= 2.4 (a,b,c) and
 $U_{\!r}$
= 6.14 with
 $m^{*}$
= 19.2 (d,e, f).

Contours of (a,d) global excited coefficient and the excited coefficient components corresponding to (b,e) forced vibration and (c, f) self-excitation respectively of the cylinder across different frequency ratios
 $f^{*}$
and amplitude ratios
 $A^{*}$
at the reduced velocities
 $U_{\!r}$
= 6.56 with
 $m^{*}$
= 2.4 (a,b,c) and
 $U_{\!r}$
= 6.14 with
 $m^{*}$
= 19.2 (d,e, f).

Contours of (a,d) global added mass coefficient and the added mass coefficient components corresponding to (b,e) forced vibration and (c, f) self-excitation respectively of the cylinder across different frequency ratios
 $f^{*}$
and amplitude ratios
 $A^{*}$
at the reduced velocities
 $U_{\!r}$
= 6.56 with
 $m^{*}$
= 2.4 (a,b,c) and
 $U_{\!r}$
= 6.14 with
 $m^{*}$
= 19.2 (d,e, f).

The time history of the displacement (black) and direct force measurement (orange) (first row), the displacement (black) and reconstructed vortex force from PIV vorticity fields (purple) (second row), the total phase difference (orange) and calculated vortex phase difference (purple) (third row) as well as its corresponding time-averaged vorticity fields over a cycle of oscillation for self-excitation response at the reduced velocity
 $U_{\!r}$
= 6.56 with
 $m^{*}$
= 2.4.

The time history of the displacement (black) and direct force measurement (orange) (first row), the displacement (black) and reconstructed vortex force from PIV vorticity fields (purple) (second row), the total phase difference (orange) and calculated vortex phase difference (purple) (third row) as well as its corresponding time-averaged vorticity fields over a cycle of oscillation for the dual-frequency response (
 $f^{*}$
= 0.50 and
 $A^{*}$
= 2.50) at the reduced velocity
 $U_{\!r}$
= 6.56 with
 $m^{*}$
= 2.4.

The time history of the displacement (black) and direct force measurement (orange) (first row), the displacement (black) and reconstructed vortex force from PIV vorticity fields (purple) (second row), the total phase difference (orange) and calculated vortex phase difference (purple) (third row) as well as its corresponding time-averaged vorticity fields over a cycle of oscillation for the frequency-switching response (
 $f^{*}$
= 1.20 and
 $A^{*}$
= 1.50) at the reduced velocity
 $U_{\!r}$
= 6.56 with
 $m^{*}$
= 2.4.

The time history of the displacement (black) and direct force measurement (orange) (first row), the displacement (black) and reconstructed vortex force from PIV vorticity fields (purple) (second row), the total phase difference (orange) and calculated vortex phase difference (purple) (third row) as well as its corresponding time-averaged vorticity fields over a cycle of oscillation for the resonant response (
 $f^{*}$
= 1.10 and
 $A^{*}$
= 2.50) at the reduced velocity
 $U_{\!r}$
= 6.56 with
 $m^{*}$
= 2.4.

Response regimes across different frequency ratios and amplitude ratios at various reduced velocities
 $U_{\!r}$
= (a) 3.50, (b) 3.93, (c) 4.81, (d) 5.25 with
 $m^{*}$
= 2.4 and
 $U_{\!r}$
= (e) 5.41, ( f) 6.88 with
 $m^{*}$
= 19.2. Green triangles: dual-frequency response; blue circles: frequency-switching response; red squares: resonant response.

A comparison between figures 19 and 20 confirms that these three response regimes are universally presented regardless of the mass ratio. Furthermore, comprehensive experimental studies detailed in this appendix confirm that the overarching variation trends of the structural response amplitude, total phase angles, excitation force coefficients and added mass coefficients across other operating conditions are fundamentally consistent with the representative cases highlighted in the main text. The extensive supplementary data rigorously corroborate that the underlying physical mechanisms governing the fluid–structure energy transfer, mode competition and transition boundaries remain highly robust and universally applicable across the broader parameter space.
Specifically, the experiments reveal that self-excited VIV at
 $U_{\!r}$
= 6.56 exhibits periodic cylinder motion with stable amplitude, generating classical 2P vortex shedding, similar to the behaviours observed at
 $U_{\!r}$
= 4.37 with
 $m^{*}$
= 2.4. In the dual-frequency response, the wake structure alternates between 2P and 2S vortex shedding patterns, with 2P dominating during large-amplitude oscillations and 2S emerging during low-amplitude phases. The frequency-switching regime demonstrates a more complex dynamics, where multiple 2P and 2S shedding cycles occur within a modulation oscillation period, modulated by the cylinder’s amplitude variations. The resonant response exhibits exclusive 2P vortex shedding, accompanied by two distinctive phenomena: unprecedented elongation of the shear layer and rapid vortex disintegration.
These findings validate the proposed classification framework for VIV responses under different forced excitations, demonstrating its applicability across fundamental vibration modes. These observed regime-dependent vortex patterns and transition behaviours can contribute to a deeper understanding of VIV mechanisms in practical engineering scenarios.
Appendix D. Comprehensive regime classification maps under extended operating conditions
To further validate the universality of the fluid-structure interaction mechanisms discussed in the main text, figure 29 presents the regime transition maps for additional reduced velocities. Panels (a) to (d) correspond to the low mass ratio configuration (
 $m^{*}$
= 2.4), whereas panels (e) and ( f) depict the high mass ratio configuration (
 $m^{*}$
= 19.2).
Crucially, the overarching topological distributions and transition boundaries across all these extended cases are fundamentally consistent with the representative findings presented in the main text. The dual-frequency regime consistently dominates the highly detuned regions, while the fully synchronised resonant response occupies the central V-shaped core near
 $f^{*}\approx$
1.0. Furthermore, this broader dataset rigorously corroborates the secondary modulating effect of structural inertia: in the high mass ratio cases (panels (e) and ( f)), the transitional frequency-switching zone (blue circles) is markedly compressed or completely vanishes at higher amplitude ratios (
 $A^{*}$
> 2.0). This confirms that the massive structural momentum universally enslaves the wake, leading to sharper state transitions regardless of the specific reduced velocity.