


Introduction
Hydropower is an attractive alternative energy source in Greenland, and feasibility studies have been carried out since the 1970s. The early investigations were limited, however, by the difficulty of carrying out field operations on the Greenland ice sheet and focused on the smaller basins in the immediate vicinity of towns. Discharge measurements were initiated at a few large basins adjoining the Greenland ice sheet, but only recently with global positioning system and remote-sensing technology has it become possible to study the meltwater contribution from the ice sheet. It is desirable to develop a method for determining the ice-sheet melt-water contribution and its variability, as it forms the bulk of the water flux in the largest basins in West Greenland.
The aim of the present study is to investigate the impact of surface and bedrock elevation models on the assessment of meltwater output from the ice sheet. Evaluation of the error in calculating the ice-sheet run-off arising from using standard digital elevation models (DEMs) of surface and bedrock instead of using high-resolution data was facilitated by a detailed survey of the ice-sheet segment draining into the Tasersiaq lake, West Greenland (66°13’N, 50°30’ W). The Tasersiaq basin is the largest basin in West Greenland in terms of hydropower potential (Reference Weidick and OlesenWeidick and Olesen, 1978), with a discharge of 19.5±9.0×10⁸ m3 a–1 measured by the Greenland Survey since 1975. The long time series provides an opportunity to test the validity of the basin delineations by comparing modelled to measured discharge. Two sets of elevation and bedrock models are used as input to a model delineating the hydrological basin on the ice sheet. The amount of meltwater from these ice-sheet basins is then estimated by means of anenergy-balance model and compared to the measurements of discharge carried out by the Greenland Survey.
Elevation Models
Basin delineation requires knowledge of the ice-surface and bedrock elevations. Two sets of ice-sheet surface and bedrock DEMs were tested covering the area shown in Figure 1.
Five basin delineations are shown: A. (lined shading) Delineation from water-pressure potential calculated from InSAR DEMand radio-echo sounding with k = 0.7. B. (full line) Surface drainage from InSAR DEMalone. C. (dashed shading) Delineation from WPP calculated from standard surface and bedrock DEMs with k = 0.7. D. (dashed line) Surface drainage from standard surface DEM alone. E. (dash-dotted line) Delineation from WPP calculated from InSAR DEMand radio-echo sounding with k = 0.85. The extent of the radio-echo sounding data is shown with dotted shading, and the extent of the InSAR DEM (left side) is outlined. The insert shows the location in West Greenland as a black quadrant.

The first set consists of the 1km resolution ice-sheet DEM of Reference EkholmEkholm (1996) and the 5 km resolution bedrock DEM of Reference Bamber, Layberry and GogineniBamber and others (in press).
The second set consists of a bedrock elevation model acquired with an airborne 60 MHz ice-radar system on a Twin Otter aircraft described in Reference Christensen, Reeh, Forsberg, Jörgensen, Skou and WoeldersChristensen and others (2000), and a DEM derived from repeat-track synthetic aperture radar interferometry (InSAR) and resampled to a grid resolution of 330 m. The ice-radar measurements were collected from flight tracks approximately 2.5 km apart to resolve the highly undulating bedrock.
The DEM was generated from two descending-orbit European Remote-sensing Satellite-1 and -2 (ERS-1/-2) tandem mode image pairs. The ERS-1 images were acquired on 20 October and 29 December 1995, respectively. Baselines of the pairs were –68 and 122 m. The raw data of frames 2259 and 2277 were merged to a 200 km strip before SAR focusing.
The processing system used is outlined in Reference Mohr, Madsen and ReehMohr and others (1997). It takes advantage of the high stability of the ERS radar system which allows us to establish a relation between the three-dimensional Earth surface and the two-dimensional radar coordinates. The dead-reckoning approach described in Reference Mohr and MadsenMohr and Madsen (2001) was used, having an accuracy of 10m horizontally on ground. Thus, the SAR image coordinates of ground-control points (GCPs) can be calculated so that they need not to be identified in the images.
First, the baseline of each interferogram was calibrated using GCPs. A four-parameter model, including offsets and linear trends of the baseline length in two dimensions, was used. The more than 100 GCPs, i.e. corresponding values of latitude, longitude and heights, provided by the Danish National Survey and Cadastre, were iteratively reduced to 86. GCPs on and near ice bodies, GCPs near steep slopes, and GCPs with large elevation residuals after phase inversion were removed. It is noted that with this approach, only GCPs in the western half of the image were used, since the eastern half consists entirely of ice.
Second, a straightforward double-differencing approach was used to extract elevations in the entire image. This requires the velocities during the two observation periods in October and December to be equal. With the present temporal and spatial baselines and using results from Reference Mohr, Madsen and SteinMohr and Madsen (1999), it is found that a 1ma–1 change of the horizontal ice velocity in a direction perpendicular to the satellite track causes an error in the elevation of 2 m. A velocity change parallel to the satellite track does not change the derived elevation. Here, the dominant flow direction on the ice sheet is perpendicular to the satellite track, but since winter data are used, it is assumed that the error caused by non-stationary flow is small compared to those caused by atmospheric distortions.
Atmospheric distortions, ionospheric as well as tropospheric, cause interferometric phase distortions both directly and indirectly through the baseline calibration. Changes in the snow/ice characteristics and a differential snow layer caused by a storm during the 1day periods between tandem acquisitions add to the error. Also, interferometric decorrelation adds noise. A full error analysis is outside the scope of this paper. However, it is our experience that atmospheric distortions dominate the error budget.
With the present baselines, a 0.5 cm rms path-length change, i.e. 1rad, in each interferogram gives a combined 10 m rms elevation error (see Reference Mohr, Madsen and SteinMohr and Madsen, 1999). On top of that, an elevationbias of similar magnitude is expected over the ice sheet since it is outside the area covered by GCPs.
This error estimate is consistent with a preliminary comparison of the InSAR DEM with a DEM based on laser-altimeter data acquired along the radar sounding flight tracks. Over the ice sheet the mean difference between the two DEMs is 5 m, and the rms of the difference is 10 m.
The high-resolution models (shown in Fig. 1) do not cover the entire study area and were therefore embedded in the standard DEMs of S. Ekholm andJ. L. Bamber, respectively. The grids were seamed by linear interpolation, and the standard parts resampled to the higher resolution of the new data (330 m).
Basin Delineation
Delineation of hydrological ice-sheet drainage basins is complicated because the watershed is not simply defined by the surface drainage, but must include a formulation of the englacial water routing as shown by Reference ShreveShreve (1972). This formulation is simplified by the assumption of Reference BjörnssonBjörnsson (1982) that all meltwater reaches the bedrock through moulins and crevasses and drains along the base of the ice sheet, which is assumed to be impermeable. This is a reasonable assumption for large-scale flow in regions with basal ice at the pressure-melting point and has been applied by Reference Thomsen, Thorning and BraithwaiteThomsen and others (1988) and Reference Hagen, Etzelmüller and NuttallHagen and others (2000). The simplified model implies that the direction of the water flow at the base of the glacier is determined by a water-pressure potential ϕb given by

where ρw and ρi are the densities of water and ice, respectively, Zb is the bedrock elevation, Zs is the elevation of the ice-sheet surface and g is the gravitational acceleration. The last term in the equation is the subglacial water pressure which is proportional to the pressure of the overlying ice with the factor k, ranging from k = 0 corresponding to atmospheric pressure in subglacial channels to k = 1 for the situation where the subglacial water pressure equals the overburden pressure exerted by the ice. The water at the base of the glacier will flow in the direction of the maximum gradient of the water-pressure potential. Basin delineation and a drainage pattern was then calculated from the potential surface by the hydrological software package River Tools©.
Ablation Modelling
To estimate the total run-off from the delineated basins, a model taking into account the distribution of meltwater production is necessary. For this purpose a distributed energy-balance model was developed and calibrated with field measurements from sites shown in Figure 2. The aim is a mean value of the ablation over the year.
The positions of the field measurements of ablation used to calibrate the ablation from the energy-balance model as shown in Figure 3. The sites ending with K are climate stations, whereas sites ending with S are stakes. Contours show modelled water-equivalent ablation in cm a–1.The delineation of basin A from Figure 1 is shown for reference.

The energy-balance equation reads

where QM is the energy flux available for melt, QN is the net radiation, QH is the sensible-heat flux, QL is the latent-heat flux and QG is the change of heat of the thermally active part of the ice/snow surface. The energy supplied by rain is negligible in the area considered and is not included. The melt rate M can subsequently be calculated from

where ρw is the density of water and Lf is the latent heat of fusion. The terms in Equation (2) were modelled on a daily basis as outlined in the following.
The net radiation is the difference between the absorbed and emitted energies of the surface and is divided into a shortwave part from the Sun and a longwave part mainly of terrestrial origin, expressed as

where S↓ is the incoming shortwave radiation and L↓ is the incoming longwave radiation from the sky, both calculated with parameterizations from Reference Konzelmann, de Wal, Greuell, Bintanja, Henneken and Abe-OuchiKonzelmann and others (1994), L↑ is the longwave radiation emitted by the surface in accordance with the Stefan–Boltzmann law and α is the albedo which determines how much of the incoming shortwave radiation is absorbed.
The albedo parameterization is adapted from Reference OerlemansOerlemans (1991) and takes the form

where αsnow = 0.75 is the albedo of fresh snow (over a day), αbg is the background albedo of the underlying ice or firn given as

where ELA =400m is the equilibrium-line altitude and a1 = 0.16, a2 = 450m, a3 = 200m and a4 =-0.56 are constants determined in the present by fitting the resulting ablation from the energy-balance model to the observed ablation, and the term dsnow is the snow depth, which is assumed to vary as a sawtooth function, in which a precipitation event deposits 0.24m of snow every 25 days which then melts away linearly to disappear in time for the next precipitation event. Finally the albedo is assumed to be that of snow until the surface temperature reaches the melting point, implying that the winter snow survives until then.
The turbulent sensible- and latent-heat fluxes, QH and QL, are calculated with the bulk method, employing Monin–Obukhov similarity theory. The roughness length for momentum was set to 1.0 mm following Reference Denby and SnellenDenby and Snellen (in press), whereas the roughness lengths for heat and water vapour were calculated from surface renewal theory for rough surfaces as described by Reference AndreasAndreas (1987). The stability corrections were both set to 5 following Reference MunroMunro (1989) and Reference Denby and SnellenDenby and Snellen (in press). Solutions were obtained by iteration due to the mutual dependency of the sensible-heat flux and the Obukhov length.
The final term in Equation (2), QG, deals with the cold content stored in the ice-sheet surface from the low winter temperatures. To account for this storage, the thermally active layer in terms of heat capacity is assumed to correspond to a 2 m thick layer of solid ice as suggested by Reference OerlemansOerlemans (1992). The surface temperature change is calculated on a daily basis by adding the modelled energy flux integrated over the day. The integrated energy is only converted to melt when the surface temperature has reached the melting point, at which point all the meltwater produced is assumed to run off the ice sheet. Due to the feedback of the surface temperature with the other terms in the energy-balance calculation, an iterative approach is necessary.
Preliminary data from the Imersuaq climate stations marked in Figure 2 are used in the modelling, such as a mean value of relative humidity of 0.752 and a mean wind speed of 3.87 ms–1.
The air temperature over the year is modelled as

where Tmean = 270.16 K is the average temperature at sea level, Tamp = 12 K is the seasonal temperature amplitude, day is the day of the year, and γ = 0.007 – 0.002 sin [(2π (day) – 90)/365] is the lapse rate, calibrated with data from Reference Steffen and BoxSteffen and Box (in press) and preliminary data from the Imersuaq project.
The dependency of the atmospheric pressure P(z) on altitude z is deduced from the Greenland Climate Network (GC-Net) automatic weather stations (personal communication from J. Box, 2001) and takes the form P(z) = az + b, where a = –0.10045 h Pam–1 and b = 986.29 hPa.
The energy-balance model was calibrated only through the parameters of the albedo parameterization. Acomparison of modelled andmeasured ablation is shown in Figure 3.
The modelled ablation as a function of elevation, with ablation measurements from ablation season 2000. Positions are shown in Figure 2 .The accumulation is adapted from a compilation by Reference Ohmura, Calanca, Wild and AnklinOhmura and others (1999).

The modelled ablation does not capture the high melt measured at the two highest points on the transects. Inspection of a Landsat-7 Enhanced Thematic Mapper Plus (ETM+) image of the area reveals a dark band of low albedo at this altitude which is not reproduced by the albedo parameterization of the energy-balance model. Thismay cause an underestimation of the calculated run-off. Albedo derived from U.S. National Oceanic and Atmospheric Administration (NOAA) Advanced Very High Resolution Radiometer (AVHRR) images will be used in a future study to produce a more reliable ablation history.
Results
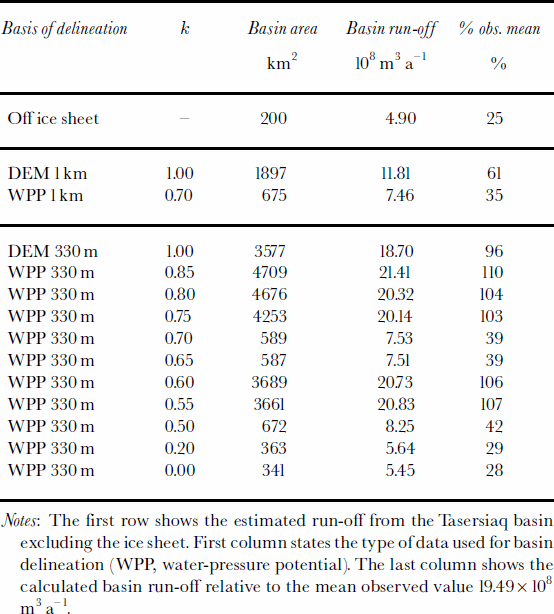
Basin delineations were calculated from a number of input data configurations as listed in Table 1. A selection of these is shown in Figure 1, revealing large variations in basin area (and thus run-off) depending on the quality of the elevation models and the choice of the k-factor.
Modelled basin run-off for different configurations of input data
Impact of elevation model quality
Basins delineated from the standard 1km DEM alone (basin D in Fig. 1) and from the water-pressure potential of the standard 1km DEM and resampled 5 km bedrock DEM with k = 0.7 (basin C in Fig. 1) differ significantly from the basins delineated with high-resolution data. Notably, basin C drains a completely different sector than its high-resolution counterpart, basin A in Figure 1. This is not solely because of the difference in resolution, but also because the data on which the standard DEMs are based is very sparse in the region studied. The basin delineations A, B and E based on high-resolution data all show a strong dependency on the bedrock features (in B’s case indirectly) at the northern limit, which is dominated by the valley occupied by the Tasersiaq lake complex continuing underneath the ice sheet.
Dependency on the k-factor
Another striking feature is the strong dependency of the basin area on the k-factor, illustrated in Table 1 and basins A, B and E in Figure 1. Low values of k up to 0.5 emphasizing the influence of the bedrock topography yield small basins, as would be expected due to the increased isostatic depression by the thickening ice sheet towards the east. The basin size increases rapidly by a factor of 5 for k values of 0.55–0.6, more than doubling the modelled run-off, but drops down to the previous extent for k values of 0.65–0.7 (basin A in Fig. 1), only to rise again for k ≥ 0.75 (e.g. basin E with k = 0.85 in Fig. 1). Water-pressure measurements from boreholes connected with the subglacial drainage system within 10 km of the ice margin in the Pâkitsoq area (69°30’ N, 50°W) suggested a k-factor of 1.05–0.79, decreasing with increasing ice thickness (Reference Thomsen and OlesenThomsen and Olesen, 1991).
Discussion And Conclusions
Inspection of Equation (1) shows that the influence of ice-sheet thickness on the water-pressure potential is linearly dependent on the k-factor, whereas the influence of the bedrock topography remains constant. This gradual increase of the pressure gradient driving the flow over the bedrock at the base of the ice sheet from the interior towards the margin causes a changing configuration of the internal river network of the ice sheet and thus a varying drainage area. The complicated dependency of basin size on the k-factor can therefore be interpreted as a result of the highly irregular bedrock topography and ice-sheet surface revealed in the high-resolution data.
Unfortunately, the upper part of the large basin (corresponding roughly to basin E without the part covered by basin A in Figure 1) is drained just outside the lower western corner of the area covered by high-resolution bedrock data. In this area, the coarse-resolution bedrock DEM is>100m lower than the embedded high-resolution bedrock DEM, causing a slope which is most likely artificial and may influence the basin area calculation significantly. However, this possible problem in the input dataset does not influence the main result that even with the simple model used here, high-resolution data from InSAR and ice-penetrating radar are necessary to capture the change in drainage area with rising water-pressure potential.
The Greenland Survey has measured the water flux of the entire Tasersiaq basin since 1975, with a data gap for 1994 only, yielding a mean value of 19.5×10⁸ m3 a–1with a standard deviation of 9.0×10⁸ m3 a–1. The percentage of the modelled runoff in comparison to the measured mean run-off is shown in the last column of Table 1. The estimate of the run-off from the basin area not covered by the Inland Ice Sheet (the first row of Table 1) is based on a mean precipitation of 0.25 ma–1 w.e. and the assumption that all precipitation in this region eventually runs off. This leaves 75% of the run-off to be explained by ice-sheet meltwater. None of the basin configurations seem to correspond well to this fraction, but the high variability of the measured run-off suggests that there may be a switch from one type of basin configuration (e.g. basin A) to another (e.g. basin E) during some years. Some of this variability may of course be explained by changes in meteorological and glacio-logicalparameters causing variations in meltwater production and precipitation off the ice sheet, but changes from year to year in the variation of the k-factor over the ablation season could explain a significant part of the run-off variability. The two main conclusions emerging from this are
The standard elevation models available for the ice-sheet surface (Reference EkholmEkholm, 1996) and bedrock (Reference Bamber, Layberry and GogineniBamber and others, in press) seem insufficient for delineating hydrological ice-sheet basins, whereas the high-resolution elevation models seem much more promising.
Variations in the basin configuration as a function of the hydraulic k-factor may be large and non-trivial when high-resolution data are employed in the calculation of the water-pressure potential.
Acknowledgements
This paper is published with the permission of the Geological Survey of Denmark and Greenland. The study was carried out as part of the Danish Research Agency-funded project Imersuaq (Hydropower; New Methods––New Knowledge ––New Evaluation). The Greenland Survey provided the basin-discharge data. The European Space Agency owns the copyright to the ERS-1/-2 images. We are grateful to S. Ekholm for providing the GCPs used in the baseline correction. Thanks to S. Starkweather for providing the top-of-atmosphere radiation code, W. Greuell and K. Steffen for useful discussions on the energy-balance model andJ. Box for providing pressure data from the Program for Arctic Regional Climate Assessment (PARCA) GC-Net. The efforts of editor H. Rott and two anonymous reviewers improved the paper significantly.



