Introduction
Tissue histochemistry for the mitochondrial enzyme, cytochrome oxidase (CO), reveals a curious array of vertical columns in the primary visual cortex (striate cortex, V1). These zones of enhanced metabolic activity, known as “patches” or “blobs”, are most striking in layers 2/3 (Hendrickson et al., Reference Hendrickson, Hunt and Wu1981; Horton & Hubel, Reference Horton and Hubel1981). Their function remains unclear. In human and macaque, they are arranged in rows that are aligned with ocular dominance columns in layer 4 (Horton, Reference Horton1984). However, in squirrel monkey, bushbaby, and owl monkey, the ocular dominance columns bear no relationship to CO patches (Xu et al., Reference Xu, Bosking, White, Fitzpatrick and Casagrande2005; Adams & Horton, Reference Adams and Horton2006; Kaskan et al., Reference Kaskan, Lu, Dillenburger, Roe and Kaas2007). In the upper layers, CO patches receive a direct projection from koniocellular neurons in the lateral geniculate nucleus (Livingstone & Hubel, Reference Livingstone and Hubel1982; Fitzpatrick et al., Reference Fitzpatrick, Itoh and Diamond1983; Horton, Reference Horton1984; Hendry & Yoshioka, Reference Hendry and Yoshioka1994; Ding & Casagrande, Reference Ding and Casagrande1997). This input may account for why patches stain more darkly for CO. The layers of the cortex that receive a direct geniculate projection—2/3, 4C, 4A, and 6—exhibit the highest levels of CO activity in striate cortex.
Soon after the CO patches were discovered, they were shown in layer 2/3 to coincide with the pattern seen by immunocytochemical staining for glutamic acid decarboxylase (GAD) (Hendrickson et al., Reference Hendrickson, Hunt and Wu1981). This enzyme is concentrated in the somata of inhibitory neurons, where γ-aminobutyric acid (GABA) is synthetized. After synthesis, GABA is packaged into synaptic vesicles by a vesicular GABA transporter (VGAT) (McIntire et al., Reference McIntire, Reimer, Schuske, Edwards and Jorgensen1997). VGAT is localized preferentially to nerve terminals, and its staining pattern is thought to correspond most closely to the actual distribution of inhibitory synapses in brain tissue (Conti et al., Reference Conti, Minelli and Melone2004). It is conceivable that GABAergic neurons are located preferentially in CO patches, but the bulk of their axonal projections terminates outside patches. In that case, one might expect to find a discrepancy between the patterns of GAD and VGAT labeling. To investigate this possibility, we compared the density of GAD and VGAT labeling with the layout of CO patches in layer 2/3 of macaque striate cortex.
Materials and methods
Experiments were conducted in two Rhesus monkeys obtained from the California National Primate Research Center, Davis, CA. The animals were mature females being used by other laboratories for experiments unrelated to neuroscience. The brains were donated for our research. Procedures were approved by the Institutional Animal Care and Use Committee at the University of California, Davis.
Each animal was killed with an intravenous injection of pentobarbital (150 mg/kg). No perfusion was performed. The brain was removed and placed into 2% paraformaldehyde in 0.1 m phosphate buffer solution (PBS), pH 7.4, at 4°C. The next day each occipital operculum was removed and immersed in 2% paraformaldehyde in 0.1 m PBS with 30% sucrose for 2 days at room temperature. A glass slide was placed against the pial surface with a 50 g weight on top to flatten the block. Tangential sections were cut at 30 µm on a freezing microtome. Every third section was mounted on a slide and dried. It was subsequently reacted for CO activity (Wong-Riley, Reference Wong-Riley1979). The other two sections were collected in 10 mM phosphate buffered saline and processed free-floating for either GAD or VGAT immunocytochemistry.
GAD immunocytochemistry was performed using standard methods (Hendrickson et al., Reference Hendrickson, Hunt and Wu1981; Hendry, Reference Hendry1991; Weltzien et al., Reference Weltzien, Dimarco, Protti, Daraio, Martin and Grunert2014). In brief, sections were preincubated in 10 mM phosphate buffered saline containing 0.3% Triton-X and 10% normal horse serum for 4 h. Next, they were incubated in 10 mM phosphate buffered saline with 1% normal horse serum containing a mouse monoclonal antibody specific for primate GAD 65/67 (San Cruz Biotechnology sc-365180) at a dilution of 1:500 for 2 days. After exposure to a secondary antibody for 4 h, the sections were processed using the avidin-biotin-peroxidase technique (Elite ABC kit, Vector Laboratories). Peroxidase activity was revealed by reacting the sections in 3,3’-diaminobenzidine with 0.1% H2O2. Sections were mounted onto glass slides, air dried, and coverslipped with Permount.
VGAT immunocytochemistry was carried out in similar fashion (Chaudhry et al., Reference Chaudhry, Reimer, Bellocchio, Danbolt, Osen, Edwards and Storm-Mathisen1998). A mouse monoclonal antibody to VGAT (Synaptic Systems, 031011) was used at a dilution of 1:1000.
Results
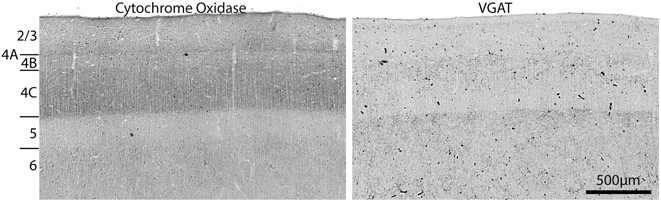
The densest CO activity was present in layers 4A and 4C, followed by layers 2/3 and 6 (Fig. 1). VGAT immunostaining was richest in the upper portion of layer 4 and layer 5, with an intermediate level in layer 2/3. Interestingly, VGAT immunostaining at the base of layer 4C was relatively weak, where CO activity was maximal.
Laminar distribution of CO and VGAT in macaque striate cortex. CO is darkest in layers 4C and 4A. VGAT immunostaining is strongest in upper layer 4 and layer 5. The sharpest transition is at the layer 4C/5 border, where the labels are opposite in distribution.

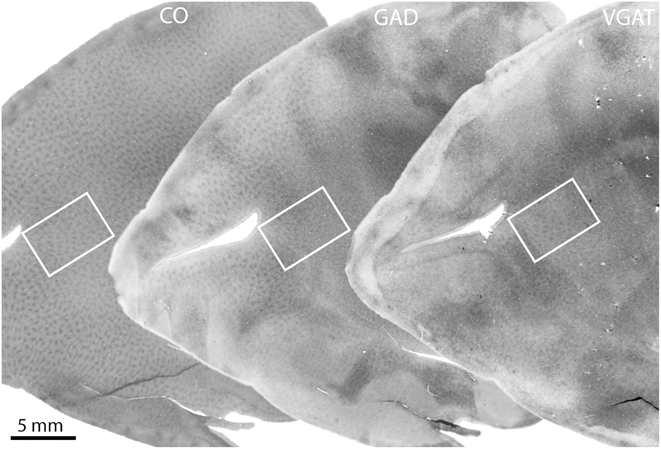
A tangential section through layer 2/3 showed a typical array of CO patches (Fig. 2). Although the ocular dominance columns were not labeled, it was obvious that the patches were organized into parallel rows, which approached the V1/V2 border at right angles. An adjacent section processed for GAD showed a similar array of patches, as expected (Hendrickson et al., Reference Hendrickson, Hunt and Wu1981). There was some blotchy unevenness to the overall intensity of labeling, which often occurs when performing immunocytochemistry in large free-floating tissue sections. The reason is unclear. The next section, processed for VGAT, also showed an array of patches throughout layer 2/3. The labeling was also uneven, but nevertheless, in some regions a pattern of patches was quite clear.
Comparison of CO, GAD, and VGAT in macaque striate cortex. The far left section shows the array of CO patches in layer 3. An adjacent section, pictured in the middle, shows a similar appearance of GAD patches. The next section, at the right, shows patches of VGAT. Regions enclosed by the white rectangles are shown in Fig. 3.
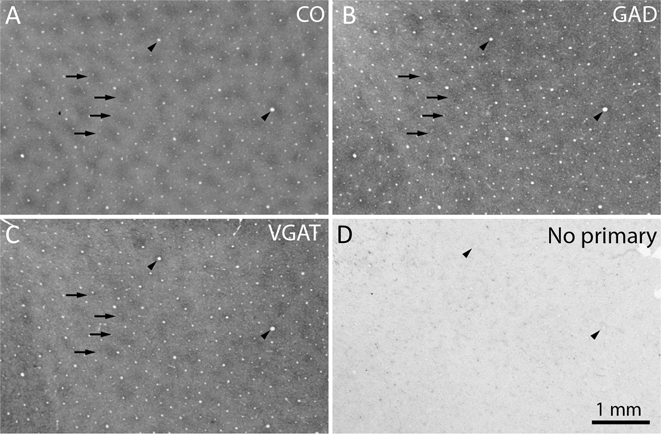
At higher magnification, comparison of the CO patches with the pattern of GAD immunolabeling showed a match (Fig. 3). There was also a close correspondence between the pattern formed by the CO patches and patches of dark VGAT immunolabeling.
GAD and VGAT are localized preferentially in CO patches. (a) CO patches, with 4 examples highlighted by arrows. The arrowheads mark prominent blood vessels, which allow precise alignment of adjacent sections. (b) GAD patches, which match the CO patches (arrows). (c) VGAT patches, which match the CO and GAD patches (arrows). (d) Control section omitting the primary antibody shows only light background labeling from endogenous peroxidase activity in red blood cells.
The distribution of CO, GAD, and VGAT was examined in a second monkey. This animal also showed patches of GAD and VGAT immunolabeling, which coincided with the location of CO patches in the upper layers.
Discussion
Compared to interpatches, the patches in striate cortex are enriched not only in CO activity but also in lactate dehydrogenase, succinate dehydrogenase, β-nicotinamide adenine dinucleotide, acetylcholinesterase, myelin, nitric oxide synthase, tachykinin, NMDA receptors, AMPA receptors, Na–K ATPase, glutamate, CAT-301, and microtubule-associated protein (for review, see Horton & Adams, Reference Horton and Adams2005). It might have seemed a foregone conclusion that the patches would also show strong immunoreactivity for VGAT, given that they have increased levels of so many other different enzymes, neurotransmitters, receptors, and structural proteins. Inexplicably, however, CO patches contain less zinc, calcineurin, and neurofilament protein than interpatches (Goto & Singer, Reference Goto and Singer1994; Duffy & Livingstone, Reference Duffy and Livingstone2003; Dyck et al., Reference Dyck, Chaudhuri and Cynader2003). Therefore, not every substance exhibits a greater content within CO patches.
Our results confirmed that CO patches have increased GAD levels (Hendrickson et al., Reference Hendrickson, Hunt and Wu1981; Fitzpatrick et al., Reference Fitzpatrick, Lund, Schmechel and Towles1987). We used an antibody that binds to both GAD65 and GAD67. Most neurons contain both isoforms, with the latter being predominant in striate cortex (Hendrickson et al., Reference Hendrickson, Tillakaratne, Mehra, Esclapez, Erickson, Vician and Tobin1994). The richer GAD labeling in patches probably reflects a higher content of the synthetic enzyme in both cell bodies and nerve terminals. Fitzpatrick et al. (Reference Fitzpatrick, Lund, Schmechel and Towles1987) have shown that the concentration of GAD-positive neurons is no higher in patches than in interpatches. It is possible, however, that cell bodies situated in patches contain higher levels of GAD than those in interpatches. Inhibitory nerve terminals in patches may also be larger, more plentiful, or contain more GAD than those in interpatches.
Immunostaining for GABA and for GABAA receptors shows a pattern of labeling that matches the CO patches (Hendry & Carder, Reference Hendry and Carder1992; Hendry et al., Reference Hendry, Huntsman, Viñuela, Möhler, de, Blas and Jones1994). The same is true for parvalbumin, a calcium-binding protein associated with GABAergic interneurons. However, calbindin, another calcium-binding protein associated with GABAergic interneurons, is exceptional. It shows reduced immunoreactivity in layer 2/3 in zones that correspond to CO patches (Celio et al., Reference Celio, Scharer, Morrison, Norman and Bloom1986). Compared with parvalbumin, calbindin is relatively less abundant in layers that receive a direct projection from the lateral geniculate nucleus. The fact that patches receive a direct geniculate input may explain why their calbindin content is lower.
Cortical layers that receive direct input from the lateral geniculate nucleus exhibit increased CO activity (Horton, Reference Horton1984). This increased CO content is correlated with a higher neuronal firing rate (DeYoe et al., Reference DeYoe, Trusk and Wong-Riley1995). This relationship also holds true in the vertical domain: cells in CO patches have a greater overall firing rate than cells in interpatches (Economides et al., Reference Economides, Sincich, Adams and Horton2011). To explain this finding, one might propose the following idea. Inhibitory neurons located in patches are more active than those in interpatches, as reflected by their higher levels of GAD and GABA. Suppose also that the inhibitory neurons in patches make axonal projections predominately outside patches. This would cause enhanced suppression of cells in interpatches, accounting for their lower firing rate. This hypothesis is ruled out by our finding that VGAT immunoreactivity is stronger in CO patches than interpatches. In fact, both excitatory synapses and inhibitory synapses are more active in patches compared to interpatches (Wong-Riley, Reference Wong-Riley, Peters and Rockland1994; Nie & Wong-Riley, Reference Nie and Wong-Riley1996).
Recently, progress has been made in classifying the diverse populations of GABAergic interneurons in the cortex (DeFelipe et al., Reference DeFelipe, Lopez-Cruz, Benavides-Piccione, Bielza, Larranaga, Anderson, Burkhalter, Cauli, Fairen, Feldmeyer, Fishell, Fitzpatrick, Freund, Gonzalez-Burgos, Hestrin, Hill, Hof, Huang, Jones, Kawaguchi, Kisvarday, Kubota, Lewis, Marin, Markram, McBain, Meyer, Monyer, Nelson, Rockland, Rossier, Rubenstein, Rudy, Scanziani, Shepherd, Sherwood, Staiger, Tamas, Thomson, Wang, Yuste and Ascoli2013). Unfortunately, we could not distinguish reliably the morphology of different GABAergic interneurons in tissue sections processed for GAD immunocytochemistry. In any case, so far, no class of morphologically distinct cortical neurons has been found to be located preferentially within CO patches in layer 2/3 (Hübener & Bolz, Reference Hübener and Bolz1992). It is surprising that patches have unique inputs and outputs but no predilection for a particular cortical cell type.
In striate cortex, the laminar distribution of CO, GAD, GABA, and the subunits of the GABAA receptor are similar (Fitzpatrick et al., Reference Fitzpatrick, Lund, Schmechel and Towles1987; Hendry & Carder, Reference Hendry and Carder1992; Hendry et al., Reference Hendry, Huntsman, Viñuela, Möhler, de, Blas and Jones1994). Their activity is most robust in the layers (2/3, 4A, 4C, 6) that receive direct input from the lateral geniculate nucleus. Surprisingly, the laminar distribution of VGAT was quite different (Fig. 1). This finding was not expected and remains to be correlated with the organization of the interlaminar projections of inhibitory cells in striate cortex.
Acknowledgment
Technical support was provided by Valerie L. Wu. We thank Stewart Hendry and Robert Edwards for advice regarding GAD and VGAT immunohistochemistry, respectively. This work was supported by grants EY10217 (J.C.H.), EY02162 (Beckman Vision Center) from the National Eye Institute and a Physician Scientist award from Research to Prevent Blindness. The California National Primate Research Center is supported by NIH Base Grant RR00169.